PZ Support Resistance MT5
- 지표
- 버전: 7.0
- 업데이트됨: 19 7월 2024
- 활성화: 20

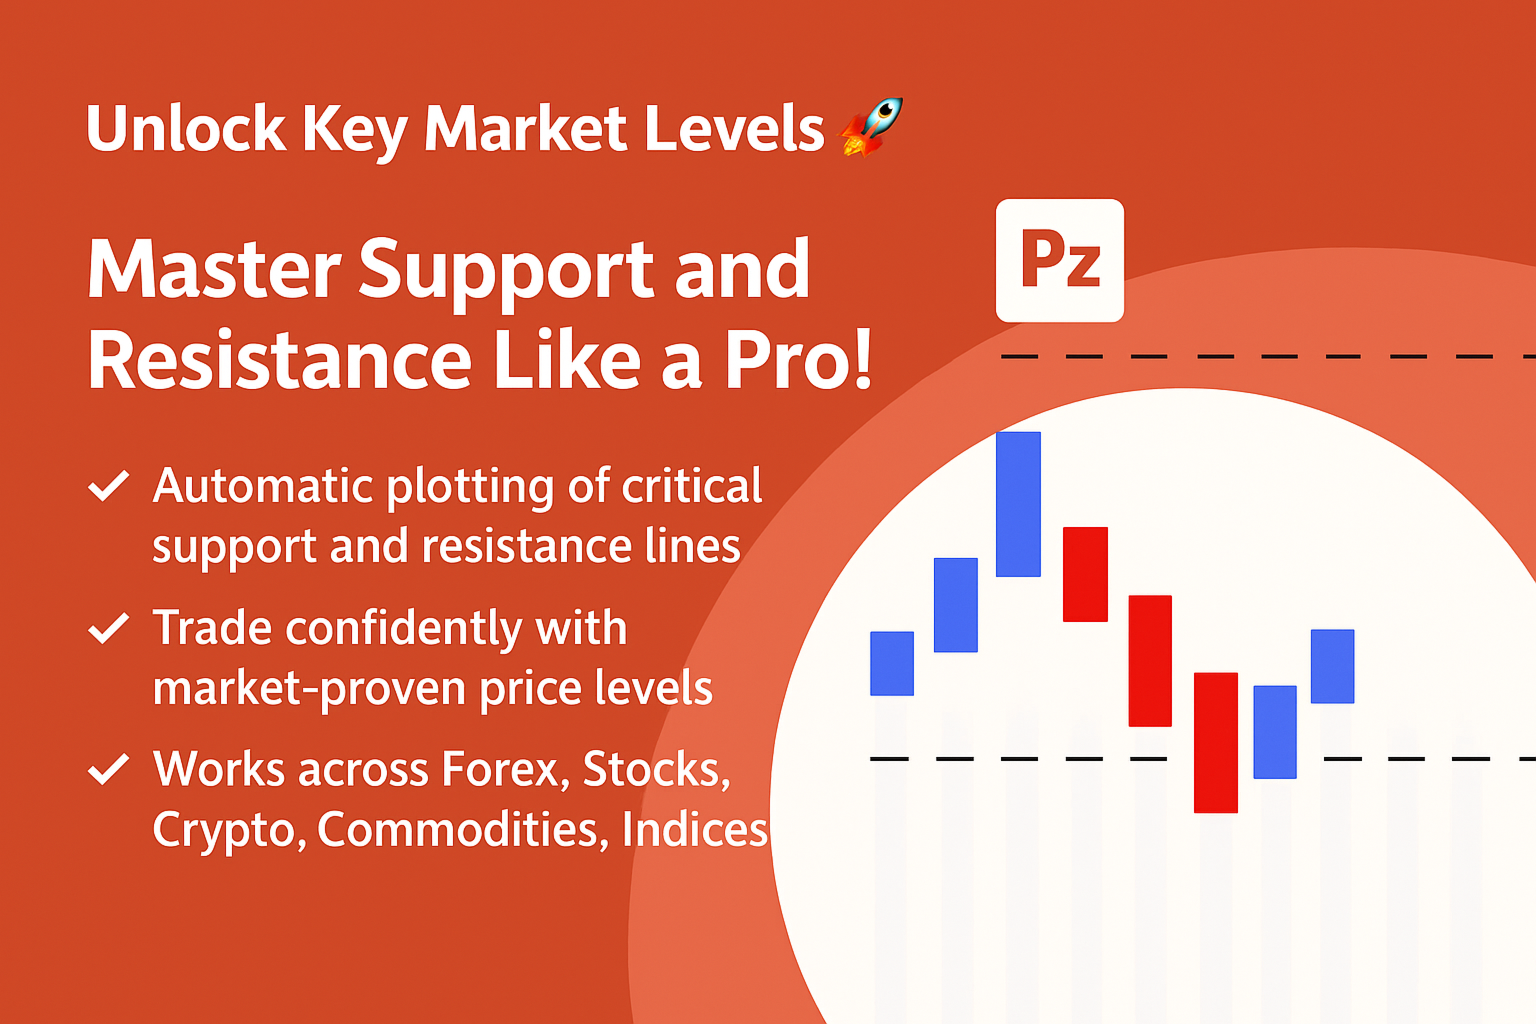
Unlock key market insights with automated support and resistance lines
Tired of plotting support and resistance lines? This is a multi-timeframe indicator that detects and plots supports and resistance lines in the chart with the same precision as a human eye would. As price levels are tested over time and its importance increases, the lines become thicker and darker, making price leves easy to glance and evaluate.
[ Installation Guide | Update Guide | Troubleshooting | FAQ | All Products ]
- Boost your technical analysis
- Customizable timeframe selection
- Read price levels from the timeframe of your choosing
- Detect important price levels without browsing through charts
- Recognize the relative strength of all price levels at a glance
- Save up to half an hour of plotting lines for every trade
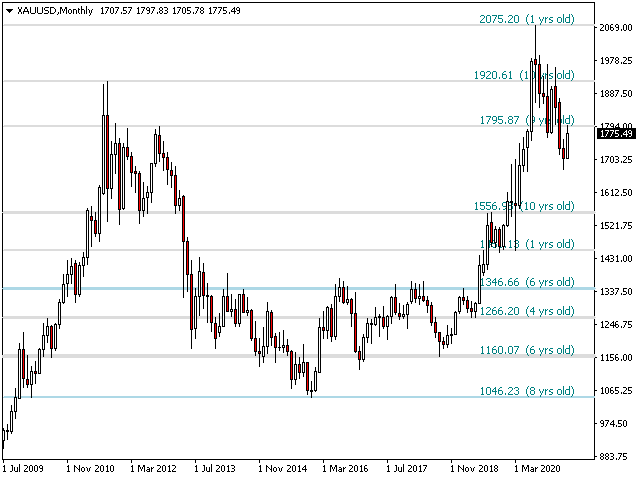
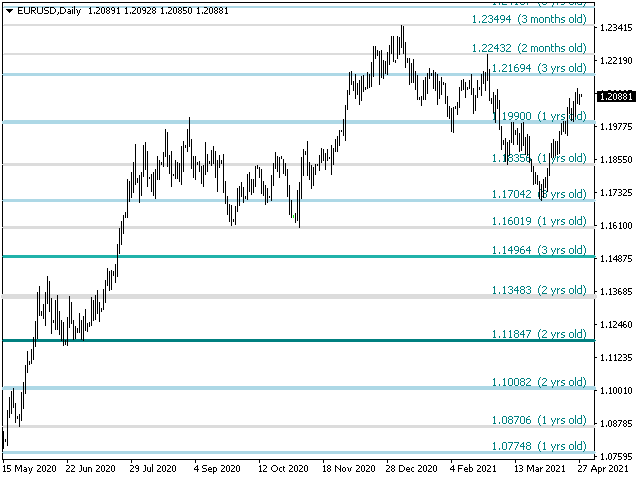
- The indicator displays the age of all price levels
Price levels are collapsed by proximity and adjusted to the current market action.
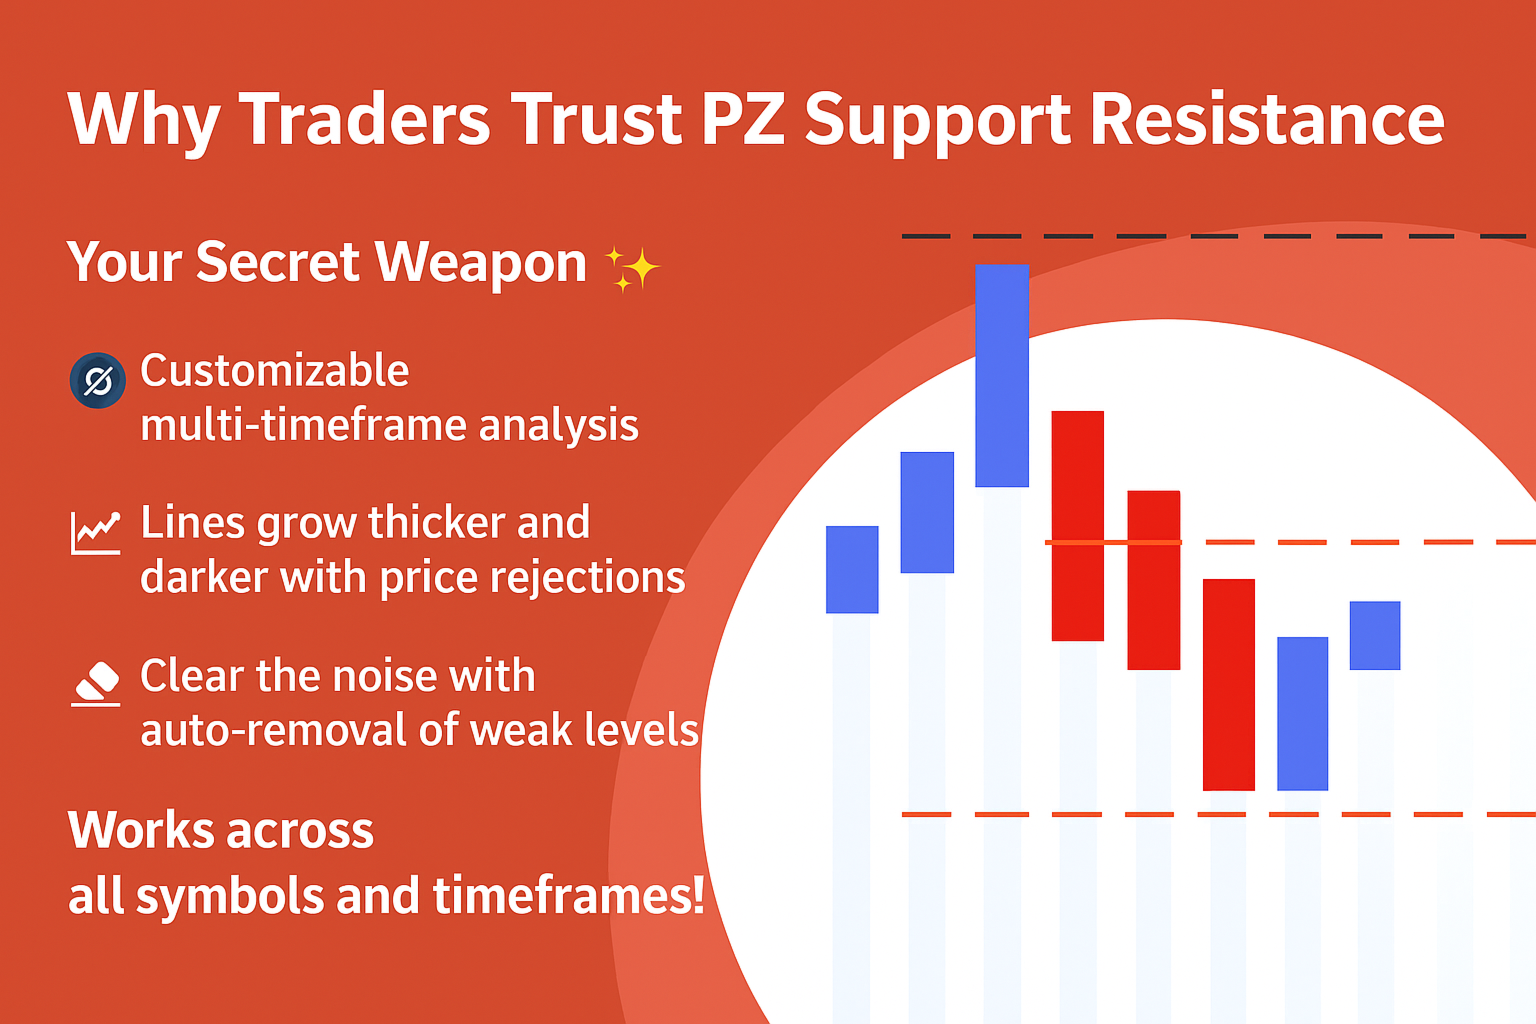
- Price levels get darker and wider as they get rejected over time
- Unimportant price levels are cleared regularly to avoid noise
- It implements email/sound/push alerts for breakouts and false breakouts
Input Parameters
- Timeframe: Choose the period to read price data from. Can be current or higher.
- Period: Zigzag period used to read price points from. Zero means the indicator will choose the best period.
- ATR Period: ATR period used to collapse prices by proximity.
- ATR Multiplier: ATR multiplier used to collapse prices by proximity. A higher value will produce less lines.
- Max History Bars: Amount of past bars to iterate in the indicator finding prices.
- Color Settings: Enter your desired colors for support and resistance lines based on importance.
- Label Settings: Display or hide age labels and customise colors and sizes.
- Alerts: Enable display/email/push/sound alerts for breakouts and fake breakouts.
Author
Arturo López Pérez, private investor and speculator, software engineer and founder of Point Zero Trading Solutions.


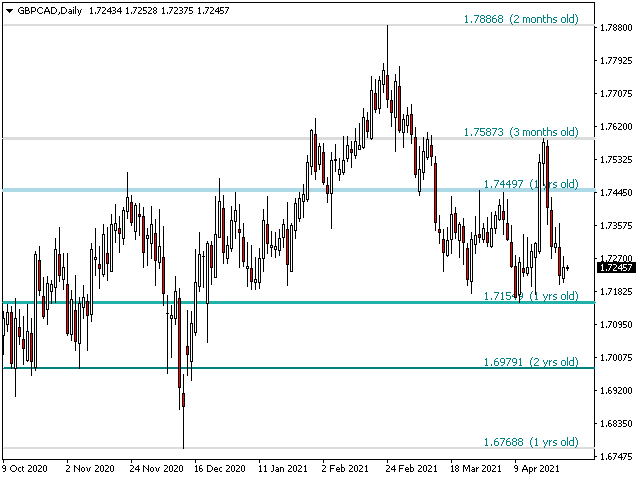
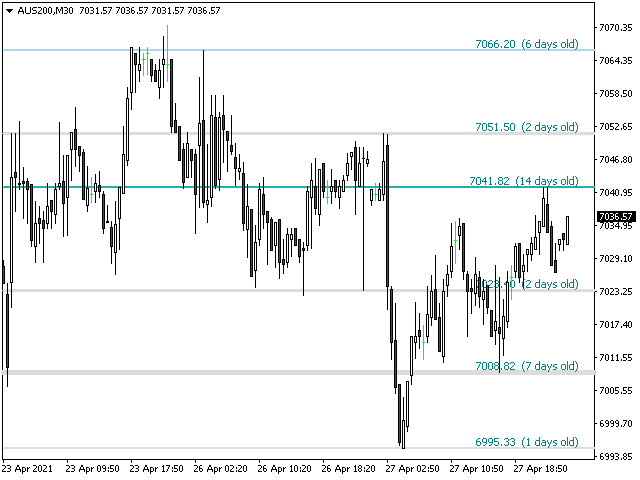
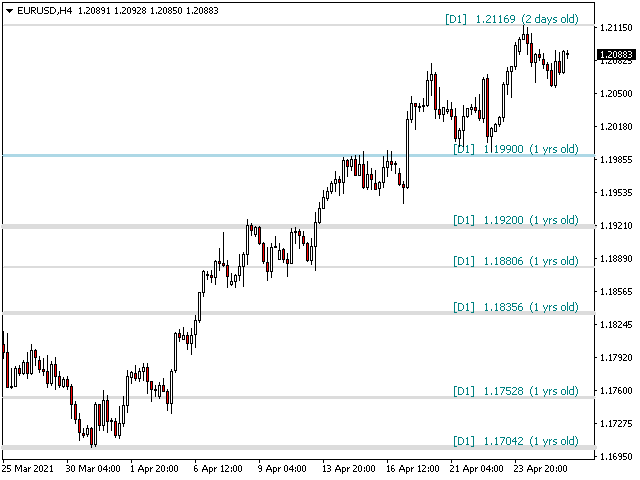
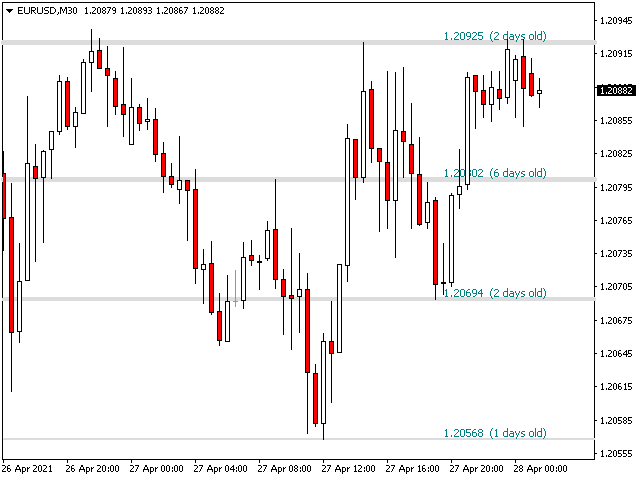
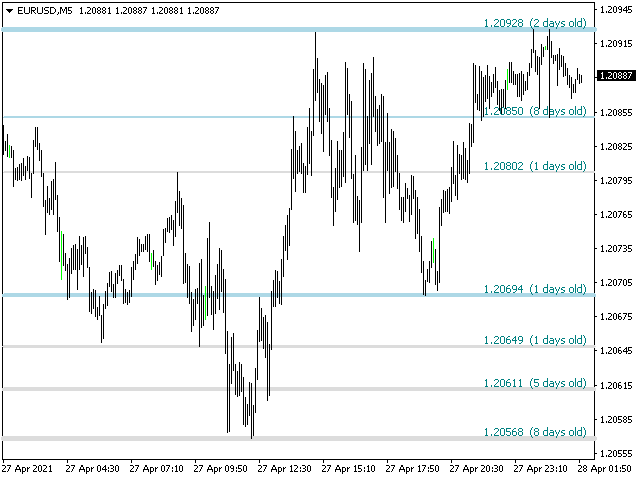
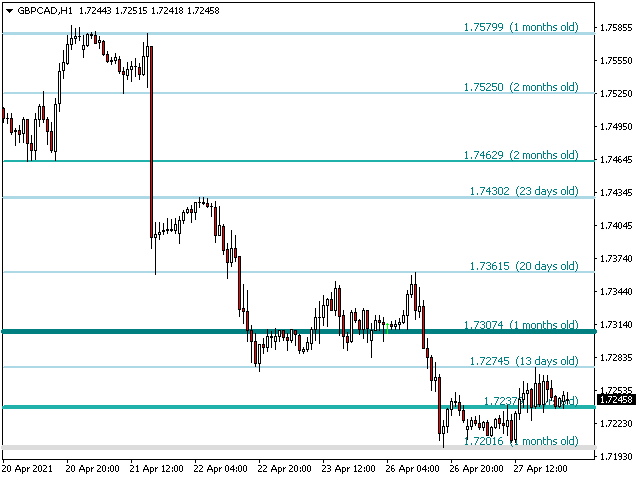


I have bought multiple products from PZ over the past 14 years, they are always well coded and you get excellent support. I had bought the MT4 version of this indicator a number of years ago, with now having transitioned to using MT5, I was missing having this in my charts. I did start having an Mt4 and MT5 platform open, so I could still see the indiactor running and the levels on the charts, then I tried some other S&R indicators, but they don't show the age of the support and/or resistance lines, which is what I really missed. Have a look at the screen shots and you will see on the far right the age, this is really helpful in knowing if you are looking at a new S&R line, or one that has been holding for a long time. I use it on a M5 chart these days, and leave the setting on current, but you can set it to daily if you want to see the larger timeframe lines. If you do this, you will see D1 in text on the S&R line, even if you are looking at and on an M5 chart which is really helpful.