거래 로봇을 무료로 다운로드 하는 법을 시청해보세요
당사를 Facebook에서 찾아주십시오!
당사 팬 페이지에 가입하십시오
당사 팬 페이지에 가입하십시오
스크립트가 마음에 드시나요? MetaTrader 5 터미널에서 시도해보십시오
- 게시자:
- Nikolay Kositsin
- 조회수:
- 45
- 평가:
- 게시됨:
-
이 코드를 기반으로 한 로봇이나 지표가 필요하신가요? 프리랜스로 주문하세요 프리랜스로 이동
실제 저자:
미샤야
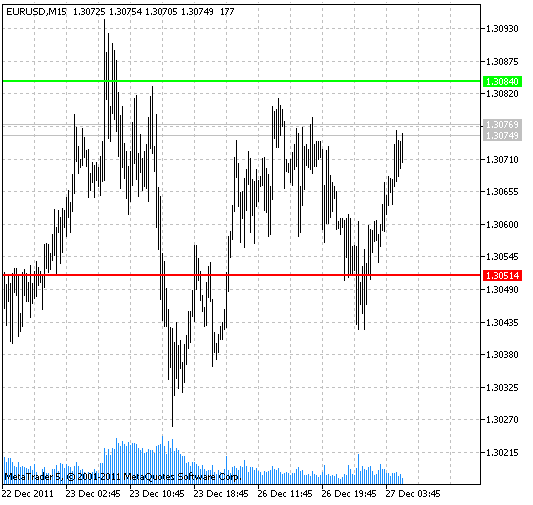
일일 가격 범위 예측. 이 지표는 전날의 가격 수준을 기준으로 예측한 당일의 저항 및 지지 수준을 보여줍니다. 레벨을 계산하는 공식은 토마스 데마크의 저서 "기술적 분석 - 새로운 과학" 에서 찾을 수 있습니다.
이 지표는 MQL4에서 처음 구현되었으며 2008.02.15 mql4.com의 코드베이스에 게시되었습니다.

그림 1 데일리레인지 인디케이터
MetaQuotes Ltd에서 러시아어로 번역함.
원본 코드: https://www.mql5.com/ru/code/783
 SeNSetiVe
거래를 위한 신호를 제공하는 추세 지표입니다. 인디케이터의 색상은 시장 움직임의 방향에 따라 달라지며, 이는 영선을 기준으로 한 인디케이터의 위치에 따라 결정됩니다.
 KSU_martin
마틴게일 거래 마감
 HST에 기록 저장
스크립트는 호가 기록을 HST 형식으로 저장합니다. 이 파일 형식은 메타트레이더 4에서 지원되며 터미널 시세 기록으로 가져오거나 독립형 차트로 열 수 있습니다.
 Bollinger Bands Squeeze
이는 시장 변동성이 낮은 시기가 곧 끝나고 가격 상승을 예고하는 신호입니다.