
예제로 패턴 살펴보기(1부): 멀티 탑
내용
들어가기
패턴은 많은 트레이더가 사용하기 때문에 인터넷에서 자주 논의됩니다. 패턴은 이후의 가격 방향을 결정하기 위한 시각적 분석 기준이라고 할 수 있습니다. 그러나 알고리즘 트레이딩은 이와 다릅니다. 알고리즘 트레이딩에는 시각적 기준이 있을 수 없습니다. EA와 지표에는 가격 계열을 사용하는 개별적인 방법이 있습니다. 양쪽 모두 장단점이 있습니다. 코드는 인간의 사고의 폭과 분석의 질에 비해 부족하지만 비교할 수 없는 속도와 단위 시간당 처리되는 수치 또는 논리적 데이터의 양이 비교할 수 없을 정도로 많다는 장점이 있습니다. 기계에 무엇을 해야 할지 지시하는 것은 쉽지 않습니다. 이를 위해서는 약간의 연습이 필요합니다. 시간이 지남에 따라 프로그래머는 기계를 이해하기 시작하고 기계는 프로그래머를 이해하기 시작합니다. 이 시리즈는 생각을 구조화하고 복잡한 작업을 더 간단한 단계로 나누는 방법을 배우는 초보자에게 유용할 것입니다.
반전 패턴 정보
개인적으로 반전 패턴에 대해서는 모호한 정의가 많은거 같다고 생각합니다. 또한 근거가 되는 기본적인 수학이 없습니다. 솔직히 말해서 어떤 패턴이든 밑바탕에 깔린 수학적 근거가 없으므로 우리가 고려할 수 있는 유일한 수학은 통계 뿐입니다. 통계는 진실의 유일한 기준이며 통계는 실제 거래를 기반으로 작성됩니다. 아주 정확한 통계를 제공할 수 있는 출처는 없습니다. 특정 연구 문제에 대해 이러한 데이터를 제공하는 것은 의미가 없습니다. 여기서 유일한 해결책은 전략 테스터의 백테스팅과 시각화입니다. 이 접근 방식은 데이터 품질은 낮지만 데이터의 양과 함께 속도가 빠르다는 확실한 장점이 있습니다.
물론 반전 패턴은 추세 반전을 결정하는 데 충분한 도구는 아니지만 레벨 또는 캔들 분석과 같은 다른 분석 방법과 함께 사용하면 좋은 결과를 나타내 줄 수 있습니다. 이 시리즈 기사에서는 패턴을 특별히 흥미로운 분석 방법으로 간주하지는 않습니다. 그러나 알고리즘 트레이딩 기술을 연습하는 데 사용될 수 있습니다. 연습하는 것 외에도 알고 트레이딩 이외 트레이더의 눈을 위한 흥미롭고 유용한 보조적인 도구들을 얻을 수 있습니다. 유용한 지표는 매우 중요합니다.
멀티 탑 - 특정 기능
이 패턴은 단순성 때문에 인터넷에서 꽤 인기가 있습니다. 이 패턴은 복잡하지 않기 때문에 다양한 거래 상품과 다양한 차트 시간대에서 매우 흔하게 볼 수 있습니다. 또한 패턴을 자세히 살펴보면 알고 트레이딩과 MQL5 언어의 기능을 사용하여 메서드의 개념을 확장할 수 있음을 알 수 있습니다. 더블 탑으로만 제한되지 않는 일반적인 코드를 우리는 만들어 볼 수 있습니다. 현명하게 만든 프로토타입은 모든 패턴의 유사 작업과 후속작을 탐색하는 데 사용할 수 있습니다.
멀티 탑의 클래식한 후속작은 매우 인기 있는 '헤드 앤 숄더' 패턴입니다. 안타깝게도 이 패턴을 거래하는 방법에 대한 체계적인 정보는 없습니다. 이 문제는 아름다운 단어는 많지만 통계가 없기 때문에 많은 인기 전략에서 흔히 볼 수 있는 문제입니다. 이 기사에서 우리는 알고리즘 트레이딩의 프레임워크에서 이를 사용할 수 있는지 이해하려고 노력할 것입니다. 데모 또는 실계좌에서 거래하지 않고 통계를 수집하는 유일한 방법은 전략 테스터의 기능을 사용하는 것입니다. 이 도구가 없으면 특정 전략에 대한 복잡한 결론을 도출할 수 없습니다.
더블 탑 개념을 확장할 수 있을까요?
이 기사의 주제와 관련하여 더블 탑에서 시작하는 패턴의 트리로 다이어그램을 그려 보겠습니다. 이는 이 개념의 가능성이 얼마나 광범위한지 이해하는 데 도움이 될 것입니다:
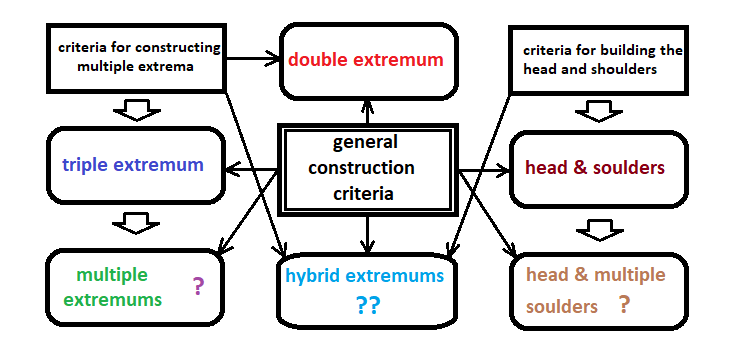
저는 여러 패턴의 개념이 거의 동일한 아이디어에 기반한다는 가정 하에 이들을 결합하기로 결정했습니다. 이 아이디어의 시작은 간단합니다. 어떤 방향에서든 좋은 움직임을 찾고 반전해야 할 위치를 정확하게 결정하는 것입니다. 제안된 패턴을 눈으로 확인한 후 트레이더는 패턴이 특정 기준을 충족하는지 평가하고 목표 및 손절매 수준과 함께 시장 진입 지점을 결정하는 데 도움이 되는 보조선을 올바르게 그려야 합니다. 목표가 대신 이익 실현을 사용할 수 있습니다.
패턴에는 몇 가지의 공통된 구성 원칙이 있으며 이를 기반으로 패턴의 개념이 결합될 수 있습니다. 이러한 명확한 정의가 알고리즘 트레이더와 수동 트레이더의 차이점입니다. 동일한 원칙에 대한 불확실성과 다양한 해석은 실망스러운 결과를 초래할 수 있습니다.
기본 패턴은 다음과 같습니다:
- 더블 탑
- 트리플 탑
- 헤드 앤 숄더
이러한 패턴은 구조와 사용 원칙이 비슷합니다. 위 모든 것은 반전을 식별하는 데 목적이 있습니다. 세 가지 패턴들 모두 보조 라인과 관련하여 유사한 로직을 가지고 있습니다. 더블 탑의 예를 살펴보세요:
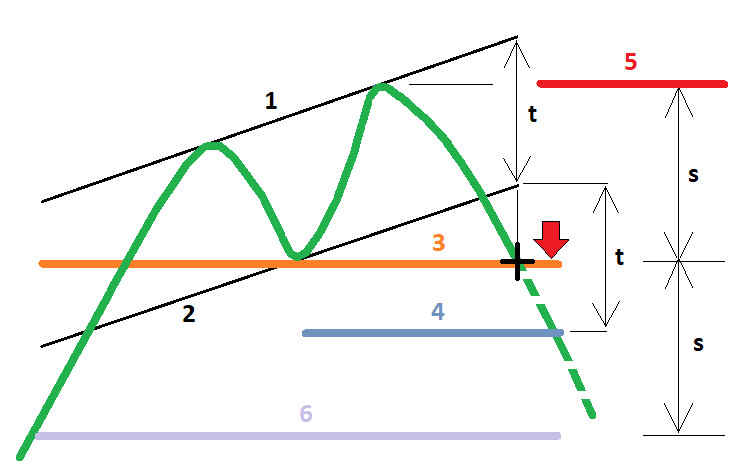
위 그림에서 모든 필수의 줄들은 번호가 매겨져 있으며 다음을 의미합니다:
- 추세 저항
- 비관적인 정점을 정의하기 위한 보조 라인(누군가는 목이라고 생각함)
- 넥 라인
- 낙관적 목표(트레이딩을 위한 이익 실현 수준이기도 함)
- 허용되는 최대 손절매 수준(맨 위에 설정됨)
- 낙관적 예측선(이전 추세 움직임과 동일)
비관적 목표는 시장에 가장 가까운 가장자리에서 넥 라인이 교차하는 지점을 기준으로 결정되며 "1"과 "2" 사이의 거리를 "t"로 표시하고 제안된 반전 방향으로 동일한 거리를 측정합니다. 낙관적 목표의 최소값은 비슷한 방식으로 결정되지만 거리는 "5"와 "3" 사이에서 측정되며 "s”로 표시됩니다.
멀티 탑을 렌더링하는 코드 작성
이러한 패턴을 정의하는 추론적 로직을 정의하는 것부터 시작하겠습니다. 패턴을 찾으려면 바별 로직 즉 틱이 아닌 바별로 작업하는 방식을 고수해야 합니다. 이 경우 불필요한 계산을 피할 수 있으므로 터미널의 부하를 크게 줄일 수 있습니다. 먼저 패턴을 찾을 독립적인 관찰자를 의미하는 클래스를 결정해 보겠습니다. 올바른 패턴을 감지하기 위해 필요한 모든 작업은 인스턴스의 일부가 되므로 검색은 인스턴스 내에서 수행됩니다. 저는 예를 들어 기능을 확장하거나 기존 기능을 수정해야 할 때 코드를 추가로 수정할 수 있도록 하기 위해 이러한 솔루션을 선택한 것입니다.
클래스 맵
클래스의 내용을 고려하는 것부터 시작하겠습니다:
class ExtremumsPatternFamilySearcher// class simulating an independent pattern search
   {
   private:
   int BarsM;// how many bars on chart to use
   int MinimumSeriesBarsM;// the minimum number of bars in a row to detect a top
   int TopsM;// number of tops in the pattern
   int PointsPessimistM;// minimum distance in points to the nearest target
   double RelativeUnstabilityM;// maximum excess of the head size relative to the minimum shoulder
   double RelativeUnstabilityMinM;// minimum excess of the head size relative to the minimum shoulder
   double RelativeUnstabilityTimeM;// maximum excess of head and shoulders sizes
   bool bAbsolutelyHeadM;// whether a pronounced head is required
   bool bRandomExtremumsM;// random selection of extrema


   struct Top// top data
      {
      datetime Datetime0;// time of the candlestick closest to the market
      datetime Datetime1;// time of the next candlestick
      int Index0;// index of the candlestick closest to the market
      int Index1;// index of the next candlestick
      datetime DatetimeExtremum;// time of the top
      int IndexExtremum;// index of the top
      double Price;// price of the top
      bool bActive;// if the top is active (if not, then it does not exist)
      };

   struct Line// line
      {
      double Price0;// price of the candlestick closest to the market, to which the line is bound
      datetime Time0;// time of the candlestick closest to the market, to which the line is bound
      double Price1;// price of the farthest candlestick to which the line is bound
      datetime Time1;// time of the farthest candlestick to which the line is bound
      datetime TimeX;// time of the X point
      int Index1;// index of the left edge
      bool DirectionOfFormation;// direction
      double C;// free coefficient in the equation
      double K;// aspect ratio

      void CalculateKC()// find unknowns in the equation
         {
         if ( Time0 != Time1 ) K=double(Price0-Price1)/double(Time0-Time1);
         else K=0.0;
         C=double(Price1)-K*double(Time1);
         }

      double Price(datetime T)// function of line depending on time
         {
         return K*T+C;
         }
      };

   public:

   ExtremumsPatternFamilySearcher(int BarsI,int MinimumSeriesBarsI,int TopsI,int PointsPessimistI, double RelativeUnstabilityI,
   double RelativeUnstabilityMinI,double RelativeUnstabilityTimeI,bool bAbsolutelyHeadI,bool bRandomExtremumsI)// parametric constructor
      {
      BarsM=BarsI;
      MinimumSeriesBarsM=MinimumSeriesBarsI;
      TopsM=TopsI;
      PointsPessimistM=PointsPessimistI;
      RelativeUnstabilityM=RelativeUnstabilityI;
      RelativeUnstabilityMinM=RelativeUnstabilityMinI;
      RelativeUnstabilityTimeM=RelativeUnstabilityTimeI;
      bAbsolutelyHeadM=bAbsolutelyHeadI;
      bRandomExtremumsM=bRandomExtremumsI;
      bPatternFinded=bFindPattern();
      }

   int FormationDirection;// direction of the formation (multiple top or bottom, or none at all) ( -1,1,0 )
   bool bPatternFinded;// if the pattern was found during formation
   Top TopsUp[];// required upper extrema
   Top TopsDown[];// required lower extrema
   Top TopsUpAll[];// all upper extrema
   Top TopsDownAll[];// all lower extrema
   int RandomIndexUp[];// array for the random selection of the tops index
   int RandomIndexDown[];// array for the random selection of the bottoms index
   Top StartTop;// where the formation starts (top farthest from the market)
   Top EndTop;// where the formation ends (top closest to the market)
   Line Neck;// neck
   Top FarestTop;// top farthest from the neck (will be used to determine the head or the formation size) or the same as the head
   Line OptimistLine;// line of optimistic forecast
   Line PessimistLine;// line of pessimistic forecast
   Line BorderLine;// line at the edge of the pattern
   Line ParallelLine;// line parallel to the trend resistance


   private:
   void SetTopsSize();// setting sizes for arrays with tops
   bool SearchFirstUps();// search for tops
   bool SearchFirstDowns();// search for bottoms
   void CalculateMaximum(Top &T,int Index0,int Index1);// calculate the maximum price between two bars
   void CalculateMinimum(Top &T,int Index0,int Index1);// calculate the minimum price between two bars
   bool PrepareExtremums();// prepare extrema
   bool IsExtremumsAbsolutely();// control the priority of tops
   void DirectionOfFormation();// determine the direction of the formation
   void FindNeckUp(Top &TStart,Top &TEnd);// find neck for the bullish pattern
   void FindNeckDown(Top &TStart,Top &TEnd);// find neck for the bearish pattern
   void SearchFarestTop();// find top farthest from the neck
   bool bBalancedExtremums();// initial balancing of extrema (so that they do not differ much)
   bool bBalancedExtremumsHead();// if a pattern has more than 2 tops, we can check for a pronounced head
   bool bBalancedExtremumsTime();// require that the extrema be not very far in time relative to the minimum distance
   bool bBalancedHead();// balance the head (in other words, require that it be neither the first nor the last one on the list of tops, if there are more than three of them)
   bool CorrectNeckUpLeft();// adjust the neck so as to find the intersection of price and neck (this creates prerequisites for the previous trend)
   bool CorrectNeckDownLeft();// similarly for the bottom
   int CorrectNeckUpRight();// adjust the neck so as to find the intersection of price and neck on the right or at the current price position, which is the same (to determine the entry point)
   int CorrectNeckDownRight();// similarly for the bottom
   void SearchLineOptimist();// calculate the optimistic forecast line
   bool bWasTrend();// determine whether a trend preceded the pattern definition (in this case the optimistic target line is considered as the trend beginning)
   void SearchLineBorder();// determine trend resistance or support (usually a sloping line)
   void CalculateParallel();// determine a line parallel to support or resistance (crosses the neck at the pattern low or high)
   bool bCalculatePessimistic();// calculate the line of the pessimistic target
   bool bFindPattern();// perform all the above actions
   int iFindEnter();// find intersection with the neck
   public:
   void CleanAll();// clean up objects
   void DrawPoints();// draw points
   void DrawNeck();// draw the neck
   void DrawLineBorder();// line at the border
   void DrawParallel();// line parallel to the border
   void DrawOptimist();// line of optimistic forecast
   void DrawPessimist();// line of pessimistic forecast
   };
클래스는 사람이 실제로 있다면 수행할 수 있는 순차적인 작업을 나타냅니다. 어쨌든 어떤 포메이션을 감지하는 것은 서로를 따르는 일련의 간단한 작업으로 나눌 수 있습니다. 수학에는 이런 말이 있습니다: 방정식을 푸는 방법을 모른다면 단순화하라. 이 규칙은 수학 뿐만 아니라 모든 알고리즘에도 적용됩니다. 먼저 탐지 로직이 명확하지 않습니다. 하지만 어디서부터 탐지를 시작해야 하는지 알게 된다면 작업이 훨씬 간단해질 것입니다. 이 경우 전체 패턴을 찾기 위해 우리는 상단 또는 하단 또는 실제로는 둘 다 검색합니다.
상단과 하단 결정
상단과 하단이 없으면 전체 패턴이 의미가 없는데 상단과 하단의 존재는 패턴의 필수 조건이지만 이 조건만으로는 충분하지 않기 때문입니다. 상단을 결정하는 방법에는 여러 가지가 있습니다. 가장 중요한 조건은 뚜렷한 반파의 존재이며 반파는 두 개의 뚜렷한 반대 방향의 움직임으로 결정되며 우리의 경우 한 방향으로 여러 개의 바가 연속적으로 있어야 합니다. 이를 위해 움직임이 있다는 것을 나타내는 한 방향의 최소 바의 수를 결정해야 합니다. 이를 위해 입력 변수를 제공하겠습니다.
bool ExtremumsPatternFamilySearcher::SearchFirstUps()// find tops
   {
   int NumUp=0;// the number of found tops
   int NumDown=0;// the number of found bottoms
   bool bDown=false;// an auxiliary boolean which shows if a segment of bearish candlesticks has been found
   bool bUp=false;// an auxiliary boolean which shows if a segment of bullish candlesticks has been found
   bool bNextUp=true;// can we move on to searching for the next top
   bool bNextDown=true;// can we move on to searching for the next bottom

   for(int i=0;i<ArraySize(TopsUp);i++)// before search, set all necessary tops to an inactive state
      {
      TopsUp[i].bActive=false;
      }
   for(int i=0;i<ArraySize(TopsUpAll);i++)// before search, set all tops to an inactive state
      {
      if (!TopsUpAll[i].bActive) break;
      TopsUpAll[i].bActive=false;
      }


   for(int i=0;i<BarsM;i++)
      {
      if ( i+MinimumSeriesBarsM-1 < BarsM )// if remaining bars are enough to determine the extremum and we can start searching for the next top
         {
         if ( bNextUp )// if it is allowed to search for the next top
            {
            bDown=true;
            for(int j=i;j<i+MinimumSeriesBarsM;j++)// determine the first extrema for upper tops
               {
               if ( Open[j]-Close[j] < 0 )// if at least one of the selected candlesticks was upward
                  {
                  bDown=false;
                  break;
                  }
               }
            if ( bDown )
               {
               TopsUpAll[NumUp].Datetime0=Time[i+MinimumSeriesBarsM-1];
               TopsUpAll[NumUp].Index0=i+MinimumSeriesBarsM-1;
               bNextUp=false;
               }
            }
         }

      if ( MinimumSeriesBarsM+i < BarsM && bDown )// if the remaining bars are enough to determine the second half of the extremum and the previous half has been found
         {
         bUp=true;
         for(int j=i;j<MinimumSeriesBarsM+i;j++)//determine further candlesticks in the opposite direction
            {
            if ( Open[j]-Close[j] > 0 )//if at least one of the selected candlesticks was downward
               {
               bUp=false;
               break;
               }
            }
         if ( bUp )
            {
            TopsUpAll[NumUp].Datetime1=Time[i];
            TopsUpAll[NumUp].Index1=i;
            TopsUpAll[NumUp].bActive=true;
            bNextUp=false;
            }
         }
      // after that, register the found formation as a top, if it is a top
      if ( bDown && bUp )
         {
         CalculateMaximum(TopsUpAll[NumUp],TopsUpAll[NumUp].Index0,TopsUpAll[NumUp].Index1);// calculate extremum between two bars
         bNextUp=true;
         bDown=false;
         bUp=false;
         NumUp++;
         }
      }
   if ( NumUp >= TopsM ) return true;// if the required number of tops have been found
   else return false;
   }
하단은 반대 방식으로 정의됩니다:
bool ExtremumsPatternFamilySearcher::SearchFirstDowns()// find bottoms
   {
   int NumUp=0;
   int NumDown=0;
   bool bDown=false;// an auxiliary boolean which shows if a segment of bearish candlesticks has been found
   bool bUp=false;// an auxiliary boolean which shows if a segment of bullish candlesticks has been found
   bool bNextUp=true;// can we move on to searching for the next top
   bool bNextDown=true;// can we move on to searching for the next bottom

   for(int i=0;i<ArraySize(TopsDown);i++)// before search, set all necessary bottoms to an inactive state
      {
      TopsDown[i].bActive=false;
      }
   for(int i=0;i<ArraySize(TopsDownAll);i++)// before search, set all bottoms to an inactive state
      {
      if (!TopsDownAll[i].bActive) break;
      TopsDownAll[i].bActive=false;
      }

   for(int i=0;i<BarsM;i++)
      {
      if ( i+MinimumSeriesBarsM-1 < BarsM )// if remaining bars are enough to determine the extremum and we can start searching for the next top
         {
         if ( bNextDown )// if it is allowed to search for the next bottom
            {
            bUp=true;
            for(int j=i;j<i+MinimumSeriesBarsM;j++)// determine the first extrema for upper tops
               {
               if ( Open[j]-Close[j] > 0 )//if at least one of the selected candlesticks was downward
                  {
                  bUp=false;
                  break;
                  }
               }
            if ( bUp )
               {
               TopsDownAll[NumDown].Datetime0=Time[i+MinimumSeriesBarsM-1];
               TopsDownAll[NumDown].Index0=i+MinimumSeriesBarsM-1;
               bNextDown=false;
               }
            }
         }

      if ( MinimumSeriesBarsM+i < BarsM && bUp )// if the remaining bars are enough to determine the second half of the extremum and the previous half has been found
         {
         bDown=true;
         for(int j=i;j<MinimumSeriesBarsM+i;j++)//determine further candlesticks in the opposite direction
            {
            if ( Open[j]-Close[j] < 0 )// if at least one of the selected candlesticks was upward
               {
               bDown=false;
               break;
               }
            }
         if ( bDown )
            {
            TopsDownAll[NumDown].Datetime1=Time[i];
            TopsDownAll[NumDown].Index1=i;
            TopsDownAll[NumDown].bActive=true;
            bNextDown=false;
            }
         }
      // after that, register the found formation as a bottom, if it is a bottom
      if ( bDown && bUp )
         {
         CalculateMinimum(TopsDownAll[NumDown],TopsDownAll[NumDown].Index0,TopsDownAll[NumDown].Index1);// calculate extremum between two bars
         bNextDown=true;
         bDown=false;
         bUp=false;
         NumDown++;
         }
      }

   if ( NumDown == TopsM ) return true;//if the required number of bottoms have been found
   else return false;
   }
이 경우에는 프랙탈의 논리를 사용하지 않았습니다. 대신 상한가와 하한가를 결정하는 저만의 로직을 만들었습니다. 프랙탈 보다 더 좋거나 나쁘다고 생각하지는 않지만 적어도 외부의 기능을 사용할 필요는 없습니다. 또한 불필요한 내장 언어 함수를 사용할 필요도 없습니다. 이러한 함수들은 좋을 수도 있지만 이 경우에는 중복됩니다. 이 함수는 우리가 앞으로 작업할 모든 상단과 하단을 결정합니다. 다음 이미지는 이 함수에서 어떤 일이 일어나는지 시각적으로 표현한 것입니다:

먼저 동작 1을 검색한 다음 동작 2를 검색하고 마지막으로 동작 3은 상단 또는 하단을 결정하는 것을 의미합니다. 3에 대한 로직은 다음과 같이 두 개의 개별 함수로 구현됩니다:
void ExtremumsPatternFamilySearcher::CalculateMaximum(Top &T,int Index0,int Index1)// if 2 intermediate points are found, find High between them
   {
   double MaxValue=High[Index0];
   datetime MaxTime=Time[Index0];
   int MaxIndex=Index0;
   for(int i=Index0;i<=Index1;i++)
      {
      if ( High[i] >  MaxValue )
         {
         MaxValue=High[i];
         MaxTime=Time[i];
         MaxIndex=i;
         }
      }
   T.DatetimeExtremum=MaxTime;
   T.IndexExtremum=MaxIndex;
   T.Price=MaxValue;
   }

void ExtremumsPatternFamilySearcher::CalculateMinimum(Top &T,int Index0,int Index1)//if 2 intermediate points are found, find Low between them
   {
   double MinValue=Low[Index0];
   datetime MinTime=Time[Index0];
   int MinIndex=Index0;
   for(int i=Index0;i<=Index1;i++)
      {
      if ( Low[i] <  MinValue )
         {
         MinValue=Low[i];
         MinTime=Time[i];
         MinIndex=i;
         }
      }
   T.DatetimeExtremum=MinTime;
   T.IndexExtremum=MinIndex;
   T.Price=MinValue;
   }
그런 다음 이 모든 것을 미리 준비된 컨테이너에 넣습니다. 로직은 다음과 같습니다: 클래스 내에서 사용되는 모든 구조는 데이터의 점진적인 추가가 필요합니다. 모든 과정과 단계를 통과하면 필요한 데이터가 출력됩니다. 이 데이터를 사용하여 패턴을 차트에 그래픽으로 표시할 수 있습니다. 물론 상단과 하단의 결정 로직은 다를 수 있습니다. 저의 목적은 복잡한 사물에 대한 간단한 탐지 로직을 보여드리는 것입니다.
작업할 상단 선택하기
우리가 찾은 상단과 하단은 중간적인 개념 정도에 불과합니다. 이를 찾은 후에는 어깨 역할을 하기에 가장 적합하다고 생각되는 상단을 선택해야 합니다. 코드에 머신 비전이 없기 때문에 이를 확실히 확인할 수는 없습니다(일반적으로 이러한 복잡한 기술을 사용하면 성능에 도움이 되지 않습니다). 지금은 시장에 가장 가까운 상단을 선택해 보겠습니다:
bool ExtremumsPatternFamilySearcher::PrepareExtremums()// assign the tops with which we will work
   {
   int Quantity;// an auxiliary counter for random tops
   int PrevIndex;// an auxiliary index for maintaining the order of indexes (increment only)

   for(int i=0;i<TopsM;i++)// simply select the tops that are closest to the market
      {
      TopsUp[i]=TopsUpAll[i];
      TopsDown[i]=TopsDownAll[i];
      }
   return true;
   }
심볼 차트에서 시각적으로 로직은 보라색 프레임의 변형과 동일합니다. 선택을 위해 몇 가지 변형을 더 그려보겠습니다:
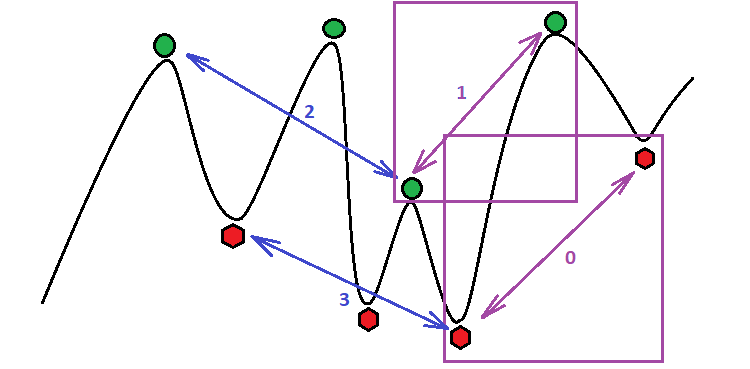
이 경우 선택 로직은 매우 간단합니다. 선택한 변형은 0과 1입니다. 왜냐하면 이들이 시장에 가장 가깝기 때문입니다. 여기서는 모든 것이 더블 탑에 적용됩니다. 그러나 트리플 이상의 멀티플 탑에도 동일한 로직이 사용되며 선택한 탑의 개수만 다를 뿐입니다.
이 기능은 향후 확장되어 위 이미지의 파란색과 같이 무작위로 상단을 선택할 수 있는 기능이 추가될 예정입니다. 이렇게 하면 패턴 파인더의 여러 인스턴스를 시뮬레이션 할 수 있습니다. 이를 통해 우리는 자동 모드에서 모든 패턴을 더 효율적이고 더 자주 찾을 수 있습니다.
패턴 방향 결정하기
상단과 하단을 확인한 후에 우리는 포메이션의 방향을 결정해야 합니다. 만약 시장의 특정 시점에서 이러한 포메이션이 존재한다면 말입니다. 이 단계에서 저는 시장과 가장 가까운 극한 유형이 있는 방향에 더 큰 우선순위를 부여하는 것을 고려했습니다. 이 논리에 따라 시장에 가장 가까운 것은 상단이 아니라 하단이므로 그림에서 변형 0을 사용하겠습니다(시장 상황이 그림과 정확히 동일하다면). 이 부분 코드는 간단합니다:
void ExtremumsPatternFamilySearcher::DirectionOfFormation()// determine whether it is a double top (1) or double bottom (-1) (only if all tops and bottoms are found - if not found, then 0)
   {
   if ( TopsDown[0].DatetimeExtremum > TopsUp[0].DatetimeExtremum && TopsDown[ArraySize(TopsDown)-1].bActive )
      {
      StartTop=TopsDown[ArraySize(TopsDown)-1];
      EndTop=TopsDown[0];
      FormationDirection=-1;
      }
   else if ( TopsDown[0].DatetimeExtremum < TopsUp[0].DatetimeExtremum && TopsUp[ArraySize(TopsUp)-1].bActive )
      {
      StartTop=TopsUp[ArraySize(TopsUp)-1];
      EndTop=TopsUp[0];
      FormationDirection=1;
      }
   else FormationDirection=0;
   }
추가적인 조치를 취하려면 명확하게 결정된 방향이 필요합니다. 방향은 패턴 유형과 동일합니다:
- 멀티 탑
- 멀티 바텀
이러한 규칙은 헤드 앤 숄더 패턴 및 기타 모든 하이브리드 형태에도 적용됩니다. 이 클래스는 이러한 분석 방식의 모든 패턴에 공통적으로 적용되어야 했는데 이 일반성은 이미 부분적으로 작동하고 있습니다.
필터를 사용하여 잘못된 패턴을 삭제합니다:
이제 더 나아가 보겠습니다. 우리는 상단과 하단을 선택하는 방향과 방법 중 하나가 있다는 것을 알고 있으므로 여러 개의 상단에 대해 다음과 같아야 합니다: 선택한 상단 사이의 상단은 선택한 하단보다 낮아야 합니다. 여러 개의 하단의 경우 이러한 하단은 선택한 하단의 가장 높은 상단 보다 높아야 합니다. 이 경우 상단이 무작위로 선택되면 선택된 모든 상단이 명확하게 구분됩니다. 그렇지 않은 경우 이러한 확인은 필요하지 않습니다:
bool ExtremumsPatternFamilySearcher::IsExtremumsAbsolutely()// require the selected extrema to be the most extreme ones
   {
   if ( bRandomExtremumsM )// check only if we have a random selection of tops (in other case the check should be considered completed)
      {
      if ( FormationDirection == 1 )
         {
         int StartIndex=RandomIndexUp[0];
         int EndIndex=RandomIndexUp[ArraySize(RandomIndexUp)-1];
         for(int i=StartIndex+1;i<EndIndex;i++)// check all tops between the selected ones
            {
            for(int j=0;j<ArraySize(TopsUp);j++)
               {
               if ( TopsUpAll[i].Price >= TopsUp[j].Price )
                  {
                  for(int k=0;k<ArraySize(RandomIndexUp);k++)
                     {
                     if ( i != RandomIndexUp[k] ) return false;
                     }
                  }
               }
            }
         return true;
         }
      else if ( FormationDirection == -1 )
         {
         int StartIndex=RandomIndexDown[0];
         int EndIndex=RandomIndexDown[ArraySize(RandomIndexDown)-1];
         for(int i=StartIndex+1;i<EndIndex;i++)// check all tops between the selected ones
            {
            for(int j=0;j<ArraySize(TopsDown);j++)
               {
               if ( TopsDownAll[i].Price <= TopsDown[j].Price )
                  {
                  for(int k=0;k<ArraySize(RandomIndexDown);k++)
                     {
                     if ( i != RandomIndexDown[k] ) return false;
                     }
                  }
               }
            }
         return true;
         }
      else return false;
      }
   else
      {
      return true;
      }
   }
마지막 술어 함수에 의해 수행되는 무작위 상단 선택과 관련한 올바른 변형과 잘못된 변형을 시각적으로 표시하면 다음과 같이 표시됩니다:
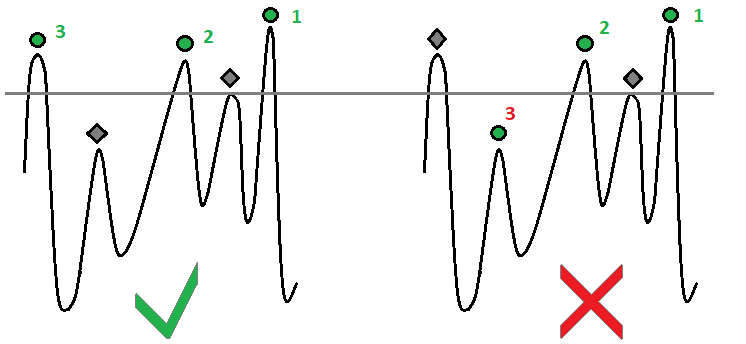
이러한 기준은 강세 및 약세 패턴에 반영됩니다. 그림은 강세 패턴을 예로 들어 보여주고 있습니다. 두 번째 경우는 쉽게 예상할 수 있습니다.
모든 준비 절차가 완료되면 목을 검색할 수 있습니다. 트레이더 마다 목을 그리는 방식이 다릅니다. 저는 임시로 몇 가지 유형의 구성을 결정했습니다:
- 시각적으로 기울어짐(그림자 기준이 아님)
- 시각적, 수평적(그림자 기준이 아님)
- 기울어진 최고점 또는 최저점(그림자 기준)
- 최고점 또는 최저점, 수평(그림자 기준)
안전상의 이유와 수익 가능성을 높이기 위해 최적의 변형은 4라고 생각합니다. 저는 다음과 같은 이유로 이 방법을 선택했습니다:
- 반전 움직임의 시작이 더 명확하게 발견됩니다.
- 이 접근 방식은 코드에서 구현하기가 더 쉽습니다.
- 경사는 모호하지 않게 (수평으로) 결정됩니다.
아마도 이것은 구성의 관점에서 볼 때 완전히 정확하지 않습니다. 저는 아직 명확한 규칙을 찾지 못했습니다. 이는 알고리즘 트레이딩의 관점에서는 중요하지 않습니다. 이 패턴에서 합리적인 무언가를 발견하면 테스터나 시각화에서도 분명히 무언가가 나타날 것입니다. 추가적인 작업을 통해 거래 결과를 더 확실히 할 수 있을지 모르나 그럴 경우 완전히 다른 작업이 됩니다.
저는 목의 모든 필요한 매개 변수를 정의하는 강세 및 약세 패턴에 대한 두 가지 미러 함수를 만들었습니다:
void ExtremumsPatternFamilySearcher::FindNeckUp(Top &TStart,Top &TEnd)// find the neck line based on the two extreme tops (for the classic multiple top)
   {
   double PriceMin=Low[TStart.IndexExtremum];
   datetime TimeMin=Time[TStart.IndexExtremum];
   for(int i=TStart.IndexExtremum;i>=TEnd.IndexExtremum;i--)// define the lowest point
      {
      if ( Low[i] < PriceMin )
         {
         PriceMin=Low[i];
         TimeMin=Time[i];
         }
      }
   // define the parameters of the anchor point and all parameters of the line equation
   Neck.Price0=PriceMin;
   Neck.TimeX=TimeMin;
   Neck.Time0=Time[0];
   Neck.Price1=PriceMin;
   Neck.Time1=TStart.DatetimeExtremum;
   Neck.DirectionOfFormation=true;
   Neck.CalculateKC();
   }

void ExtremumsPatternFamilySearcher::FindNeckDown(Top &TStart,Top &TEnd)// find the neck line based on two extreme bottoms (for the classic multiple bottom)
   {
   double PriceMax=High[TStart.IndexExtremum];
   datetime TimeMax=Time[TStart.IndexExtremum];
   for(int i=TStart.IndexExtremum;i>=TEnd.IndexExtremum;i--)// define the lowest point
      {
      if ( High[i] > PriceMax )
         {
         PriceMax=High[i];
         TimeMax=Time[i];
         }
      }
   // define the parameters of the anchor point and all parameters of the line equation
   Neck.Price0=PriceMax;
   Neck.TimeX=TimeMax;
   Neck.Time0=Time[0];
   Neck.Price1=PriceMax;
   Neck.Time1=TStart.DatetimeExtremum;
   Neck.DirectionOfFormation=false;
   Neck.CalculateKC();
   }
목을 정확하고 간단하게 그리려면 선택한 모든 패턴의 목 구성에 대해 동일한 규칙을 사용하는 것이 좋습니다. 한편으로 이것은 불필요한 세부 사항을 제거합니다. 우리의 경우 그리 필요하지 않습니다. 복잡한 다중 상단의 목을 만들려면 패턴의 두 극단적인 상단을 사용하는 것이 좋습니다. 이 피크의 지수는 선택한 시장 구간에서 최저 또는 최고 가격을 검색할 지수가 됩니다. 목은 규칙적인 수평선이 됩니다. 첫 번째 앵커 포인트는 정확히 이 레벨에 있어야 하며 앵커 시간은 (고려 중인 패턴에 따라) 극단적인 고점 또는 저점의 시간과 정확히 일치하는 것이 좋습니다. 다음이 사진에서 보이는 모양입니다:
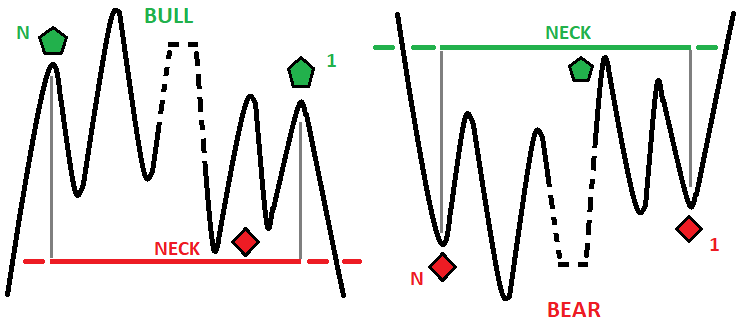
저가 또는 고가를 검색하는 창은 정확히 첫 번째와 마지막 상단 사이에 있습니다. 이 규칙은 이 제품군의 모든 패턴, 상하의 개수에 상관없이 유효합니다.
낙관적인 목표를 결정하려면 우리는 먼저 패턴 크기를 정의해야 합니다. 패턴 크기는 머리에서 목까지의 수직의 거리를 포인트 단위로 표시합니다. 거리를 결정하려면 먼저 목에서 가장 먼 상단을 찾아야 합니다. 이 상단이 패턴의 테두리가 됩니다:
void ExtremumsPatternFamilySearcher::SearchFarestTop()// define the farthest top
   {
   double MaxTranslation;// temporary variable to determine the highest top
   if ( FormationDirection == 1 )// if we deal with a multiple top
      {
      MaxTranslation=TopsUp[0].Price-Neck.Price0;// temporary variable to determine the highest top
      FarestTop=TopsUp[0];
      for(int i=1;i<ArraySize(TopsUp);i++)
         {
         if ( TopsUp[i].Price-Neck.Price0 > MaxTranslation )
            {
            MaxTranslation=TopsUp[i].Price-Neck.Price0;
            FarestTop=TopsUp[i];
            }
         }
      }
   if ( FormationDirection == -1 )// if we deal with a multiple bottom
      {
      MaxTranslation=Neck.Price0-TopsDown[0].Price;// temporary variable to determine the lowest bottom
      FarestTop=TopsDown[0];
      for(int i=1;i<ArraySize(TopsDown);i++)
         {
         if ( Neck.Price0-TopsDown[i].Price > MaxTranslation )
            {
            MaxTranslation=Neck.Price0-TopsDown[0].Price;
            FarestTop=TopsDown[i];
            }
         }
      }
   }
상단이 너무 많이 다르지 않은지 확인하려면 추가적인 확인 작업이 필요합니다. 확인에 성공한 경우에만 다음 단계로 진행할 수 있습니다. 보다 정확하게는 극값의 수직 크기와 수평(시간) 두 가지를 확인해야 합니다. 상단이 너무 멀리 떨어져 있으면 이러한 변형도 적합하지 않습니다. 수직의 크기를 확인하는 방법은 다음과 같습니다:
bool ExtremumsPatternFamilySearcher::bBalancedExtremums()// balance the tops
   {
   double Lowest;// the lowest top for the multiple top
   double Highest;// the highest bottom for the multiple bottom
   double AbsMin;// distance from the neck to the nearest top
   if ( FormationDirection == 1 )// for the multiple top
      {
      Lowest=TopsUp[0].Price;
      for(int i=1;i<ArraySize(TopsUp);i++)// find the lowest top
         {
         if ( TopsUp[i].Price < Lowest ) Lowest=TopsUp[i].Price;
         }
      AbsMin=Lowest-Neck.Price0;// determine distance from the lowest top to the neck
      if ( AbsMin == 0.0 ) return false;
      if ( ((FarestTop.Price - Neck.Price0)-AbsMin)/AbsMin >= RelativeUnstabilityM ) return false;// if the head is too much bigger than the lowest leverage
      }
   else if ( FormationDirection == -1 )// for the multiple bottom
      {
      Highest=TopsDown[0].Price;
      for(int i=1;i<ArraySize(TopsDown);i++)// find the highest top
         {
         if ( TopsDown[i].Price > Highest ) Highest=TopsDown[i].Price;
         }
      AbsMin=Neck.Price0-Highest;// determine distance from the highest top to the neck
      if ( AbsMin == 0.0 ) return false;
      if ( ((Neck.Price0-FarestTop.Price)-AbsMin)/AbsMin >= RelativeUnstabilityM ) return false;// if the head is too much bigger than the lowest leverage
      }
   else return false;
   return true;
   }
상단의 올바른 수직의 크기를 결정하려면 두 개의 상단이 필요합니다. 첫 번째는 목에서 가장 먼 곳, 두 번째는 가장 가까운 곳입니다. 이러한 크기가 크게 다르면 이 구성이 유효하지 않은 것으로 판명될 수 있습니다. 위험을 감수하면서 유효하지 않은 것으로 표시하지 않는 것이 좋습니다. 이전 술어와 마찬가지로 이 모든 것에는 무엇이 옳고 그른지에 대한 적절한 그래픽이 따라올 수 있습니다:
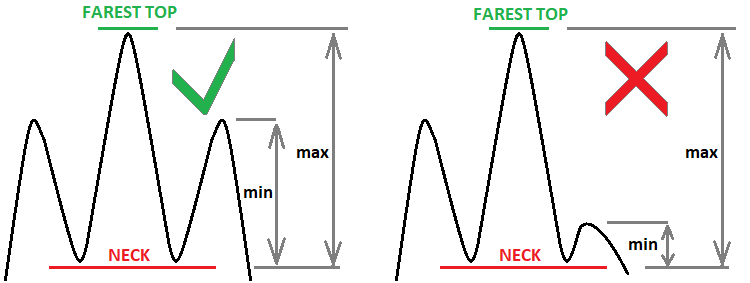
시각적으로 판단하기는 쉽지만 코드에는 정량적 지표가 필요합니다. 이 경우 다음과 같이 간단합니다:
- K = (Max - Min)/Min
- K <= RelativeUnstabilityM
이 메트릭은 상당히 많은 수의 잘못된 패턴을 걸러내는 데 매우 효율적입니다. 아무리 정교한 코드라도 우리의 눈보다 더 효율적일 수는 없습니다. 우리가 할 수 있는 유일한 일은 논리를 최대한 현실에 가깝게 만드는 것인데 우리는 여기서 멈춰야 할 지점을 알아야 합니다.
수평 확인은 비슷하게 보일 것입니다. 유일한 차이점은 바 인덱스를 크기로 사용한다는 점입니다(시간을 사용할 수 있지만 근본적인 차이는 없습니다):
bool ExtremumsPatternFamilySearcher::bBalancedExtremumsTime()// balance the sizes of shoulders and head along the horizontal axis
   {
   double Lowest;// minimum distance between the tops
   double Highest;// maximum distance between the tops
   if ( FormationDirection == 1 )// for the multiple top
      {
      Lowest=TopsUp[1].IndexExtremum-TopsUp[0].IndexExtremum;
      Highest=TopsUp[1].IndexExtremum-TopsUp[0].IndexExtremum;
      for(int i=1;i<ArraySize(TopsUp)-1;i++)// find the lowest top
         {
         if ( TopsUp[i+1].IndexExtremum-TopsUp[i].IndexExtremum < Lowest ) Lowest=TopsUp[i+1].IndexExtremum-TopsUp[i].IndexExtremum;
         if ( TopsUp[i+1].IndexExtremum-TopsUp[i].IndexExtremum > Highest ) Highest=TopsUp[i+1].IndexExtremum-TopsUp[i].IndexExtremum;
         }
      if ( double(Highest-Lowest)/double(Lowest) > RelativeUnstabilityTimeM ) return false;// if the width of one of the waves differs much
      }
   else if ( FormationDirection == -1 )// for the multiple bottom
      {
      Lowest=TopsDown[1].IndexExtremum-TopsDown[0].IndexExtremum;
      Highest=TopsDown[1].IndexExtremum-TopsDown[0].IndexExtremum;
      for(int i=1;i<ArraySize(TopsDown)-1;i++)// find the lowest top
         {
         if ( TopsDown[i+1].IndexExtremum-TopsDown[i].IndexExtremum < Lowest ) Lowest=TopsDown[i+1].IndexExtremum-TopsDown[i].IndexExtremum;
         if ( TopsDown[i+1].IndexExtremum-TopsDown[i].IndexExtremum > Highest ) Highest=TopsDown[i+1].IndexExtremum-TopsDown[i].IndexExtremum;
         }
      if ( double(Highest-Lowest)/double(Lowest) > RelativeUnstabilityTimeM ) return false;// if the width of one of the waves differs much
      }
   else return false;
   return true;
   }
이 확인을 위해 우리는 유사한 메트릭을 사용할 수 있습니다. 이는 시각적으로 다음과 같이 표현될 수 있습니다:
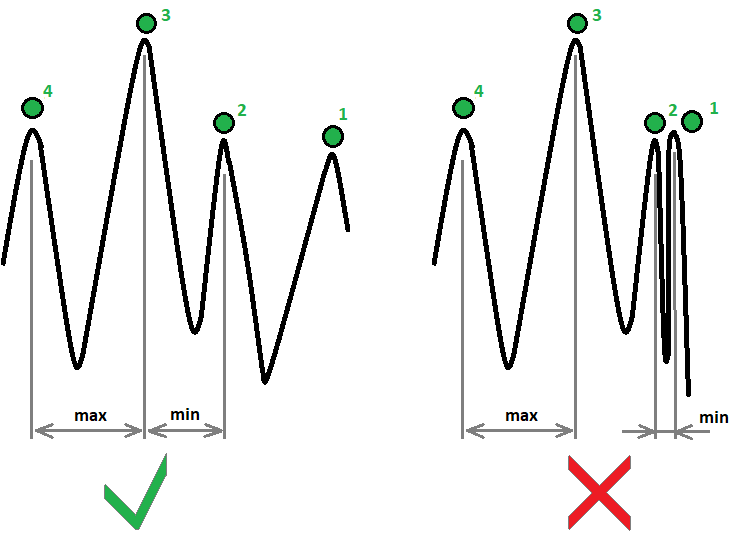
이 경우 정량적 기준은 동일합니다. 하지만 이번에는 포인트 대신 인덱스나 시간을 사용합니다. 비교 대상인 숫자를 별도로 구현하여 유연하게 조정할 수 있는 여지를 두는 것이 더 나을 수 있습니다:
- K = (Max - Min)/Min
- K <= RelativeUnstabilityTimeM
목 라인이 왼쪽의 가격을 교차해야 하며 이는 패턴이 추세에 선행했다는 것을 의미합니다:
bool ExtremumsPatternFamilySearcher::CorrectNeckUpLeft()// next the neck line must be corrected so that it finds an intersection with the price on the left
   {
   bool bCrossNeck=false;// indicates if the neck was crossed
   if ( Neck.DirectionOfFormation )// if the neck is found for a double top
      {
      for(int i=StartTop.Index1;i<BarsM;i++)// define the intersection point
         {
         if ( High[i] >= FarestTop.Price )// if the movement goes beyond the formation, then the formation is fake
            {
            return false;
            }
         if ( Close[i] < Neck.Price0 && Open[i] < Neck.Price0 && High[i] < Neck.Price0 && Low[i] < Neck.Price0   )
            {
            Neck.Time1=Time[i];
            Neck.Index1=i;
            return true;
            }
         }
      }
   return false;
   }

bool ExtremumsPatternFamilySearcher::CorrectNeckDownLeft()// next the neck line must be corrected so that it finds an intersection with the price on the left
   {
   bool bCrossNeck=false;// indicates if the neck was crossed
   if ( !Neck.DirectionOfFormation )// if the neck is found for a double bottom
      {
      for(int i=StartTop.Index1;i<BarsM;i++)// define the intersection point
         {
         if ( Low[i] <= FarestTop.Price )//  if the movement goes beyond the formation, then the formation is fake
            {
            return false;
            }
         if ( Close[i] > Neck.Price0 && Open[i] > Neck.Price0 && High[i] > Neck.Price0 && Low[i] > Neck.Price0 )
            {
            Neck.Time1=Time[i];
            Neck.Index1=i;
            return true;
            }
         }
      }
   return false;
   }
다시 말하지만 강세와 약세 패턴에는 두 가지 미러 함수들이 있습니다. 아래는 이 술어와 다음 술어를 그래픽으로 나타낸 그림입니다:

파란색 상자는 교차를 제어하는 시장 세그먼트를 표시합니다. 두 세그먼트는 패턴 뒤 극단적인 상단의 왼쪽과 오른쪽에 있습니다.
두 개의 확인만 남았습니다:
- 현재 시점(제로 바)에서 목 라인을 교차하는 패턴이 필요합니다.
- 패턴 앞에는 패턴 자체보다 크거나 같은 움직임이 있어야 합니다.
첫 번째 포인트는 알고리즘 트레이딩에 필요합니다. 이 함수도 제공되지만 포메이션을 보기 위해서만 포메이션을 감지할 필요는 없다고 생각합니다. 진입 시점에 있다는 것을 알고 즉시 포지션을 개시할 수 있는 정확한 시점을 찾아내야 합니다. 두 번째 요점은 패턴 자체가 좋은 선행 동작 없이는 쓸모가 없기 때문에 필요한 조건 중 하나입니다.
제로 바 크로스(오른쪽 교차점 확인)는 다음과 같이 결정됩니다:
int ExtremumsPatternFamilySearcher::CorrectNeckUpRight()// next the neck line must be corrected so that it finds an intersection with the price on the right
   bool bCrossNeck=false;// indicates if the neck was crossed
   if ( Neck.DirectionOfFormation )// if the neck is found for a double top
      {
      for(int i=EndTop.IndexExtremum;i>1;i--)// define the intersection point
         {
         if ( High[i] > FarestTop.Price || Low[i] < Neck.Price0 )// if the movement goes beyond the formation, then the formation is fake
            {
            return -1;
            }
         }
      }

   if ( Close[0] <= Neck.Price0 )
      {
      Neck.Time0=Time[0];
      return 1;
      }
   return 0;
   }

int ExtremumsPatternFamilySearcher::CorrectNeckDownRight()// next the neck line must be corrected so that it finds an intersection with the price on the right
   {
   bool bCrossNeck=false;// indicates if the neck was crossed
   if ( !Neck.DirectionOfFormation )// if the neck is found for a double bottom
      {
      for(int i=EndTop.IndexExtremum;i>1;i--)// define the intersection point
         {
         if ( Low[i] < FarestTop.Price || High[i] > Neck.Price0  )// if the movement goes beyond the formation, then the formation is fake
            {
            return -1;
            }
         }
      }

   if ( Close[0] >= Neck.Price0 )
      {
      Neck.Time0=Time[0];
      return 1;
      }

   return 0;
   }
<
다시 말하지만 두 가지 미러 함수들이 있습니다. 오른쪽의 교차점은 가격이 패턴을 넘어섰다가 다시 돌아온 경우 유효하지 않은 것으로 간주됩니다. - 이 움직임인 이전 그림에서 설명한 대로 여기서는 다루지 않습니다.
이제 앞의 추세를 찾는 방법을 알아봅시다. 지금까지는 저는 이를 위해 낙관적인 예측 라인을 사용하고 있습니다. 목과 낙관적 예측의 선 사이에 시장 세그먼트가 있으면 이것이 원하는 움직임입니다. 이 움직임은 시간이 너무 길어서는 안 됩니다. 그렇지 않으면 움직임이 아닌 것이 분명합니다:
bool ExtremumsPatternFamilySearcher::bWasTrend()// did we find the movement preceding the formation (also move here the anchor point to the intersection)
   {
   bool bCrossOptimist=false;// denotes if the neck is crossed
   if ( FormationDirection == 1 )// if the optimistic forecast is at the double top
      {
      for(int i=Neck.Index1;i<BarsM;i++)// define the intersection point
         {
         if ( High[i] > Neck.Price0 )// if the movement goes beyond the neck, then the formation is fake
            {
            return false;
            }
         if ( Low[i] < OptimistLine.Price0 )
            {
            OptimistLine.Time1=Time[i];
            return true;
            }
         }
      }
   else if ( FormationDirection == -1 )// if the optimistic forecast is at the double bottom
      {
      for(int i=Neck.Index1;i<BarsM;i++)// define the intersection point
         {
         if ( Low[i] < Neck.Price0 )//  if the movement goes beyond the neck, then the formation is fake
            {
            return false;
            }
         if ( High[i] > OptimistLine.Price0 )
            {
            OptimistLine.Time1=Time[i];
            return true;
            }
         }
      }
   return false;
   }
마지막 술어는 다음과 같이 그래픽으로 표현될 수도 있습니다:
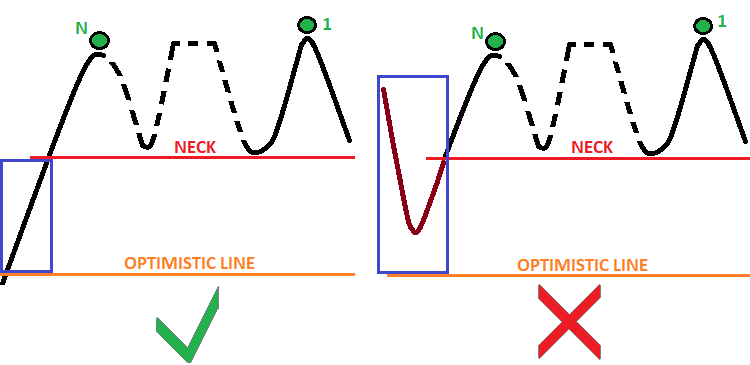
여기서 코드 검토를 마치고 시각적 평가로 넘어가겠습니다. 이 글에서 이 방법의 주요 아이디어는 충분히 설명했다고 생각합니다. 이 시리즈의 다음 글에서 더 많은 아이디어를 살펴볼 것입니다.
MetaTrader 5 비주얼 테스터에서 결과를 확인해 보겠습니다:
저는 차트에 항상 선 그리기를 사용하는데 빠르고 간단하며 명확하기 때문입니다. MQL5 도움말에서는 선을 포함한 모든 그래픽 객체를 사용하는 예제를 제공합니다. 여기서는 제가 드로잉 코드를 제공하지 않지만 실행 결과를 확인할 수 있습니다. 물론 모든 것이 더 개선될 수 있지만 아직은 프로토타입일 뿐입니다. 따라서 여기서 저는 '필요성과 충분성'이라는 원칙을 적용할 수 있다고 생각합니다:
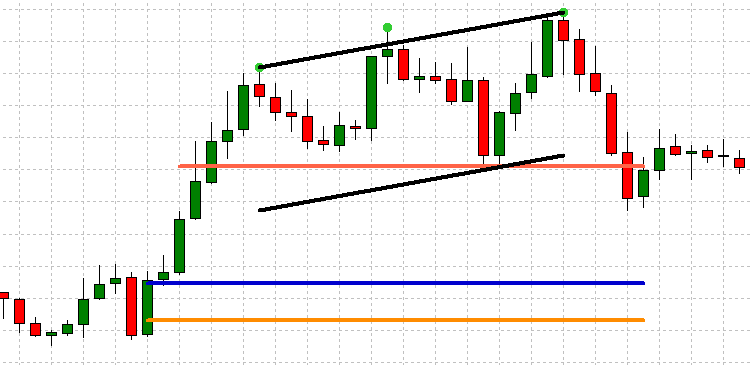
다음은 트리플 탑의 예입니다. 저는 이 예가 더 흥미로워 보였습니다. 더블 탑도 비슷한 방식으로 감지되며 매개변수에서 원하는 탑의 개수만 설정하면 됩니다. 코드는 이러한 형식을 자주 찾지 못하지만 이는 데모일 뿐입니다. 이 코드는 더 세분화될 수 있습니다(이 작업은 나중에 할 계획입니다).
추가적으로 개발할 만한 아이디어
나중에 이 글에서 언급되지 않은 내용을 고려하여 모든 포메이션에 대한 검색 품질을 개선할 예정입니다. 또한 헤드앤 숄더 포메이션을 감지할 수 있도록 클래스를 개선할 예정입니다. 또한 이러한 포메이션의 가능한 하이브리드적인 함수들을 찾으려고 노력할 것이며 그 중 하나는 "N 탑과 다중 숄더"일 수 있습니다. 이 시리즈는 이 패턴 제품군에만 국한되지 않으며 새롭고 흥미롭고 유용한 자료를 포함할 예정입니다. 패턴 검색에는 다양한 접근 방식이 있으며 이 시리즈의 아이디어는 다양한 예제를 사용하여 가능한 한 많은 패턴을 보여줌으로써 복잡한 작업을 일련의 간단한 작업으로 분해하는 여러 가지 가능한 방법을 다루는 것입니다. 시리즈에는 다음이 포함될 것입니다.
- 기타 흥미로운 패턴
- 다양한 포메이션 유형을 감지하는 다른 방법
- 과거 데이터를 이용한 트레이딩 및 다양한 상품과 차트주기에 대한 통계 수집
- 시장에는 많은 패턴이 있고 제가 모든 패턴을 다 알지는 못합니다(따라서 잠재적으로 여러분의 패턴을 고려할 수 있습니다).
- 레벨도 고려할 것입니다(레벨은 종종 반전을 감지하는 데 사용됩니다).
결론
저는 누구나 쉽게 이해할 수 있도록 자료를 단순하고 이해하기 쉽게 만들려고 노력했습니다. 누구나 여기서 유용한 정보를 찾을 수 있기를 바랍니다. 이 글의 결론은 시각적 전략 테스터에서 볼 수 있듯이 간단한 코드로 복잡한 포메이션을 찾을 수 있다는 것입니다. 따라서 반드시 신경망을 사용하거나 복잡한 머신 비전 알고리즘을 작성/사용할 필요는 없습니다. MQL5 언어에는 가장 복잡한 알고리즘도 구현할 수 있는 풍부한 기능들이 있습니다. 가능성은 여러분의 상상력과 부지런함에 따른 것입니다.
MetaQuotes 소프트웨어 사를 통해 러시아어가 번역됨.
원본 기고글: https://www.mql5.com/ru/articles/9394
경고: 이 자료들에 대한 모든 권한은 MetaQuotes(MetaQuotes Ltd.)에 있습니다. 이 자료들의 전부 또는 일부에 대한 복제 및 재출력은 금지됩니다.
이 글은 사이트 사용자가 작성했으며 개인의 견해를 반영합니다. Metaquotes Ltd는 제시된 정보의 정확성 또는 설명 된 솔루션, 전략 또는 권장 사항의 사용으로 인한 결과에 대해 책임을 지지 않습니다.
 스왑(1부): 잠금 및 합성 포지션
너무 헷갈려서 코드가 적고 설명이 더 많았으면 좋겠어요. 코드를 이해하는 것은 문제를 이해하면 쉽게 작성할 수 있습니다. 그러니 코드보다 문제에 대한 설명이 더 많습니다.
새 문서 예제가 있는 패턴(1부): 멀티플 탑이 게시되었습니다:
작성자: Evgeniy Ilin
놀라운 기사, 나는 프랙탈을 사용하지 않고 내 자신의 논리를 공식화하려고 노력해 왔습니다. 그리고 당신은 모든 것을 정리하는 데 많은 도움을주었습니다.
안녕하세요 Evgeniy,
이것은 큰 기여입니다. 감사합니다.
하지만 MT4 버전의 차트에 지표를 첨부할 수 없습니다.
로드되지 않습니다.
이유를 아십니까?