Squeezer MT5
- インディケータ
- バージョン: 1.1
- アップデート済み: 8 11月 2022
- アクティベーション: 5

Squeezer — Sniper Entries on Pullbacks
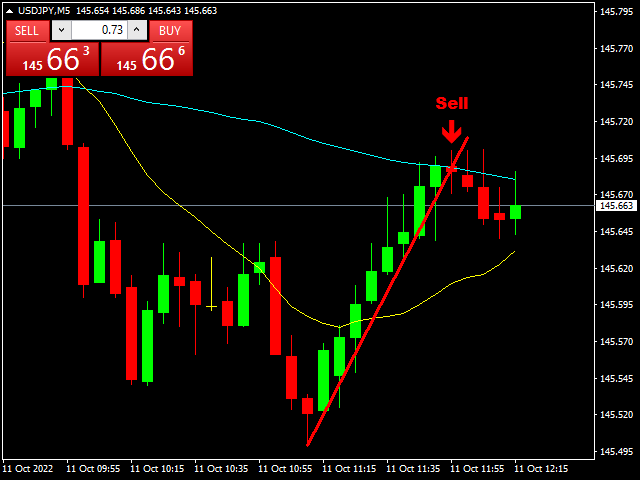
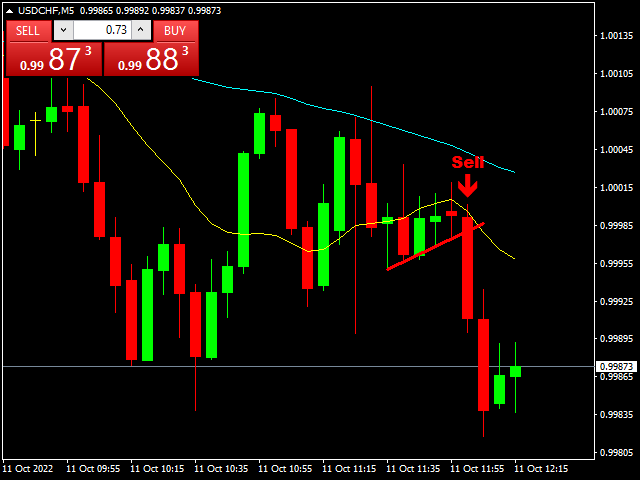
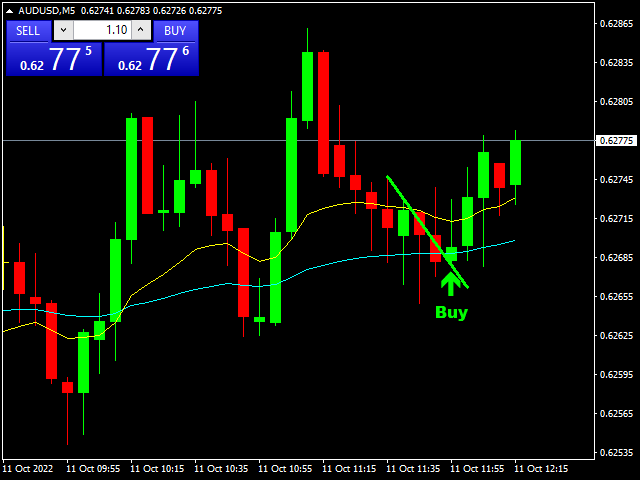
Squeezer is built to time pullback entries with precision. It draws ascending lines with a Sell signal in downtrends and descending lines with a Buy signal in uptrends — a simple, proven way to catch sniper entries in the direction of the trend.
What it does for you
- Pullback timing: Buy signals in uptrends, Sell signals in downtrends — trade with the trend, not against it.
- Clear visual guides: ascending/descending lines show where the pullback may turn.
- Sniper entries: aim for tight, high-quality entries instead of chasing price.
- Works everywhere: any symbol, any timeframe.
Who it is for: trend traders who want better timing on pullback entries.
Risk warning: trading involves substantial risk of loss. Always test on a demo account first and use risk settings you are comfortable with. Past performance does not guarantee future results.