Investment Castle Supply and Demand MT4
- インディケータ
-
Ahmed Alaaeldin Abdulrahman Ahmed Elherzawi
 Every day is a new opportunity. You can build on yesterday's success or put its failures behind and start over again. That's the way life is, with a new game every day, and that's the way baseball is.
 - バージョン: 1.3
- アップデート済み: 7 12月 2021
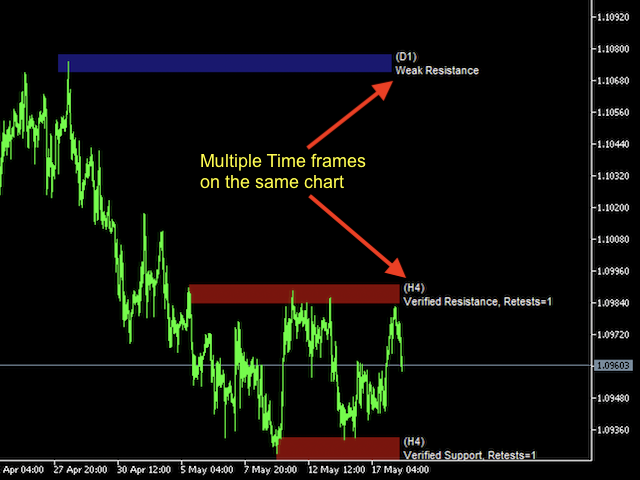
Investment Castle Supply & Demand — Zones That Don't Repaint
Price flows between supply and demand. This non-repainting indicator maps those zones for you by counting how many times each level has been tested and retested in the past, so you trade from the areas the market actually respects.
What it does for you
- Non-repainting zones: levels are based on real, historical tests and retests — they don't redraw on you.
- Trade from strength: see the supply and demand areas where price is most likely to react.
- A clear path for entries and exits: know where to look for your buy and sell trades.
- Works everywhere: any symbol, any timeframe.
Who it is for: traders who plan around supply and demand and want objective, stable zones.
Risk warning: trading involves substantial risk of loss. Always test on a demo account first and use risk settings you are comfortable with. Past performance does not guarantee future results.