Investment Castle Support and Resistance MT4
- インディケータ
- バージョン: 1.4
- アップデート済み: 7 8月 2021

Investment Castle サポート&レジスタンス — 自動の売買レベル
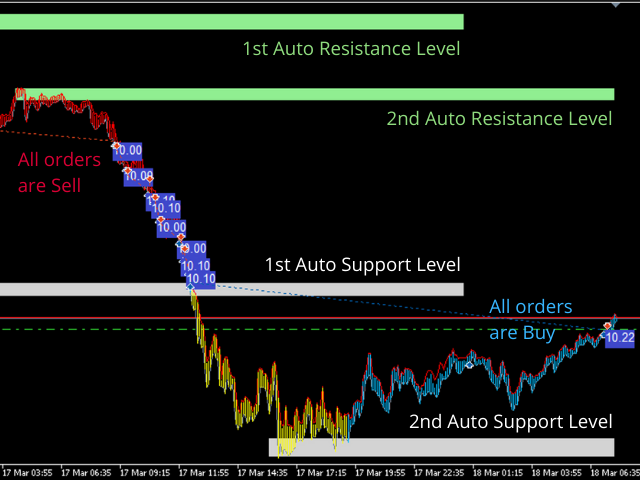
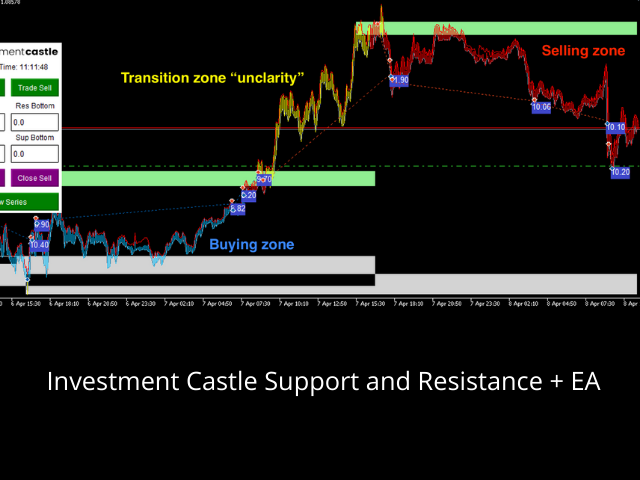
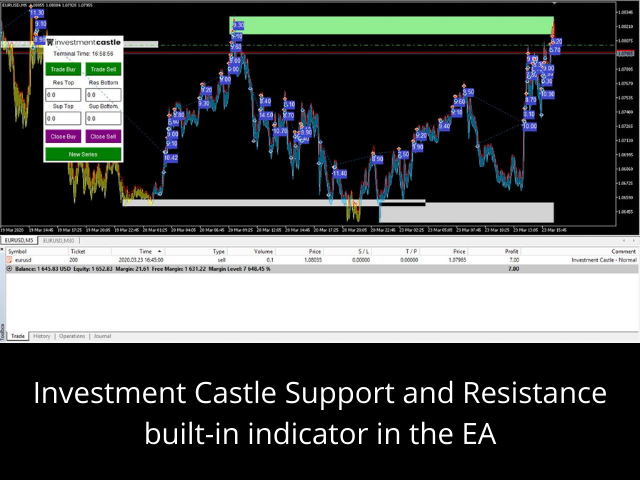
サポートとレジスタンスを手で引く必要はもうありません。このインジケーターは重要な買い・売りレベルを自動で描き、バイアスに応じてローソク足を色分けするので、相場がどちら側を好んでいるかがひと目で分かります。Investment Castle EA に内蔵されているサポート&レジスタンスのエンジンと同じものです。
このインジケーターができること
- 自動の売買レベル:サポートとレジスタンスを自動検出して描画。手動での描画は不要です。
- 色によるバイアス表示:ローソク足は買いで青、売りで赤になります(初期設定。入力で変更可)。
- より速い判断:価格が反応しやすい位置と優勢な方向が瞬時に分かります。
- システムの一部:Investment Castle EA のサポート&レジスタンスの核。心理的キーレベルと連携します。
- どこでも動作:あらゆる銘柄・あらゆる時間軸。
対象:手作業なしで、クリーンで客観的な S/R レベルが欲しいトレーダー。
リスク警告:取引には大きな損失リスクが伴います。必ずまずデモ口座でテストし、ご自身が許容できるリスク設定を使用してください。過去の成績は将来の結果を保証するものではありません。


Perfect work again !!! Big thanks