Investment Castle RSI Divergence

Investment Castle RSI Divergence — Catch the Turn Early
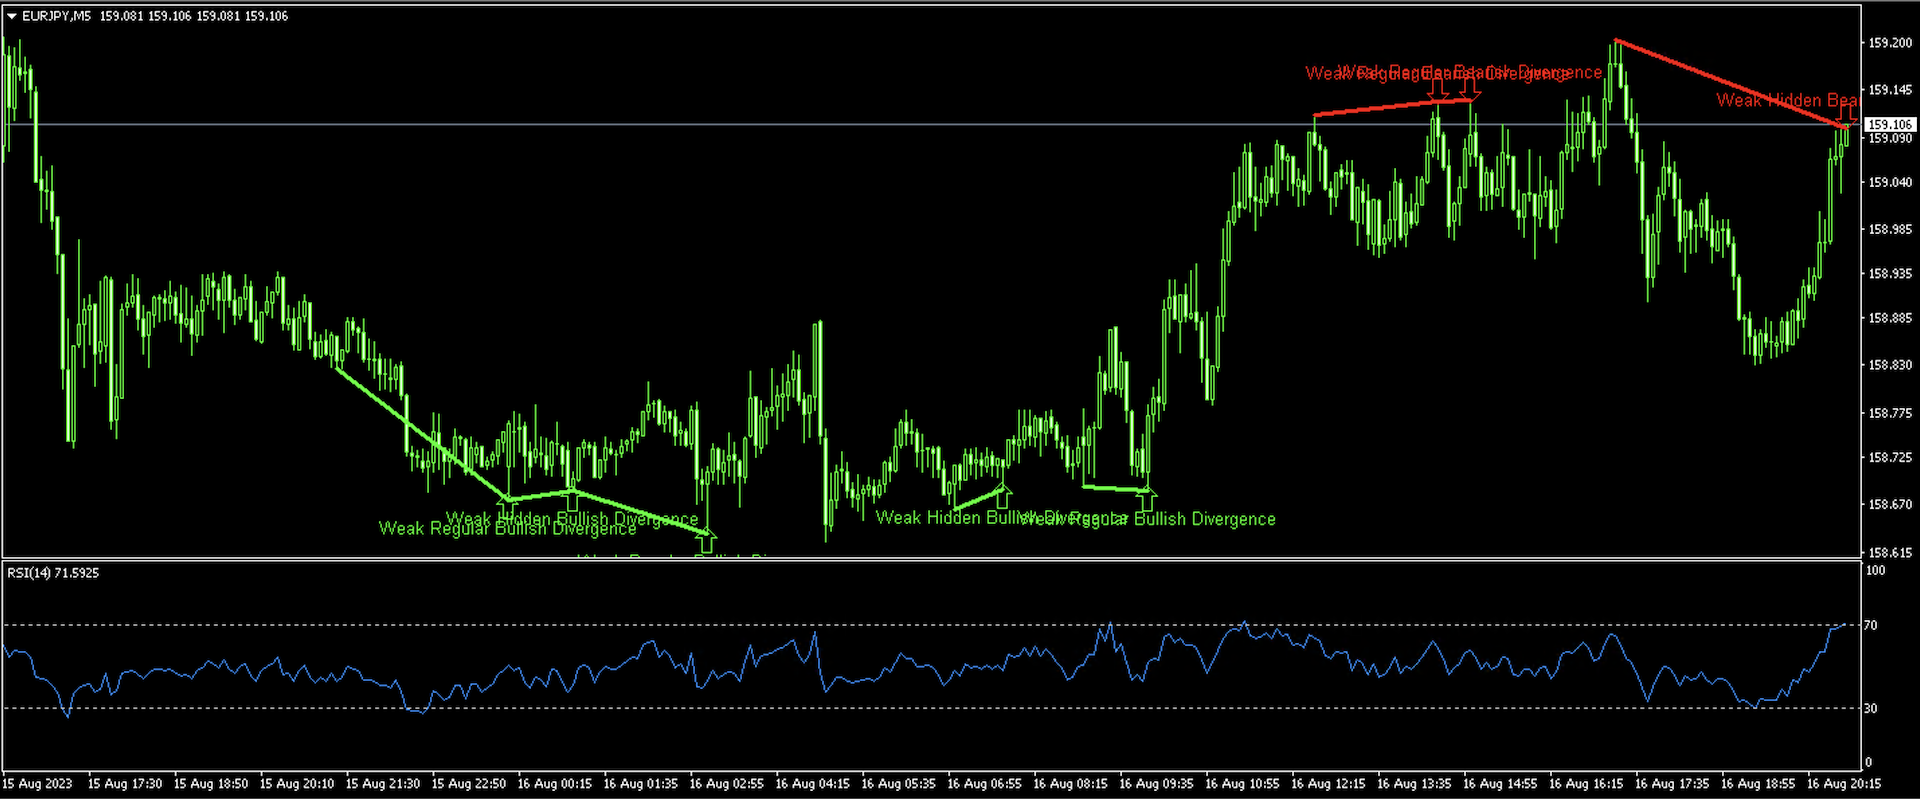
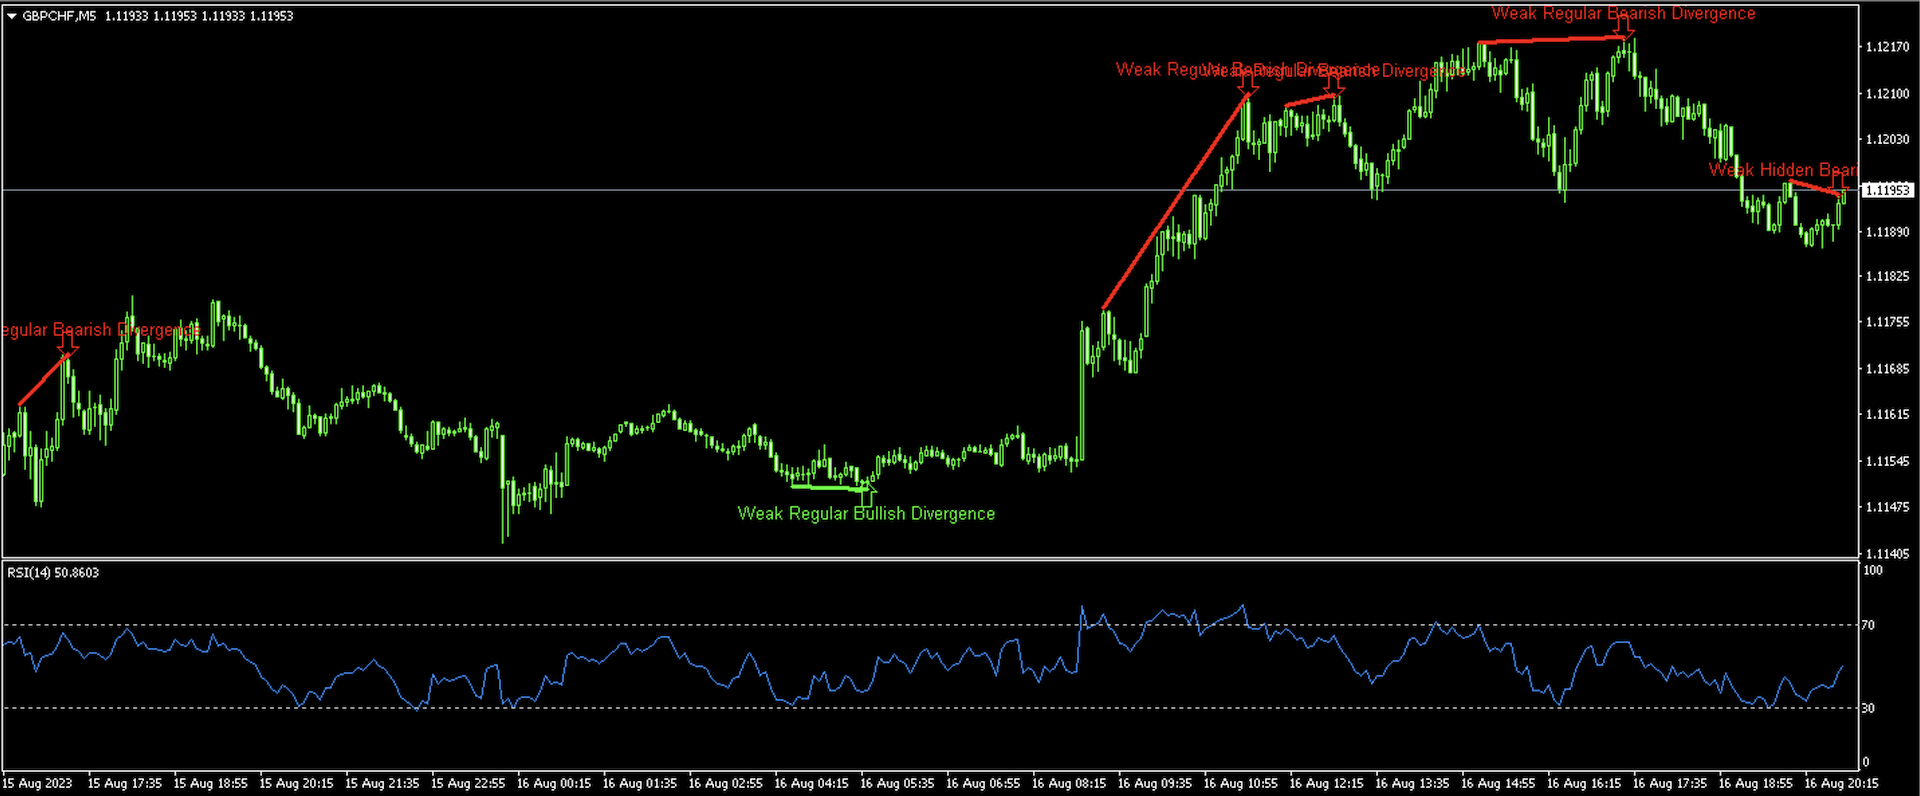
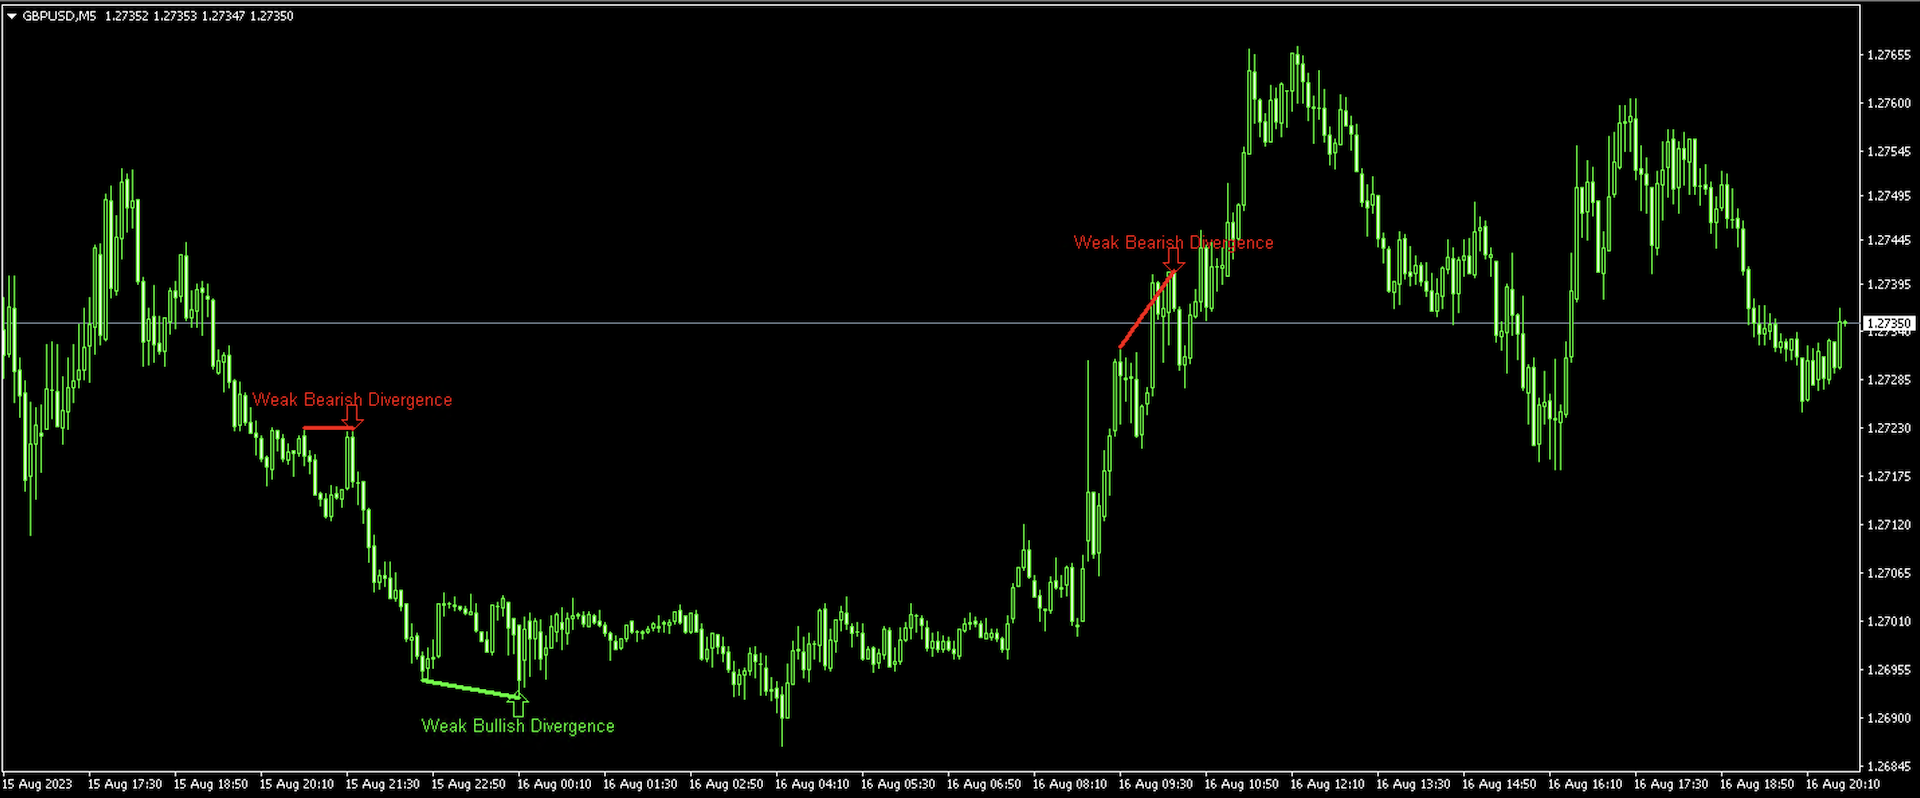
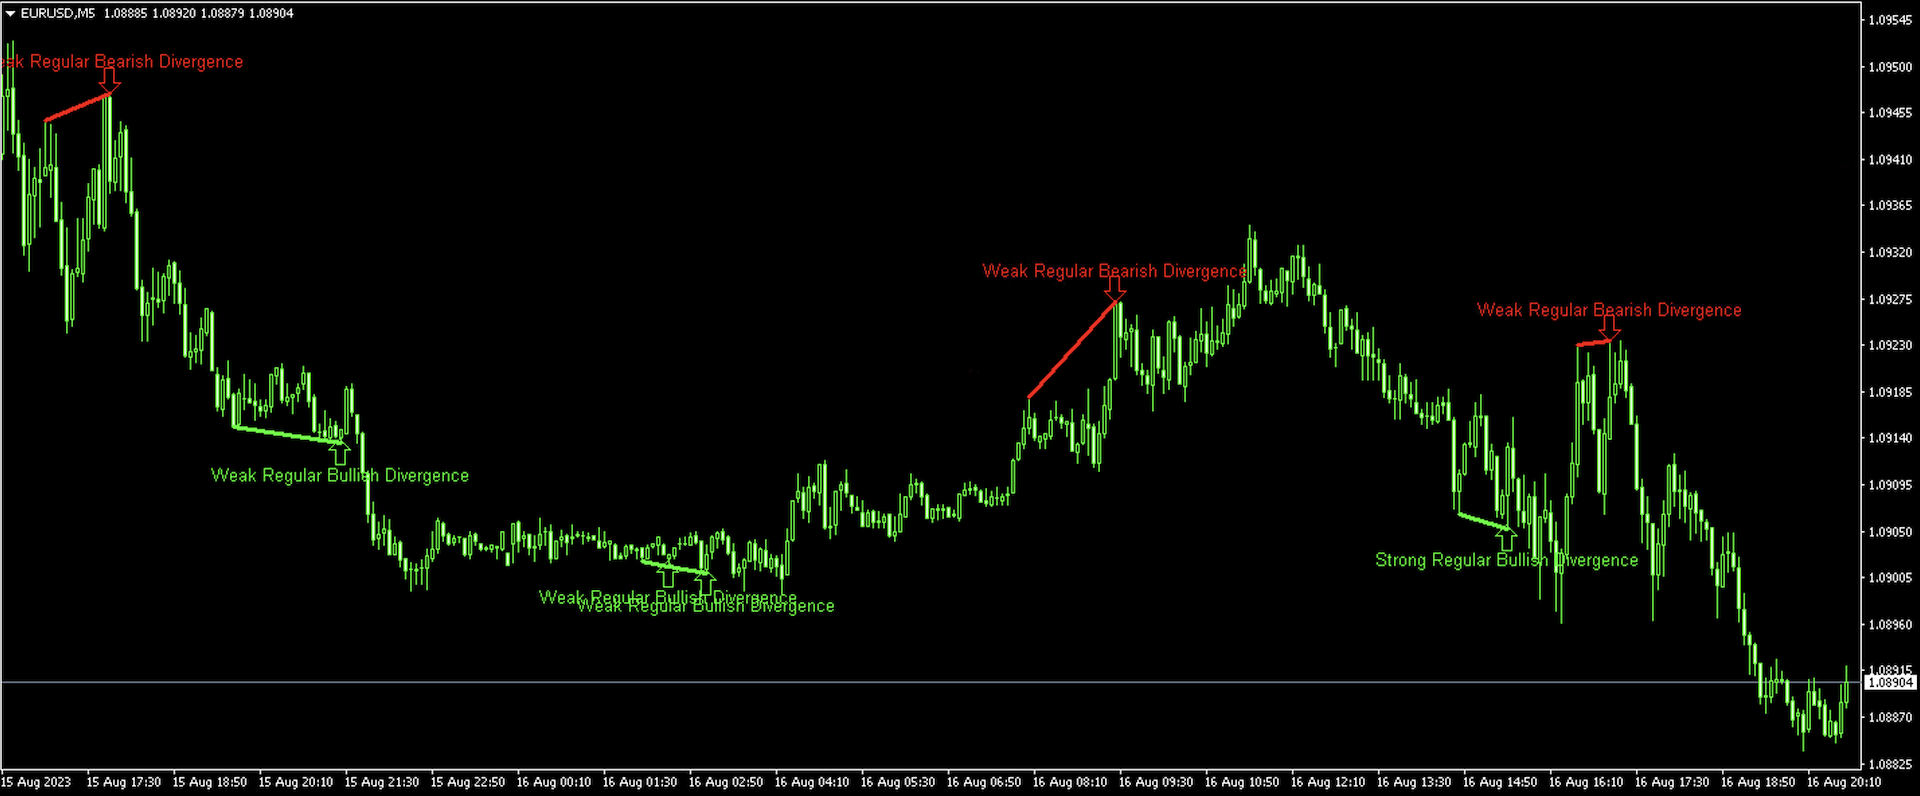
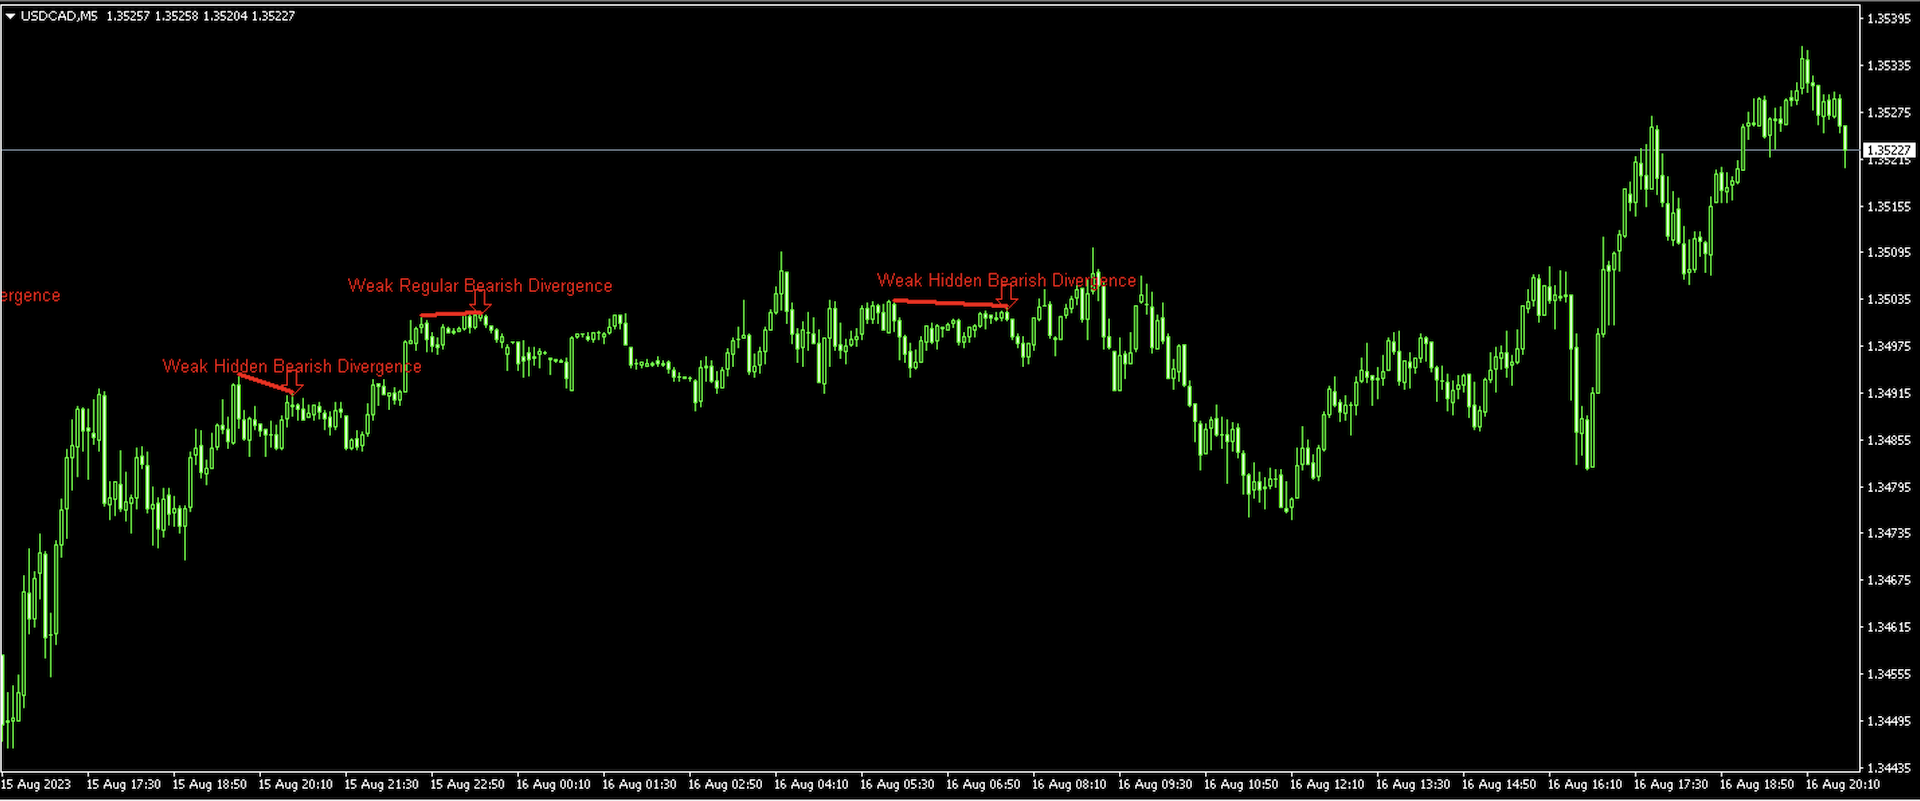
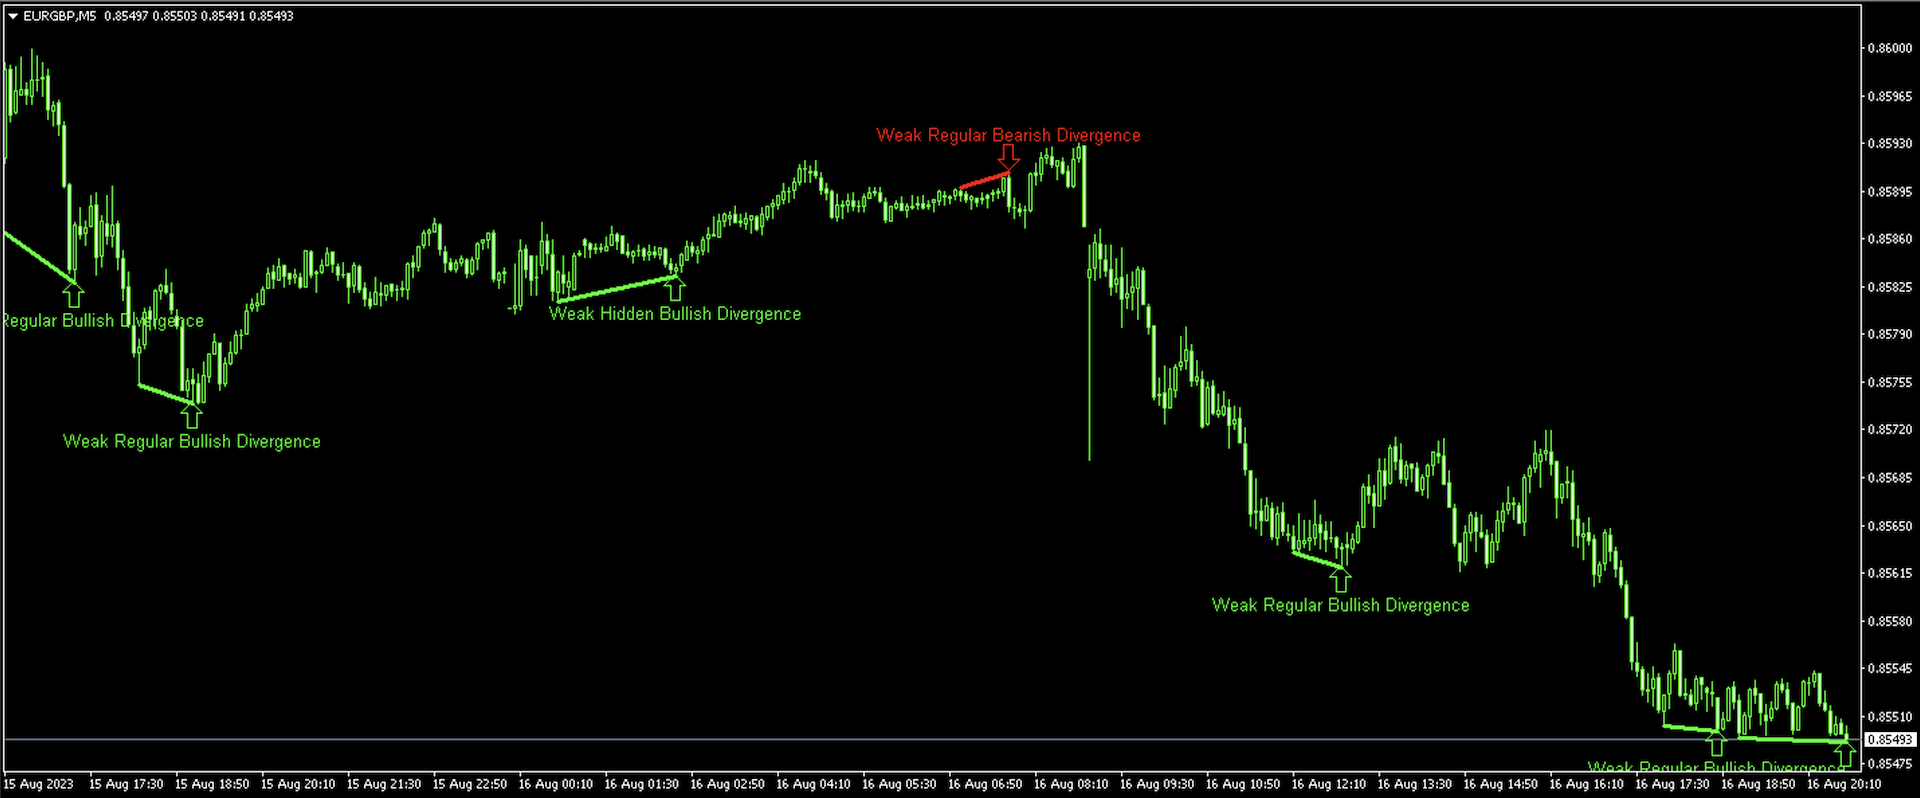
The RSI Divergence Indicator helps you spot potential reversals before they happen by detecting discrepancies between the RSI and price. Divergence is one of the most respected early signals of a trend change — from bullish to bearish or vice versa — now flagged for you automatically.
What it does for you
- Automatic divergence detection: bullish and bearish RSI/price divergences flagged on your chart.
- Earlier reads on reversals: see momentum shifts before price confirms them.
- Cleaner timing: no manual RSI comparison candle by candle.
- Works everywhere: any symbol, any timeframe.
Who it is for: traders who use momentum divergence to time entries and exits.
Risk warning: trading involves substantial risk of loss. Always test on a demo account first and use risk settings you are comfortable with. Past performance does not guarantee future results.
Very good Indicator. Just do not take the trades blindly. I pair it with Stochastics Divergence for Pair Trading and that makes it an almost complete system for winning trades.