Investment Castle Volatility Index
- インディケータ
- バージョン: 1.1
- アップデート済み: 12 6月 2021

Investment Castle ボラティリティ指数 — 相場のエネルギーを読む
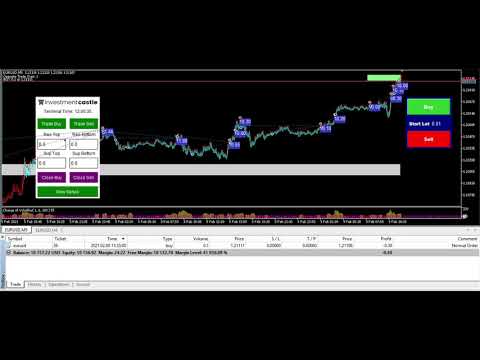
Investment Castle ボラティリティ指数は、現在の銘柄の出来高と相場のボラティリティを一つの分かりやすい値で表示します。Investment Castle EA が動的な距離設定や逆方向エントリーのタイミングに使うのと同じボラティリティエンジンです。
このインジケーターができること
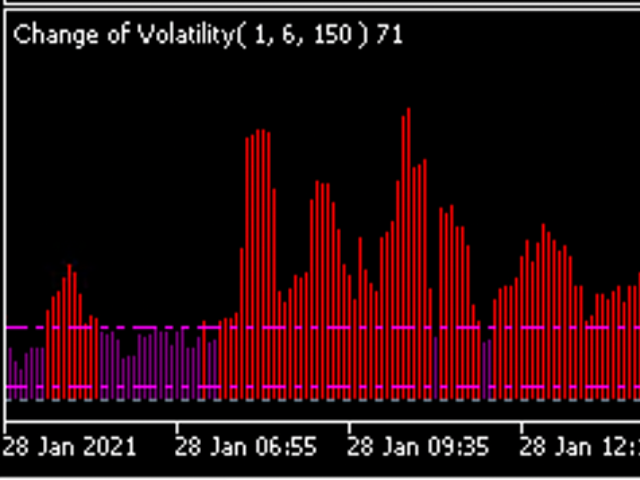
- 出来高とボラティリティをひと目で:現在の相場がどれだけ活発で変動的かが分かります。
- 動的距離の原動力:Investment Castle EA が適応的な間隔や逆方向エントリーに用いるのと同じ指数。
- 銘柄ごとに最適化可能:各銘柄向けにパラメーターを調整・最適化できます。
- どのチャートでも動作:あらゆる銘柄・あらゆる時間軸。
対象:実際の相場のボラティリティに基づいて建玉や間隔を決めるトレーダー。
リスク警告:取引には大きな損失リスクが伴います。必ずまずデモ口座でテストし、ご自身が許容できるリスク設定を使用してください。過去の成績は将来の結果を保証するものではありません。


Very good!