Chances MT4
- インディケータ
- バージョン: 1.1
- アップデート済み: 28 2月 2022

Investment Castle Chances — Clear Buy & Sell Signals
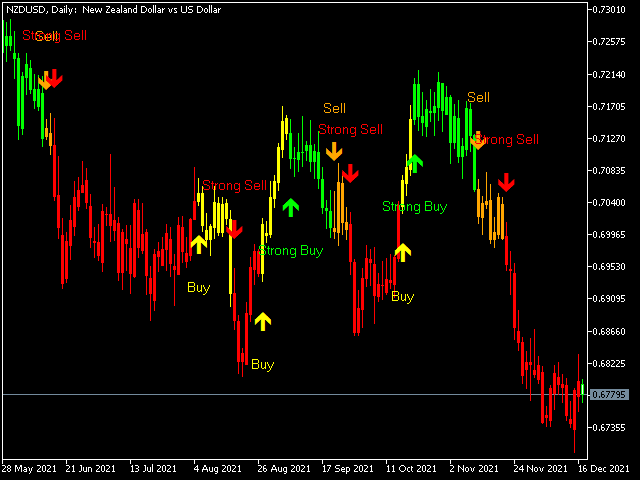
The Investment Castle Chances indicator marks buy and sell opportunities right on your chart, with two strengths of signal so you can weigh each setup at a glance.
What it does for you
- Two signal strengths: Buy / Sell on orange candles, and Strong Buy (green) / Strong Sell (red) for higher-conviction setups.
- On-chart and obvious: act when you see the signal — no scanning or second-guessing.
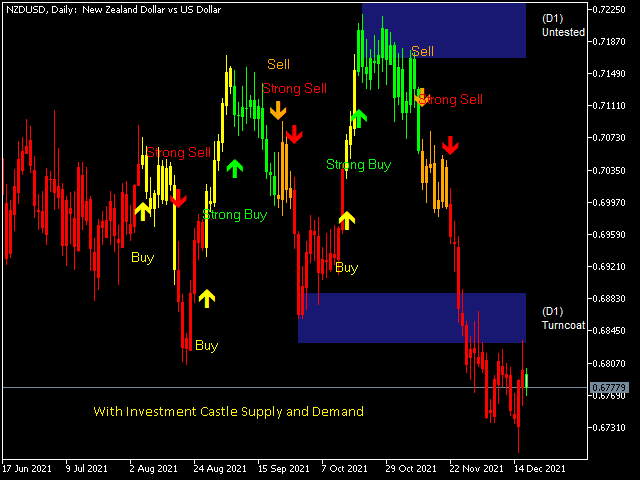
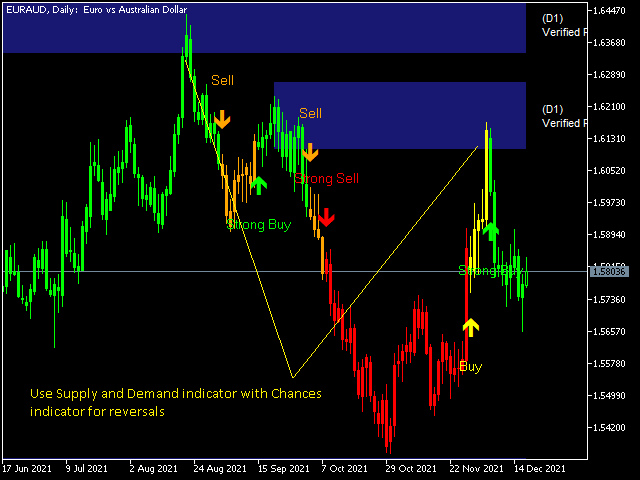
- Flexible: trade the signals directly, or use them to confirm your own analysis.
- Works everywhere: any symbol, any timeframe.
Who it is for: traders who want clear, colour-graded entries without staring at the screen all day.
Risk warning: trading involves substantial risk of loss. Always test on a demo account first and use risk settings you are comfortable with. Past performance does not guarantee future results.


Very Good Indicator