Investment Castle Engulfing MT4
- インディケータ
- バージョン: 1.2
- アップデート済み: 9 5月 2022

Investment Castle Engulfing — Never Miss an Engulfing Candle
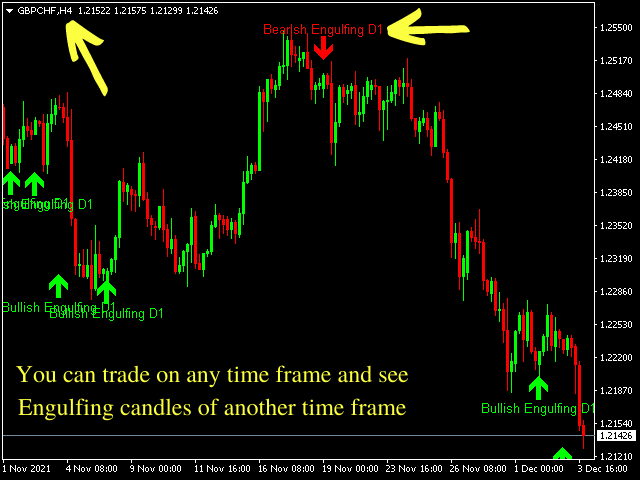
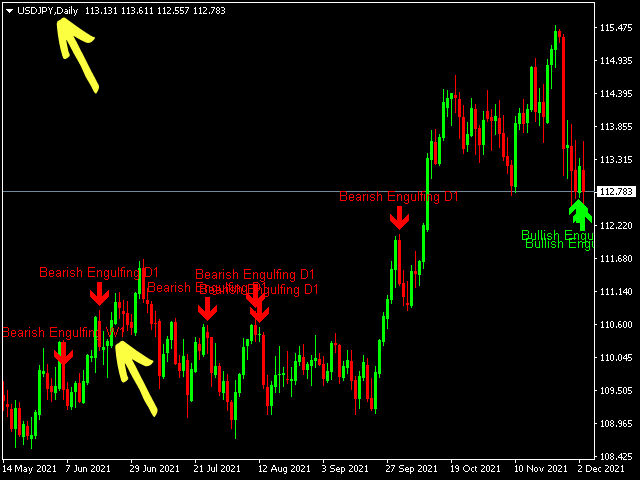
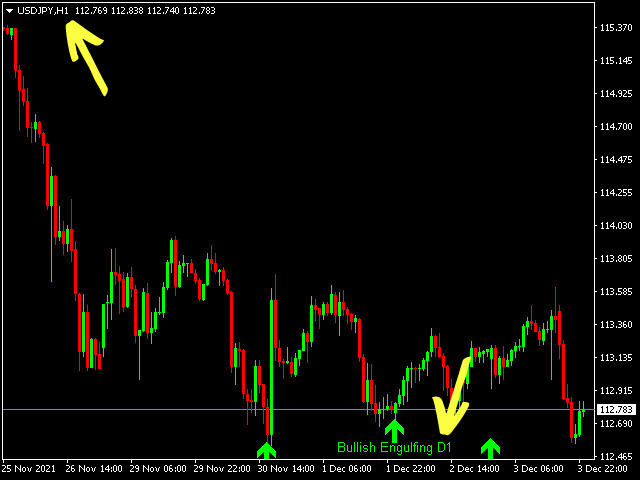
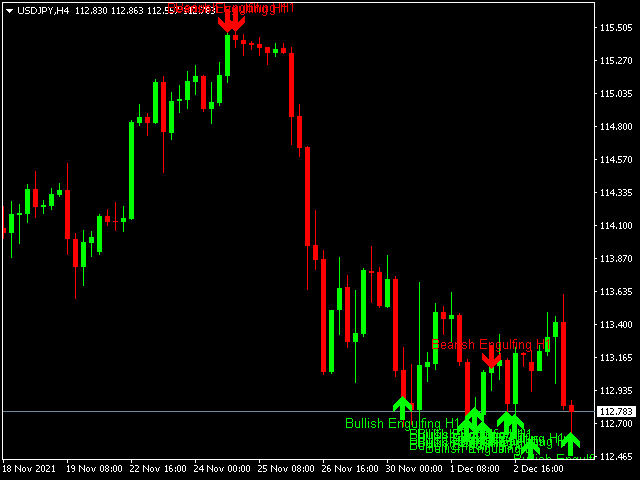
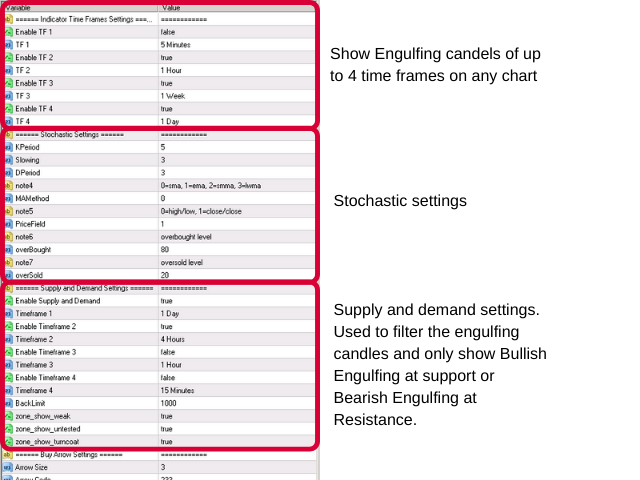
Whether you scalp or trade the daily, bullish and bearish engulfing candles are some of the most reliable signals — but spotting them across timeframes is tedious and easy to miss. This indicator finds them for you, including an engulfing candle forming on a higher timeframe while you trade a lower one.
What it does for you
- Automatic engulfing detection: bullish and bearish engulfing candles are flagged for you.
- Multi-timeframe aware: see an H4 engulfing while you trade the M15 — no switching charts.
- Less stress, fewer missed setups: let the indicator watch the candles for you.
- Works everywhere: any symbol, any timeframe.
Who it is for: price-action and candlestick traders who rely on engulfing patterns.
Risk warning: trading involves substantial risk of loss. Always test on a demo account first and use risk settings you are comfortable with. Past performance does not guarantee future results.