Thiago Duarte / プロファイル
- 情報
|
8+ 年
経験
|
47
製品
|
315
デモバージョン
|
|
8
ジョブ
|
0
シグナル
|
0
購読者
|
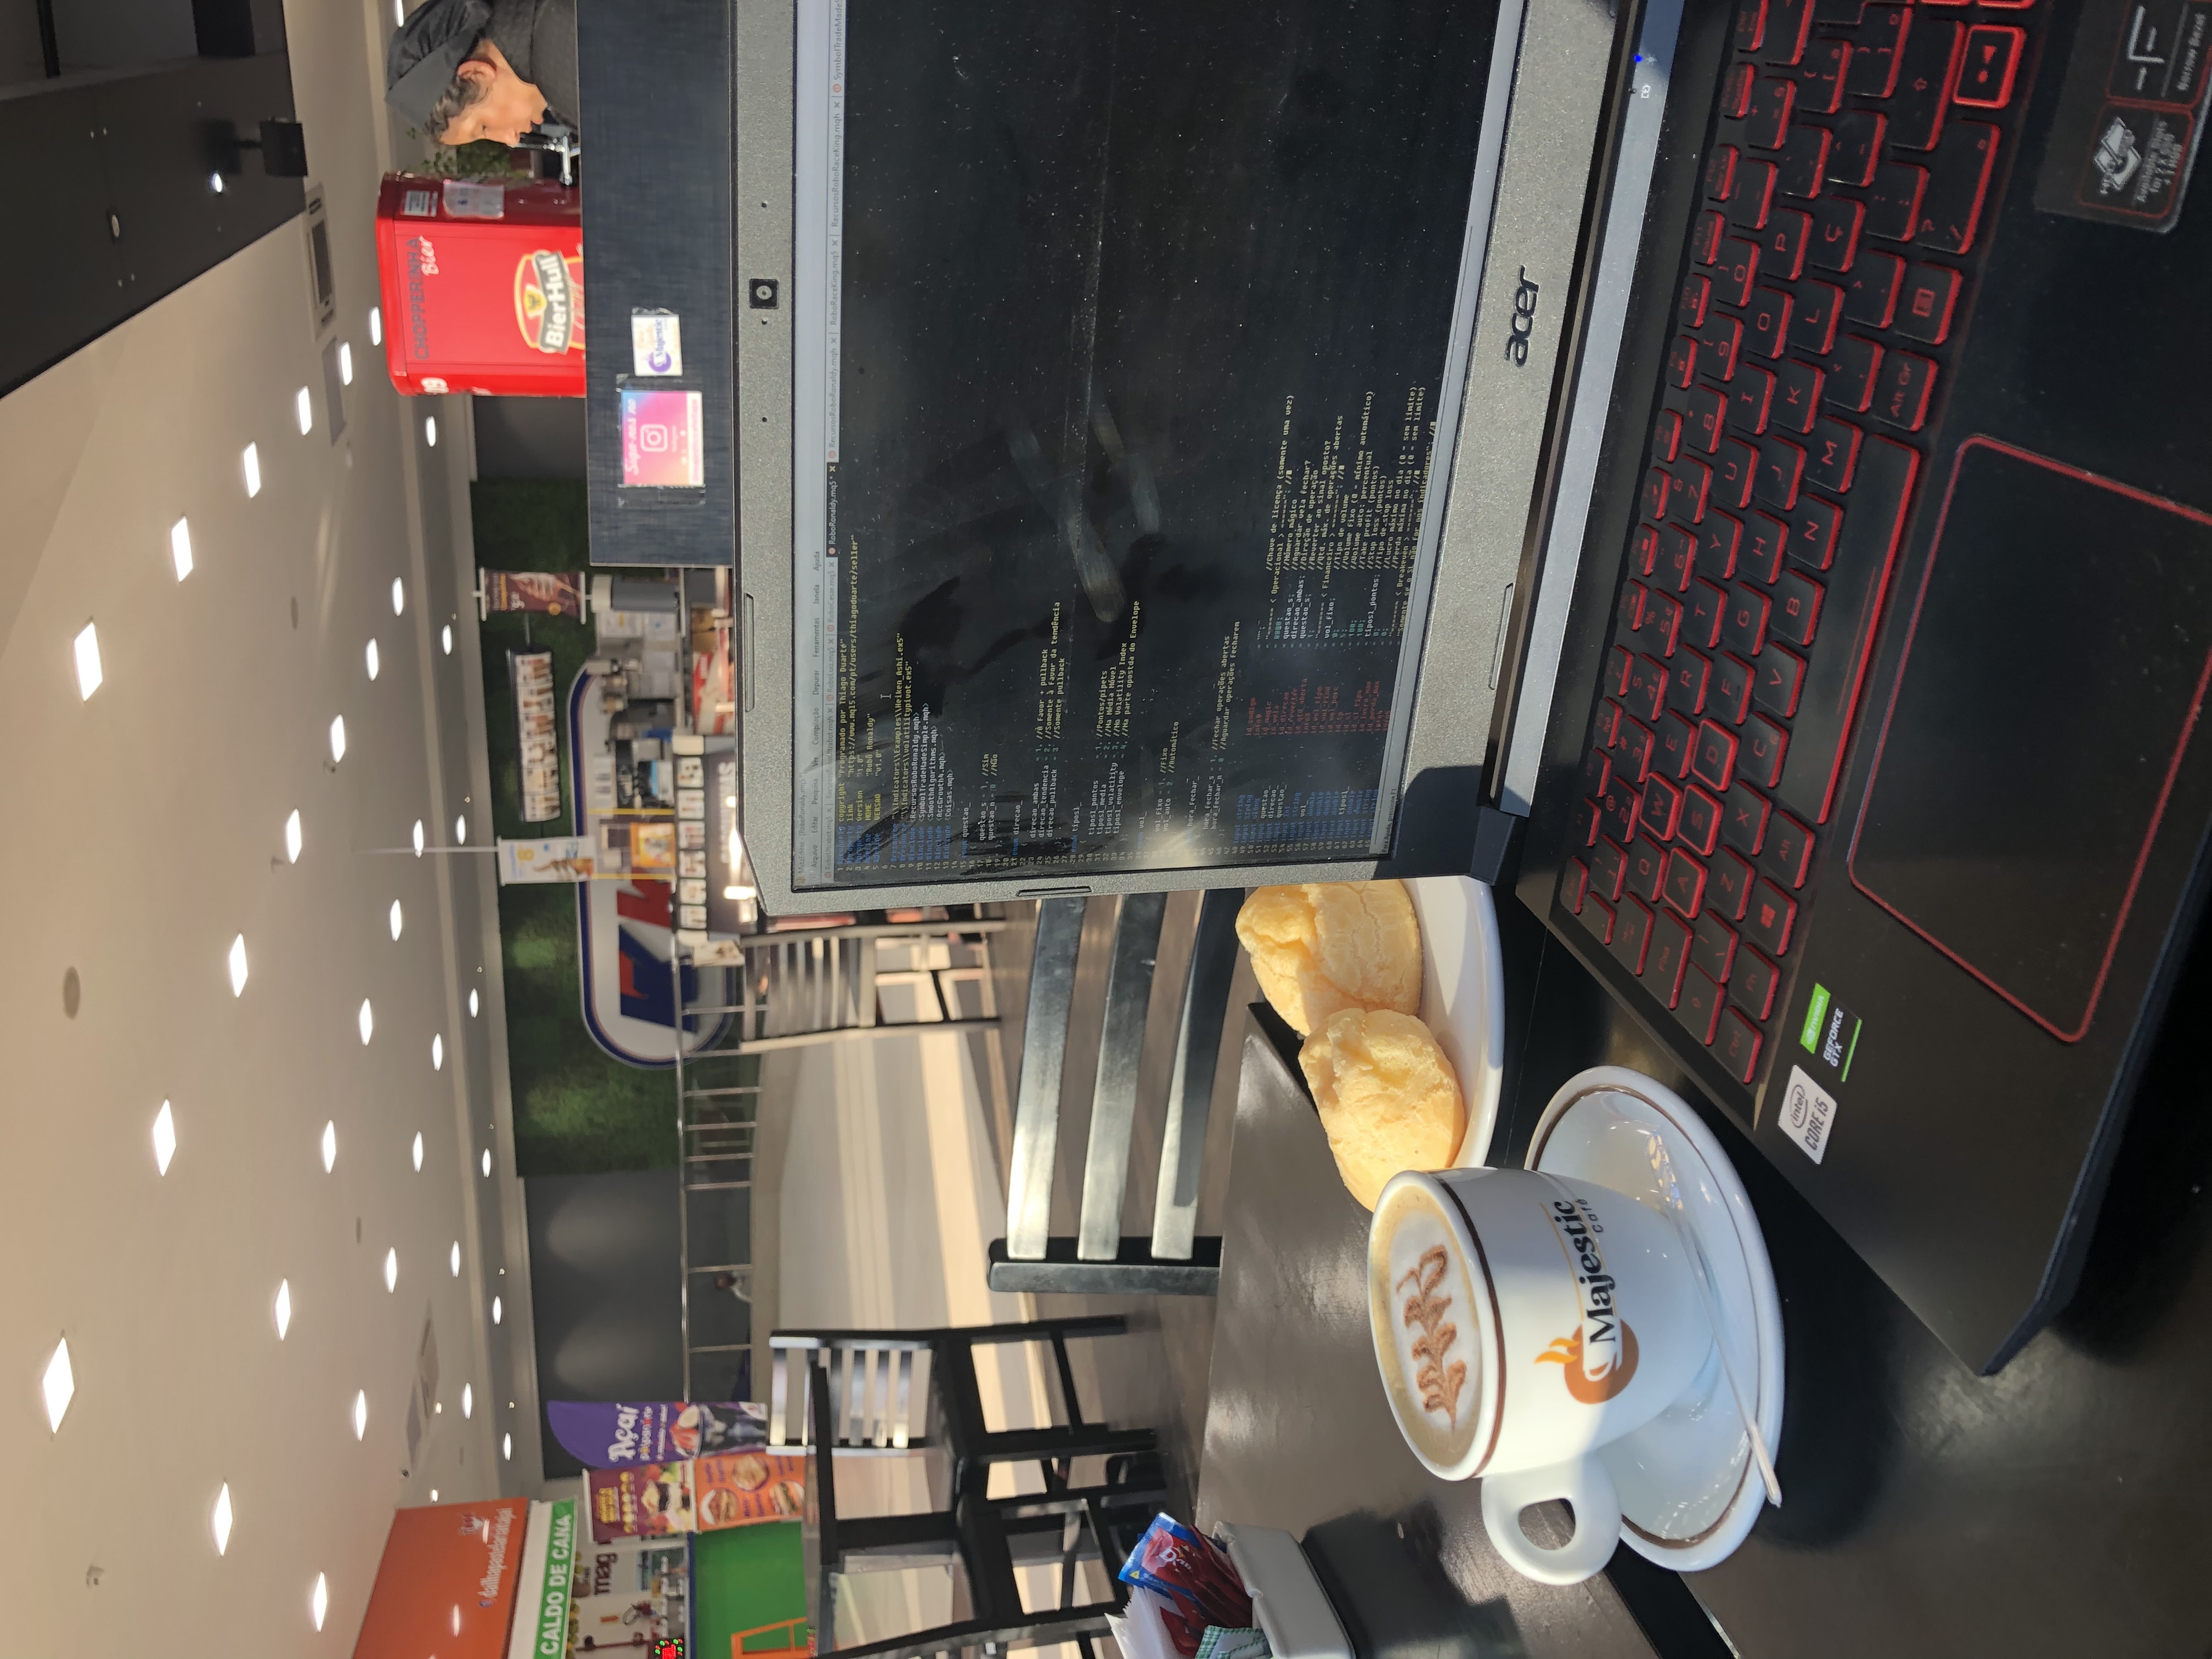
2016年からマーケット業界に携わっており、ブラジル出身です。
私はLitoral Tradingの創設者兼管理者であり、市場愛好家のコミュニティを運営しています。
2019年3月からMQL5のプログラミングに取り組み、MT5に特化してあなたの成長をサポートしています。
旅行好きで、二輪車愛好家です。
あなたの戦略を自動化したいですか?お見積もりはお気軽にご連絡ください!
私たちのページ:
▪️ YouTube: www.youtube.com/c/LitoralTrading
▪️ ウェブサイト: https://litoraltrading.com/?origem=MQL5
Litoral Tradingの LT Renko MT4 は、高度なビジュアル・トレーディングパネル(発注画面)を完全統合した、練行足(Renko)チャート生成のプロフェッショナル向け総合ソリューションです。従来のローソク足など時間軸チャート特有の「ノイズ」を排除したいトレーダーのために設計されており、純粋な値動き(プライスアクション)に基づいたチャートの正確性と、MetaTrader 4上でのハイパフォーマンスなプロ仕様発注パネルの執行速度を融合させました。 2つのシームレスな動作モードを搭載したLT Renko MT4は、極めて高い精度でカスタム・オフラインチャートを生成できるだけでなく、その生成されたチャート上で、ワンクリック注文、キーボードのショートカット(ホットキー)、注文ラインの視覚的配置、リスク管理などのすべてのトレーディング操作を完結させることができます。 ### 実践的な仕組み * **練行足ジェネレーター・モード (M1):** ベースとなる通貨ペアや銘柄のM1(1分足)のヒストリカルデータから、カスタム・オフラインチャート(例
Litoral Trading の LT Renko は、Renko チャート生成機能と高度なビジュアル取引パネルを統合した、完全なプロフェッショナル向けソリューションです。時間足チャート(従来のローソク足)に含まれるノイズを排除したいトレーダー向けに設計されており、価格の動きだけに基づく正確性と、高性能なプロ仕様の取引パネルによる高速執行を組み合わせています。 2つの統合された動作モードにより、LT Renko は最大限の精度でカスタムチャートを生成し、その生成されたチャート上で、クリック執行、キーボードショートカット(ホットキー)、注文の視覚的な配置、リスク管理を直接行うことができます。 実際の動作 ■ Renko ジェネレーターモード(オフライン): ベース銘柄の M1 バー履歴、または実際のティックデータをカスタムオフラインチャートに変換します。チャートはシステムによって自動的に作成・表示され、ティックごとのリアルタイム更 新を維持しながら、形成中のボックス、ヒゲ、そして任意のギャップ補完(ゴーストボックス / ghost boxes)を表示します。 ■
For those who like trend the Force will be a very useful indicator. This is because it is based on the famouse ADX, which measure the strenght of a trend, but without its 3 confusing lines. Force has its very simple interpretation: if the histogram is above zero level the trend is up, otherwise it is down. You can use it to find divergences too, which is very profitable. If you have any doubt or suggestion, please, contact me. Enjoy! MT5 version:
| 仕様品質 | 5.0 | |
| 結果チェックの品質 | 5.0 | |
| 可用性とコミュニケーションスキル | 4.0 |
Ele está disponível no whatsapp: https://chat.whatsapp.com/FzOvbQiYCyYD65AgCgTKpU
E no telegram: https://t.me/criptotododia
This indicator combines TRIX (Triple Exponential Moving Average) with a Moving Average, which can be simple, exponential, smoothed or weighted. This combination is very useful to identify the main trend and when it is changing to a new direction. The indicator also has signals on the chart that indicates the TRIX crossing with the Moving Average, as well as pop-up alerts and push (in the MT5 app). Enjoy it
| 仕様品質 | 5.0 | |
| 結果チェックの品質 | 5.0 | |
| 可用性とコミュニケーションスキル | 5.0 |
EN: News! I am working on version 2.0 of the panel. I am rewritten it from complete zero with my new MQL5 programming skills. It will have a lot of new stuffs and more stable. Stay tunned!
T Trade Panel Pro 2 - 究極のリスク管理&高速注文ツール LT Trade Panel Pro は、MetaTrader 5 において精度、スピード、そして完璧なリスク管理を求めるトレーダーのための究極のツールです。 スキャルピング や デイトレーダー 向けに設計されており、複雑な注文実行をワンクリックで直感的に行えるようにします。 最新の バージョン 2 では、システムを全面的に刷新し、遅延を最小限に抑え、独自の資金保護機能を追加して最高のパフォーマンスを実現しました。 🔥 なぜ LT Trade Panel Pro を選ぶのか? 多くのトレーダーが失敗する原因は、リスク管理の規律不足にあります。 LT Trade Panel Pro は、最も重要なプロセスである「リスクを一定に保ち、適切なタイミングでポジションを保護する」ことを自動化します。 プロップファーム (Prop Firms)
This is a buyer and seller aggression indicator that analyzes the shape of each candle and project this data in a histogram form. There are 4 histograms in one. On the front we have two: Upper - Buyer force. Lower - Seller force. At the background we also have two histogram, both with same color. They measure the combined strenght of buyers and sellers. This histograms can be turned off in Input Parameters. It is also possible to have the real or tick volume to help on this force measurement
Pointer Sync is a pointer synchronizer between open charts. It makes the MT5 cross (activated by the middle mouse button) to be replicated on all open charts. In addition, it is possible to create horizontal lines (letter H) and vertical lines (letter V), very useful for studying. The appearance of the lines is customizable. Note: Synchronization is through the X and Y scale in pixels , not price and/or date. It is a simple and free utility. Enjoy! This is a free indicator, but it took hours to
Auto Fibo Expansion is an indicator that projects the Fibonacci expansion levels above and below the opening price of the day. It does the calculation based on the previous day and projects the levels on the current day. It is very efficient to find "psychological" zones of support and resistance. Its appearance is all configurable and you can set up to 30 different levels. Enjoy! This is a free indicator, but it took hours to develop. If you want to pay me a coffee, I appreciate a lot