LT Volume
- インディケータ
- バージョン: 1.5
- アップデート済み: 17 6月 2026

LT Volume は、MetaTrader 5 向けの従来型ボリュームインジケーターを自然に進化させたものです。よりスマートでダイナミックなフロー分析を提供するために設計されており、従来の限定的なバー表示を大きく超えて、機関投資家レベルの相場分析を強化する強力な機能セットを備えています。
流動性の追跡や、相場の消耗ポイント、またはブレイクアウトの検出に最適で、チャート上での視覚的な操作性をよりスムーズにします。
⭐ 主な機能
■ 柔軟なボリューム: ティックボリューム、またはブローカーが提供している場合は実際の市場出来高の読み取りに対応。
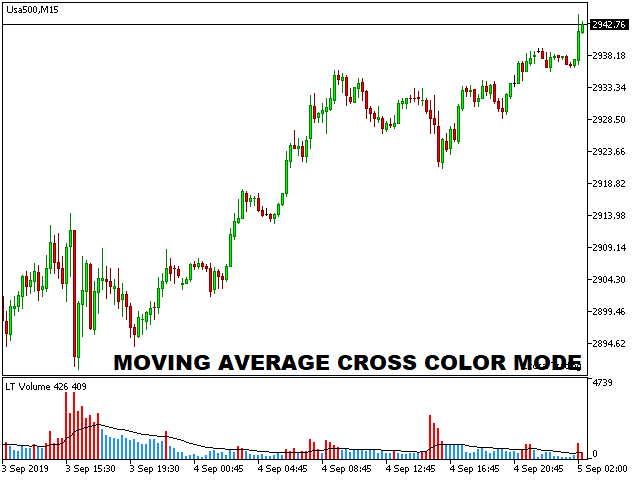
■ 統合移動平均: ボリュームヒストグラム上に直接適用される、完全にカスタマイズ可能な移動平均により、方向性のあるフローを追跡できます。
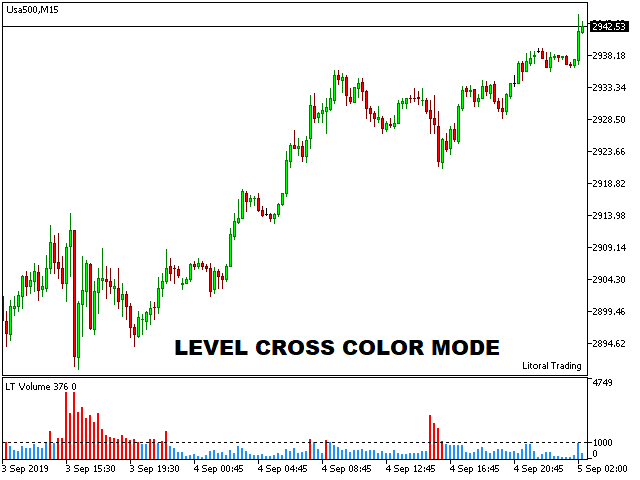
■ 固定レベル: 固定のアラートレベルを設定すると、インジケーターが警告ラインを描画します。高頻度戦略や大口プレイヤーの検出に最適です。
■ 最大限の最適化: LT Volume のコードは軽量かつ非常に高性能で、リアルタイム市場のスピードに関係なく、ターミナルを滑らかに動作させます。
■ 多言語対応: インターフェースは 6 つの言語(ポルトガル語、英語、スペイン語、ロシア語、日本語、中国語)に動的に適応します。
⭐ 5 つの動的カラー方式(Smart Colors)
LT Volume は単なるグレー表示ではなく、選択した 5 つの論理条件に基づいて、リアルタイムでヒストグラムを自動的に色分けします。
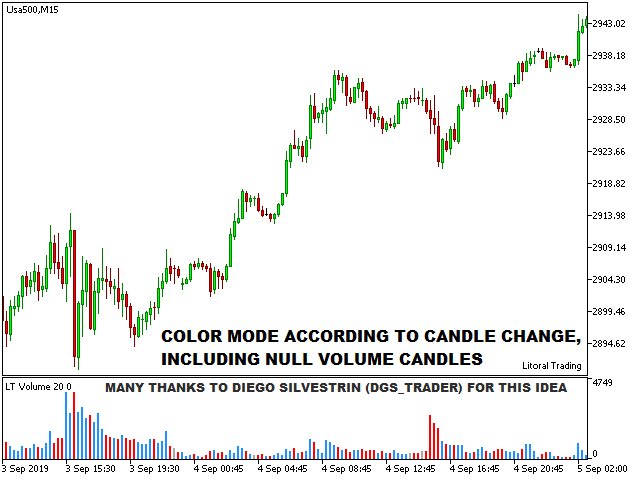
• ローソク足の方向: 現在の価格トレンドに基づいて色分けし、ノイズや方向感のないバーを無視するための内部 Doji フィルターも備えています。
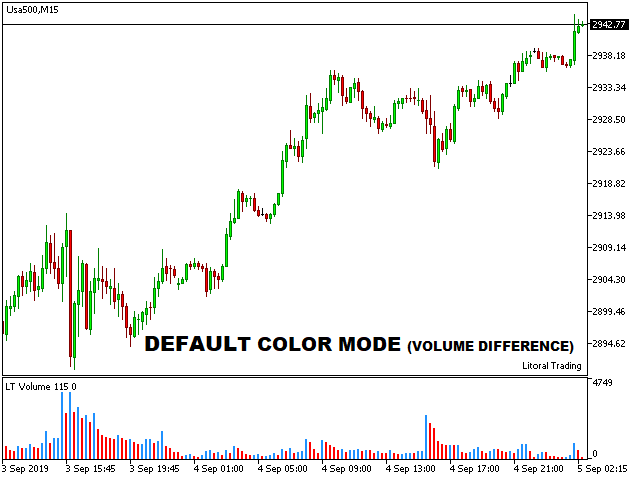
• ボリュームブレイク: 現在のボリュームが前のバーのボリュームを上回った場合のみ、バーをインテリジェントに強調表示します。
• 移動平均ブレイク: ボリュームバーが移動平均をクロスまたはブレイクした場合のみ、そのバーに色を付けます。
• 固定レベルブレイクアウト: 設定されたアラートレベルを超えた際に、強調されたカラー表示を適用します。
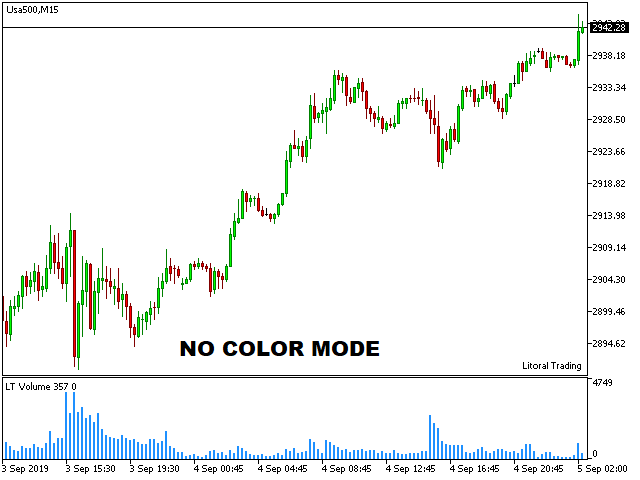
• 単色表示: クリーンな分析に適した、クラシックでソリッドかつ静的な表示です。
⭐ スマート戦略アラート
一日中画面を見続けると目が疲れます。アラート(画面ポップアップ、モバイルプッシュ通知、またはメール)を設定すれば、LT Volume が正確なタイミングで通知します。
✓ 移動平均ブレイクのアラート。
✓ 乗数係数(K): たとえば、バーのボリュームが平均の 1.5 倍に達した場合のみアラートを受け取れます。
✓ 固定レベルのクロスアラート。
✓ 「ローソク足確定」通知セーフティシステムにより、誤ったアラートや同じ分内での複数通知を防止します。
過去にご提案をいただいた Diego Silvestrin 氏および Konstantin Demidov 氏に感謝いたします。このコードをぜひ皆様の取引にご活用ください。
ご質問やご提案がございましたら、どうぞお気軽にお問い合わせください。


Отличный