LT Rainbow Trend
- インディケータ
- バージョン: 1.2
- アップデート済み: 10 1月 2025
- アクティベーション: 20

== LT RAINBOW TREND - 36本の移動平均線を持つトレンドインジケーター ==
■ 概要
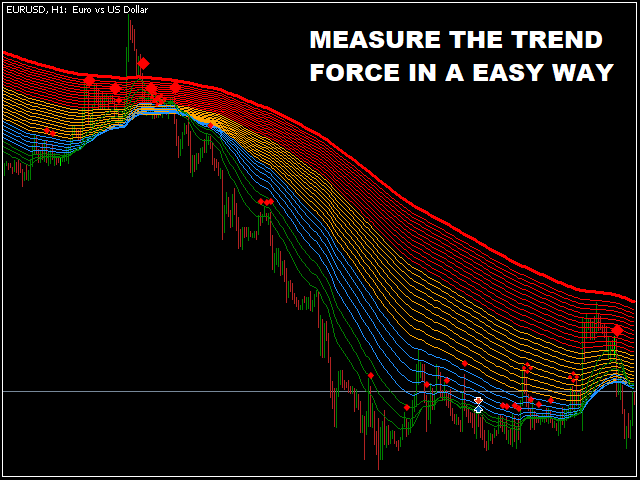
LT Rainbow Trendは、36本の移動平均線を同時に処理し、スマートなカラーシステム(レインボー)を搭載した先進的なトレンド分析テクニカルインジケーターです。主力のトレンド方向へ最大の視覚的明瞭さをもって取引したいトレーダーのために開発され、マルチタイムフレーム分析の複雑さを、シンプルでカラフル、かつ非常に直感的なビジュアルへと変換します。
「トレンドは友達(The trend is your friend)」であることを理解しているトレーダーに最適です。このインジケーターは、トレンドの強さ、方向、そして潜在的な反転を常に事前に見極めることを可能にします。
■ 仕組み
インジケーターは、4つのトレンドゾーンに分散された36本の移動平均線を監視します:
-
🔴 赤(トレンド転換ゾーン)
-
31〜20番目の移動平均線
-
トレンドが反転する可能性を示す強いサイン
-
-
🟠 オレンジ(トレンド減速ゾーン)
-
19〜10番目の移動平均線
-
トレンドの勢いが失われつつあるが、継続の可能性もあるサイン。価格がレンジ(保ち合い)に入りつつある状態
-
-
🔵 青(プルバック/押し目・戻りゾーン)
-
9〜8番目の移動平均線
-
現在のトレンドを継続するための調整。価格がこのゾーンの外にあり、緑のゾーンに入っている場合は強いトレンドを示します
-
-
🟢 緑(強力トレンドゾーン)
-
10〜8番目の短期移動平均線
-
強力なトレンドの発生を示します
-
■ 主な機能
-
✓ 36本の移動平均線をクリアな1画面に統合
画面の乱れや複雑なラインに惑わされることなく、複数の価格スピードを追跡。リアルタイムのトレンドの強さという、本当に重要な情報だけを表示します。
-
✓ 動的なレインボーカラーシステム
トレンドの強弱に応じて、カラーが自動的に切り替わります。
-
✓ 3つの期間における売買シグナル
以下の期間のアラートを同時に受信可能:
-
長期(構造的なトレンド)
-
中期(中間のトレンド)
-
短期(ミクロな値動き)
チャートを切り替えることなく、複数のタイムフレーム分析を同時に行えます!
-
-
✓ 反転の自動検出
レインボーの配色順序が変わる時は、潜在的な反転の警告です。抜け目のないトレーダーは、この瞬間に高確率なエントリーポイントを見つけ出します。
-
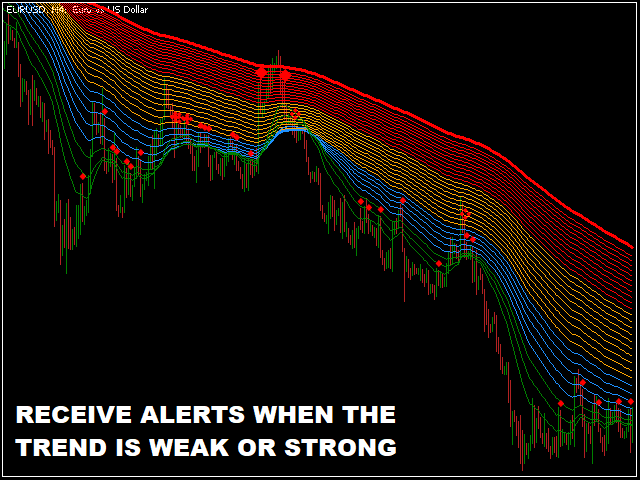
✓ スマートな音声アラート
価格がゾーン間を遷移した際に自動通知。常にチャートを見つめていなくても、最新の状態を把握できます。
-
✓ すべてのタイムフレームに対応
M1, M5, M15, M30, H1, H4, D1, W1, MN — あらゆるトレード戦略やスタイルに完璧に適応します。
-
✓ ウルトラシンプルインターフェース
直感的な設定。学習コストはゼロ。初心者から経験豊富なトレーダーまで、導入後すぐに使いこなせます。
-
✓ パフォーマンスの最適化
36本の移動平均線を処理しながらも、MetaTrader 5の動作速度に目立った影響を与えません。
-
⭐ トレンドフォロワーに最適: ブレイクアウト、モメンタム、プライスアクションなど、トレンドフォローを主軸とする戦略において、このインジケーターは必須のツールとなります。主方向がどちらであるかという主観を排除できます。
-
⭐ 伝統的なテクニカル分析とのシナジー: サポート・レジスタンス、ローソク足パターン、トレンドライン、フィボナッチレベルと組み合わせることで、極めて勝率の高いエントリーが可能になります。
-
⭐ 感情的なバイアスを排除: 脳内で「これはトレンドなのだろうか?」と悩む代わりに、レインボーが視覚的に「YESかNOか」を答えてくれます。より素早く、より明確な意思決定が可能になり、感情に左右されません。
-
⭐ あらゆる市場に適用可能: FX、株式、暗号資産、コモディティ、インデックス — 価格とトレンドが存在する場所であれば、どこでもRainbow Trendは機能します。
■ テクニカルな強み
-
ノーリペイント(No Repaint): シグナルはローソク足の確定時に厳格に確定します。
-
MT5に最適化: MetaTrader 5の最新のアーキテクチャ機能を活用しています。
-
低いCPU負荷: VPS上での24時間5連続(24/5)の常時稼働に最適です。
-
メール/SMSアラート対応: PCから離れていても通知を受け取ることができます。
-
無料アップデート: 将来的な継続的改善や機能向上がすべて含まれています。


As an avid trend trader, I'm always on the lookout for tools that can enhance my trading strategy, and the Rainbow Trend indicator has proven to be a game-changer in my approach to the markets. One of the standout features of Rainbow Trend is its intuitive use of multiple Moving Averages, providing a comprehensive analysis of different trend strength zones across various timeframes. The very long term, long term, mid-term, short term, and very short term zones are color-coded for easy interpretation, offering a visual roadmap of the market dynamics. Configuring the indicator is a breeze, making it accessible even for traders with varying levels of experience. The simplicity of the setup ensures that you can focus more on making informed trading decisions rather than getting bogged down in complex settings. What truly sets Rainbow Trend apart is its dynamic alert system. The ability to receive sound alerts when prices transition between different trend zones adds an extra layer of convenience, allowing you to stay on top of market movements without constantly monitoring your charts. In my experience, Rainbow Trend has been instrumental in identifying potential trend reversals and confirming the strength of prevailing trends. The visual representation of trend zones is not only informative but also aesthetically pleasing, making it a pleasure to use on a daily basis. Furthermore, the developer's commitment to user satisfaction is evident in the invitation to report bugs or provide suggestions through the chat or discussion tab. This level of customer engagement creates a sense of trust and transparency that is crucial in the world of trading indicators. For those who appreciate a good deal, I recommend reaching out to the developer via chat for potential discounts. It's a testament to their dedication to making their indicator accessible to a wide range of traders. In conclusion, Rainbow Trend has significantly enhanced my trading journey, providing a clear and comprehensive view of market trends. Whether you're a seasoned trader or just starting, this indicator is a valuable addition to your toolkit. Don't miss the opportunity to elevate your trading experience – dive into the world of Rainbow Trend and enjoy the profits it can unlock for you!