Trendline with Fibonacci Retracement

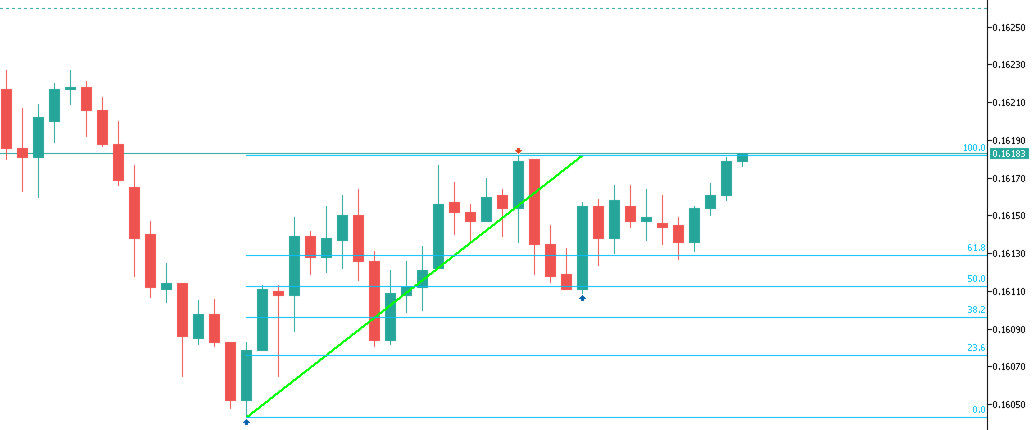
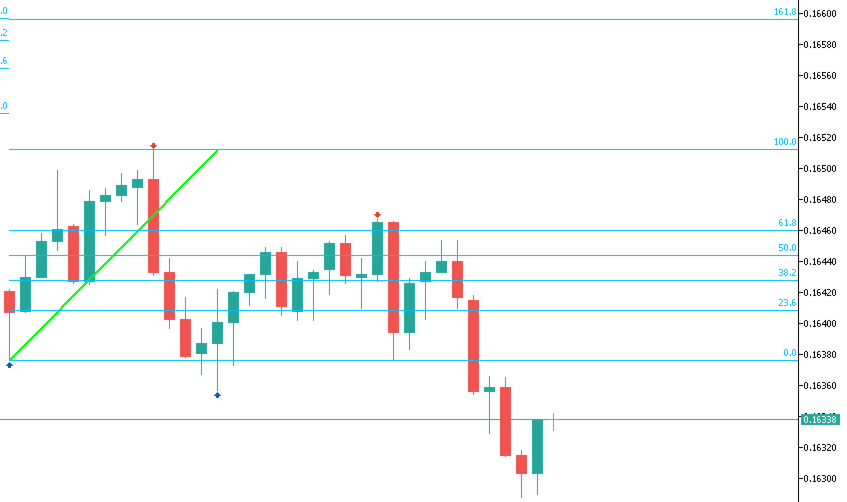
The Swing High Low and Fibonacci Retracement Indicator is a powerful technical analysis tool designed to identify key price levels and potential reversal zones in the market. It automatically detects recent swing highs and swing lows on the chart and overlays Fibonacci retracement levels based on these points.

This indicator helps traders:

  • Visualize market structure by highlighting recent swing points.

  • Identify support and resistance zones using Fibonacci ratios (e.g., 38.2%, 50%, 61.8%).

  • Adapt to different timeframes and trading styles, from scalping to swing trading.

Whether you're analyzing trends or spotting pullback opportunities, this indicator combines price action with the power of Fibonacci to give you a clearer edge in the markets.


おすすめのプロダクト
SMC Venom Model BPR インジケーターは、スマート マネー (SMC) コンセプトで取引するトレーダー向けのプロフェッショナル ツールです。価格チャート上の 2 つの主要なパターンを自動的に識別します。 FVG   (フェアバリューギャップ) は、3 本のローソク足の組み合わせで、最初のローソク足と 3 番目のローソク足の間にギャップがあります。ボリュームサポートのないレベル間のゾーンを形成し、価格修正につながることがよくあります。 BPR   (バランス価格範囲) は、2 つの FVG パターンの組み合わせで、「ブリッジ」を形成します。これは、価格がボリュームアクティビティの少ない動きで動くときに、ブレイクアウトしてレベルに戻るゾーンで、ローソク足の間にギャップを作成します。 これらのパターンは、大規模な市場プレーヤーと一般参加者の相互作用が発生するチャート上のボリュームと価格動向の分析に基づいて、トレーダーが主要なサポート/レジスタンス レベル、ブレイクアウト ゾーン、エントリ ポイントを識別するのに役立ちます。 インジケーターは、長方形と矢印の形でパターンを視覚
Advanced ideas of the popular MACD indicator: It detects and displays classic and reverse divergences (two methods of detecting divergences). It uses different color to highlight an uptrend and a downtrend. Two methods of determining a trend: а) MACD crosses the 0 level (classic signal); б) MACD crosses its own average (early signal). This is a multi-timeframe indicator: it can display MACD data from other timeframes. Two methods of drawing: classic histogram and line. It generates sound and vis
**  All Symbols  x  All Timeframes  scan just by pressing scanner button ** *** Contact me  to send you instruction and add you in "Wolfe Wave Scanner group" for sharing or seeing experiences with other users. Introduction: A Wolfe Wave is created with five-wave patterns in price. It shows supply and demand and a fight towards a balance price. T hese waves of price actions can help traders identify the boundaries of   the trend . Also  It helps forecast how the price will move in the near futur
CosmiCLab SMC FIBO CosmiCLab SMC FIBO is a professional trading indicator designed for traders who use Smart Money Concepts (SMC), market structure analysis and Fibonacci retracement levels. The indicator automatically detects market swings and builds Fibonacci levels based on the latest impulse movement. It also identifies market structure changes such as BOS (Break of Structure) and CHOCH (Change of Character), helping traders understand the current market direction. CosmiCLab SMC FIBO also pr
Description : Rainbow EA MT5 is a simple Expert advisor based on   Rainbow MT5 indicator witch is based on Moving average with period 34. The indicator is incorporated in the EA, therefore, it is not required for the EA to operate, but if you wish, you can download it from   my product page . The Expert Advisor settings are as follows : Suitable for Timeframes up to H1 The parameters below can be set according to your trading rules. StopLoss ( Stop Loss in pips) TakeProfit ( Take Profit in pips
The   Fibonacci Confluence Toolkit   is a technical analysis tool designed to help traders identify potential price reversal zones by combining key market signals and patterns. It highlights areas of interest where significant price action or reactions are anticipated, automatically applies Fibonacci retracement levels to outline potential pullback zones, and detects engulfing candle patterns. Its unique strength lies in its reliance solely on price patterns, eliminating the need for user-define
Auto Optimized RSI   は、正確な売買シグナルを提供するために設計された、使いやすいスマートな矢印インジケーターです。過去のデータを使ったトレードシミュレーションに基づき、各通貨ペアや時間足に最適なRSIの買い/売りレベルを自動で見つけ出します。 このインジケーターは、独立したトレードシステムとしても、既存の戦略の一部としても使用できます。特に短期トレーダーにとって便利なツールです。 従来のRSI(70/30など)の固定レベルとは異なり、 Auto Optimized RSI   はリアルな価格の動きとバックテスト結果に基づき、ダイナミックにレベルを調整します。勝率、ドローダウン、平均利益/損失といった重要な統計をモニターし、現在の市場に適応して、本当に機能するシグナルを提供します。 RSIが最適化されたレベルをクロスすると、チャート上に買い・売りの矢印が表示され、成功率の高いエントリーポイントを見つけるのに役立ちます。 ご購入後にご連絡いただければ、追加のツールや特別なトレードのヒントを無料でお渡しいたします! 皆様のトレードが成功しますように!
これはほぼ間違いなく、MetaTraderプラットフォームで見つけることができる最も完全な調和価格形成自動認識インジケーターです。 19種類のパターンを検出し、フィボナッチプロジェクションをあなたと同じように真剣に受け止め、潜在的逆転ゾーン(PRZ)を表示し、適切なストップロスとテイクプロフィットレベルを見つけます。 [ インストールガイド | 更新ガイド | トラブルシューティング | よくある質問 | すべての製品 ] 19の異なる調和価格形成を検出します プライマリ、派生および補完フィボナッチ投影(PRZ)をプロットします 過去の価格行動を評価し、過去のすべてのパターンを表示します この指標は、独自の品質とパフォーマンスを分析します 適切なストップロスとテイクプロフィットのレベルを表示します ブレイクアウトを使用して適切な取引を通知します すべてのパターン比をグラフにプロットします 電子メール/音声/視覚アラートを実装します スコット・M・カーニーの本に着想を得て、この指標は最も純粋で急を要するトレーダーのニーズを満たすように設計されています。ただし、トレードを容易にする
The indicator is designed to help in making a decision on the direction of trading (buy or sell). It is a history scanner that searches for matches of the current pattern (combination of several current bars) with historical data in percentage terms by the relative vertical position of candles relative to each other, the size of each candle, the size of the candle body and the candle shadows. In history, the matches found are indicated by vertical lines on the candle of the beginning of the soug
RBreaker Gold Indicatorsは、金先物の短期日内取引戦略であり、トレンドフォローと日内反転の2つの取引手法を組み合わせたものです。トレンド相場での利益を捉えるだけでなく、相場が反転した際には迅速に利確し、その流れに沿ってポジションを反転させることができます。 この戦略は、アメリカの雑誌『Futures Truth』において、15年連続で最も収益性の高い取引戦略トップ10に選ばれた実績を持ち、非常に長いライフサイクルを誇り、現在も国内外で広く使用・研究されています。 本インディケーターは、2026年の金先物の値動きに対応し、14日間のATR指標に基づいて、ブレイクアウト係数A、観察係数B、リバーサル係数Rをより合理的な値で定義しています。非常に優れたインディケーターであり、安定的な年間収益を実現しています。ぜひおすすめします〜
This indicator is a   technical tool based on harmonic approximations   of solar and lunar cycles. It   does not use exact astronomical positions. This indicator uses   mathematical waves to approximate daily solar and monthly lunar cycles   for trading purposes. It captures general market rhythms influenced by day/night and moon phases, but it   does not track exact astronomical positions . Do your analysis and study on back test before purchase.  The   Advanced Astrological Indicator   is a m
Price Magnet — Price Density and Attraction Levels Indicator Price Magnet is a professional analytical tool designed to identify key support and resistance levels based on statistical Price Density. The indicator analyzes a specified historical period and detects price levels where the market spent the most time. These zones act as “magnets,” attracting price action or forming a structural base for potential reversals. Unlike traditional Volume Profile tools, Price Magnet focuses on price-time d
プレミアムレベルは、正しい予測の精度が80%を超える独自の指標です。 この指標は、最高のトレーディングスペシャリストによって2か月以上テストされています。 あなたが他のどこにも見つけられない作者の指標! スクリーンショットから、このツールの正確さを自分で確認できます。 1は、1キャンドルの有効期限を持つバイナリーオプションの取引に最適です。 2はすべての通貨ペア、株式、商品、暗号通貨で機能します 手順: 赤い矢印が表示されたらすぐにダウントレードを開き、青い矢印が表示されたら閉じます。青い矢印の後に開くこともできます。 試してテストしてください!推奨設定はデフォルトです! 日足チャートで最高の精度を示します! インディケータは、2600 Pipsの収益性に対して、約10Pipsという非常に小さなマージンを使用します。
This is an advanced multi-timeframe version of the popular Hull Moving Average (HMA) Features Two lines of the Hull indicator of different timeframes on the same chart. The HMA line of the higher timeframe defines the trend, and the HMA line of the current timeframe defines the short-term price movements. A graphical panel with HMA indicator data from all timeframes at the same time . If the HMA switched its direction on any timeframe, the panel displays a question or exclamation mark with a tex
The Trend Duration Forecast MT5 indicator is designed to estimate the probable lifespan of a bullish or bearish trend. Using a Hull Moving Average (HMA) to detect directional shifts, it tracks the duration of each historical trend and calculates an average to forecast how long the current trend is statistically likely to continue. This allows traders to visualize both real-time trend strength and potential exhaustion zones with exceptional clarity. KEY FEATURES Dynamic Trend Detection:   Utiliz
PR EA - Engulfing Pattern Trading System Automated Engulfing Pattern Detection with MA Confirmation The PR EA is a Meta Trader 5 expert advisor that identifies and trades bullish/bearish engulfing candlestick patterns when confirmed by a moving average filter. Designed for swing trading on 30-minute charts with compatibility for M15 and H1 time frames. Key Features: Pattern Recognition - Detects valid bullish/bearish engulfing candle formations Trend Confirmation - 238-period SMA filter
The new update makes this indicator a complete tool for studying, analyzing and operating probabilistic patterns. It includes: On-chart Multi-asset percentage monitor. Configurable martingales. Twenty-one pre-configured patterns, including Mhi patterns and C3. An advanced pattern editor to store up to 5 custom patterns. Backtest mode to test results with loss reports. Trend filter. Hit operational filter. Martingale Cycles option. Various types of strategies and alerts. Confluence between patter
Automatic fibonacci with alerts is an indicator that automatically plots a fibonacci retracement based on the number of bars you select on the BarsToScan setting in the indicator. The fibonacci is automatically updated in real time as new highest and lowest values appear amongst the selected bars. You can select which level values to be displayed in the indicator settings. You can also select the color of the levels thus enabling the trader to be able to attach the indicator several times with d
Introduction to the Manual Backtesting Indicator on MQL5 The MetaTrader platform provides an excellent backtesting tool for evaluating Expert Advisors (EAs). However, when it comes to manually backtesting a strategy to assess its effectiveness, this tool has some limitations: You cannot manually draw zones or trend lines while in backtesting mode. You cannot switch timeframes to check time alignment. For example, if my strategy requires additional confirmation from a higher timeframe (HTF), this
Noize Absorption Index - is the manual trading system that measures the difference of pressure between bears forces and bulls forces. Green line - is a noize free index that showing curent situation. Zero value of index shows totally choppy/flat market.Values above zero level shows how powerfull bullish wave is and values below zero measures bearish forces.Up arrow appears on bearish market when it's ready to reverse, dn arrow appears on weak bullish market, as a result of reverse expectation.
Indicator Name: Fibaction – price action candle Detector Description: Fibo Signal Boxes is a powerful Smart Money Concept (SMC)-inspired indicator that auto-detects price action candles. bullish hammers and shooting stars, then draws precise Fibonacci entry zones and multiple take-profit levels directly on the chart. as for the SL personally i use 40 pips rules  Key Features: Detects bullish hammer and shooting star reversal candles. Automatically draws Fibonacci entry and TP boxes. as
Welcome to the Ultimate Harmonic Patterns recognition indicator that is focused to detect advanced patterns. The Gartley pattern, Bat pattern, and Cypher pattern  are popular technical analysis tools used by traders to identify potential reversal points in the market. Our Ultimate Harmonic Patterns recognition Indicator is a powerful tool that uses advanced algorithms to scan the markets and identify these patterns in real-time. With our Ultimate Harmonic Patterns recognition Indicator, you ca
The Optimized MACD Divergence indicator is a powerful tool designed to identify potential trading opportunities by detecting divergences between price action and the MACD indicator. It combines classic divergence analysis with candlestick pattern recognition and volume filtering to provide more accurate and reliable signals. How it Works The indicator operates on the following principles: MACD Calculation:   It calculates the MACD indicator using user-defined parameters for fast EMA, slow EMA,
まず第一に、この取引ツールはノンリペイント、ノンリドロー、ノンラグの指標であり、プロの取引に理想的ですことを強調する価値があります。 オンラインコース、ユーザーマニュアル、デモ。 スマートプライスアクションコンセプトインジケーターは、新米から経験豊富なトレーダーまで、非常 に強力なツールです。Inner Circle Trader AnalysisやSmart Money Concepts Trading Strategiesなど、20以上の有用な指標を1つに組み合わせています。このインジケーターはスマートマネーコンセプトに焦点を当て、大手機関の取引方法を提供し、彼らの動きを予測するのに役立ちます。 特に、流動性分析に優れており、機関がどのように取引しているかを理解しやすくしています。市場のトレンドを予測し、価格の動きを慎重に分析するのに優れています。機関の戦略とトレードを合わせることで、市場の動向についてより正確な予測ができます。このインジケーターは多目的であり、市場構造を分析し、重要な注文ブロックを特定し、さまざまなパターンを認識するのに優れています。 このインジケーター
Chỉ báo này sẽ thông báo cho bạn nếu cấu hình xu hướng thành công. Tín hiệu theo xu hướng không nên được tăng theo, nhưng tín hiệu mua ở mức giá thấp theo mô hình giao dịch thông thường của bạn, hoặc tín hiệu bán ở mức giá tốt, là một lựa chọn rất tốt. Hãy thiết lập nó trên khung thời gian lớn hơn và theo dõi các khung thời gian nhỏ hơn, bám sát các xu hướng chính. Tôi thường thiết lập ba khung thời gian gần nhau nhất và không bao giờ đi ngược tín hiệu của INdicator này. INdicator   này không có
Crypto_Forex インジケーター   PINBAR パターン MT5用。リペイントなし、遅延なし。 - インジケーター「PINBARパターン」は、プライスアクション取引に非常に強力なインジケーターです。 - インジケーターはチャート上のピンバーを検出します。 - 強気のピンバー - チャート上に青い矢印シグナルを表示します(画像参照)。 - 弱気のピンバー - チャート上に赤い矢印シグナルを表示します(画像参照)。 - PC およびモバイルのアラート付き 。 - インジケーター「PINBARパターン」は、サポート/レジスタンスレベルと組み合わせるのに最適です。 高品質のトレーディングロボットとインジケーターをご覧になるにはここをクリックしてください! これは、このMQL5ウェブサイトでのみ提供されるオリジナル製品です。
"Hunttern harmonic pattern finder" base on the dynamic zigzag with the notification and prediction mode This version of the indicator identifies 11 harmonic patterns and predicts them in real-time before they are completely formed. It offers the ability to calculate the error rate of Zigzag patterns depending on a risk threshold. It moreover sends out a notification once the pattern is complete. The supported patterns: ABCD BAT ALT BAT BUTTERFLY GARTLEY CRAB DEEP CRAB CYPHER SHARK THREE DRIV
Basic Support and Resistance   インジケータは、テクニカル分析を強化するために必要なソリューションです。このインジケータを使用すると、チャートにサポートレベルとレジスタンスレベルを投影できます/ mt4バージョン 機能 フィボナッチレベルの統合: サポートと抵抗レベルとともにフィボナッチレベルを表示するオプションを使用すると、私たちの指標は市場行動と逆転領域の可能性についてさらに深い洞察を提供します。 パフォーマンスの最適化: 各バーの開口部のみで拡張ラインを更新するオプションを使用すると、インジケータは、サポートレベルと抵抗レベルの精度を犠牲にすることなく最適なパフォーマンスを保証します。 入力 メイン設定 Timeframe:  この入力を通じて、より高い時間枠のサポートラインとレジスタンスラインをチャート上に表示することを選択できます。 Support/Resistance Strength [Number of Bars]:   この入力を使用して、サポートと抵抗の強度を決定できます。数が高いほど、サポート/抵抗がより強くなります。 Pric
RRtoolbox - Professional Tools: Risk:Reward Trading Tool (SL/TP Horizontals + Pending orders + Diagonals), Alerts set on trend lines (for alerts on diagonal levels), SelfManagement (BE, partials...), close/cancelling by time, Statistics, Info and trading on chart. One-Click Trading with Visual Risk:Reward Management RRtoolbox is a comprehensive trading panel that combines one-click order execution,  statistics and  powerful visual Risk:Reward tools, alerts set with trendlines, on chart butt
Free automatic Fibonacci is an indicator that automatically plots a Fibonacci retracement based on the number of bars you select on the BarsToScan setting in the indicator. The Fibonacci is automatically updated in real time as new highest and lowest values appears amongst the selected bars. You can select which level values to be displayed in the indicator settings. You can also select the color of the levels thus enabling the trader to be able to attach the indicator several times with differe
FREE
このプロダクトを購入した人は以下も購入しています
SuperScalp Pro — 高度なマルチフィルター対応スキャルピングインジケーターシステム SuperScalp Pro は、クラシックな Supertrend と複数のインテリジェントな確認フィルターを組み合わせた高度なスキャルピング用インジケーターシステムです。M1〜H4 のすべての時間足で効率的に機能し、特に XAUUSD、BTCUSD、および主要なFX通貨ペアに適しています。単体のシステムとして、また既存の取引戦略へ柔軟に統合して使用できます。 本インジケーターは 11 以上のフィルターを統合しており、短期・長期の EMA、トレンド判定に用いる 3 本の EMA、EMA スロープ(EMA slope)、RSI、ADX、出来高、VWAP、ボリンジャーバンドのブレイクアウト、MACD ダイバージェンスフィルターなどを含みます。スマートキャンドルフィルターはローソク足の終値を確認して弱いシグナルを排除し、3 本の EMA と MACD ダイバージェンスを組み合わせたトレンド認識メカニズムにより勝率の高いシグナルの選別を支援します。 SuperScalp Pro は ATR に基
Azimuth Pro
Ottaviano De Cicco
5 (6)
発売プロモーション Azimuth Proは先着100名様限定で 299ドル でご提供します。最終価格は 499ドル となります。 リテールとインスティテューショナルのエントリーの違いはインジケーターではなく、ロケーションにあります。 多くのトレーダーは、モメンタムを追いかけたり、遅行シグナルに反応して、任意の価格レベルでエントリーします。機関投資家は、需給が実際にシフトする構造的なレベルに価格が到達するのを待ちます。 Azimuth Proはこれらのレベルを自動的にマッピングします:スイングアンカーVWAP、マルチタイムフレーム構造ライン、高確率ロケーションにのみ出現するABCパターン。 Azimuth Proは、構造分析とインテリジェントな自動化の両方を求めるプロフェッショナルトレーダー向けに構築されています。 Azimuthが外科的精度で市場構造をマッピングする一方、Azimuth Proはインテリジェンスレイヤーを追加します:トレーディングスタイルの自動検出、スマート設定された移動平均線、20年のデータでバックテストされた最適化パラメータ。その結果、お使いの銘柄と
このインジケーターを購入された方には、以下の特典を 無料 で提供しています: 各トレードを自動で管理し、ストップロスとテイクプロフィットを設定し、戦略ルールに基づいてポジションを決済する補助ツール 「Bomber Utility」 様々な銘柄に合わせたインジケーターの設定ファイル(セットファイル) 「最小リスク」、「バランスリスク」、「待機戦略」 の3つのモードで使用できる Bomber Utility 用の設定ファイル このトレーディング戦略をすぐに導入・設定・開始できる ステップバイステップのビデオマニュアル ご注意: 上記の特典を受け取るには、MQL5のプライベートメッセージシステムを通じて販売者にご連絡ください。 オリジナルのカスタムインジケーター 「Divergence Bomber(ダイバージェンス・ボンバー)」 をご紹介します。これは、MACDのダイバージェンス(乖離)戦略に基づいた 「オールインワン」型のトレーディングシステム です。 このテクニカルインジケーターの主な目的は、価格とMACDインジケーターの間に発生するダイバージェンスを検出 し、将来の価格の動きを示す
Entry In The Zone and SMC Multi Timeframe is a real-time market analysis tool developed based on Smart Money Concepts (SMC). It is designed to analyze market structure, price direction, reversal points, and key zones across multiple timeframes in a systematic way. The system displays Points of Interest (POI) and real-time No Repaint signals, with instant alerts when price reaches key zones or when signals occur within those zones. It functions as both an Indicator and a Signal System (2-in-1), c
CGE Trading Suite
Carl Gustav Johan Ekstrom
5 (1)
CGE Trading Suite delivers the analytical edge typically reserved for professional trading desks. The platform integrates a full suite of analytical tools into one seamless workflow: dynamic grid mapping, liquidity behavior analysis, ECM, trend lines, MIDAS, trade cycles, and directional channel projections. Together, these provide a unified view of market structure and momentum. Directional clarity is further enhanced by the capital flow index, which measures currency basket strength to identif
RelicusRoad Pro: 定量的市場オペレーティングシステム 【期間限定】無制限アクセス 70% OFF - 2,000人超のトレーダーと共に なぜ多くのトレーダーは「完璧な」インジケーターを使っても失敗するのでしょうか? それは、文脈を無視して 単一の概念 だけでトレードしているからです。文脈のないシグナルは単なるギャンブルです。勝ち続けるには、 根拠の重なり(コンフルエンス) が必要です。 RelicusRoad Proは単なる矢印インジケーターではありません。完全な 定量的市場エコシステム です。独自のボラティリティモデリングを用いて、価格が推移する「適正価値の道(Fair Value Road)」をマッピングし、ノイズと真の構造的ブレイクを判別します。 推測はやめましょう。機関投資家レベルの「ロード・ロジック」でトレードを。 コアエンジン:「Road」アルゴリズム システムの中心となる Road Algo は、市場環境にリアルタイムで適応するダイナミックなボラティリティチャネルです。 安全ライン(平衡点) と、価格が数学的に反転しやすい 拡張レベル を投影します。 Si
このインジケーターを購入すると、プロ仕様のトレードマネージャーを無料で差し上げます。 まず第一に、このトレーディングシステムがノンリペイント、ノンリドロー、ノンラグのインジケーターであることを強調する価値がある。これにより、手動取引とロボット取引の両方に理想的なものになっています。 オンラインコース、マニュアル、プリセットのダウンロード。 「スマートトレンドトレーディングシステム MT5」は、新規および経験豊富なトレーダー向けにカスタマイズされた包括的なトレーディングソリューションです。10以上のプレミアムインジケーターを組み合わせ、7つ以上の堅実なトレーディング戦略を備えており、多様な市場状況に対応する多目的な選択肢となっています。 トレンドフォロー戦略:トレンドを効果的に乗り越えるための正確なエントリーとストップロス管理を提供します。 リバーサル戦略:潜在的なトレンドの反転を特定し、トレーダーがレンジ相場を活用できるようにします。 スキャルピング戦略:高速で正確なデイトレードおよび短期取引のために設計されています。 安定性:すべてのインジケーターはノンリペイント、ノンリドロー、ノ
FX Trend NG:次世代マルチマーケット・トレンドインテリジェンス 概要 FX Trend NG は、複数の時間足に対応したプロフェッショナル向けトレンド分析およびマーケット監視ツールです。 市場全体の構造を数秒で把握することができます。 複数のチャートを切り替える必要はありません。どの銘柄がトレンド中なのか、どこでモメンタムが弱まっているのか、そしてどの時間足で強い整合性があるのかを瞬時に確認できます。 ローンチ特別オファー – FX Trend NG を $30(6ヶ月) または $80 永久ライセンス でご利用いただけます。 すでに Stein Investments のユーザーですか? -> メッセージを送信 して、プライベートグループへアクセスしてください。 セットアップや詳細情報が必要ですか? -> Stein Investments 公式ページ をご覧ください。 1. FX Trend NG が他と異なる理由 3ステート・トレンドロジック ― Buy と Sell だけではない • 多くのインジケーターは Buy または Sell の2状態のみを表示します。
Power Candles – あらゆる市場に対応した強度ベースのエントリーシグナル Power Candles は、Stein Investments が長年培ってきた強度分析を価格チャート上に直接反映します。価格だけに反応するのではなく、各ローソク足は実際の市場の強さに基づいて色分けされ、モメンタムの蓄積、強度の加速、明確なトレンド転換を瞬時に把握できます。 すべての市場に共通する単一ロジック Power Candles は すべての取引シンボル で自動的に動作します。現在のシンボルが Forex か非 Forex 市場かを自動判別し、内部で適切な強度モデルを適用します。 Forex および Gold :FX Power のデルタ値を使用(絶対値レンジ最大 100) 指数、暗号資産、CFD :IX Power の強度値を使用(絶対値レンジ最大 50) 必要な強度計算は Power Candles に直接組み込まれています。ローソク足のカラーリングやシグナルロジックに、追加のインジケーターは不要です。 価格ノイズではなく「強度状態」 各ローソク足は、以下の 9 つの明確に定義された強
あなたのシンボルでどの戦略が実際に機能するか確認しましょう - リアルマネーをリスクにさらす前に。 Power Barは、あらゆるシンボルとあらゆるタイムフレームで 極端な価格バー を検出し、3つの異なるトレード戦略を即座にバックテストします。勝率、プロフィットファクター、損益を並べて比較できます。すべてが1つのインタラクティブなパネルに集約されています。 推測なし。カーブフィッティングなし。データだけです。 Power Barが特別な理由 ほとんどのインジケーターはシグナルを出すだけで、それが機能するかどうかは推測に任されます。Power Barはさらに先を行きます - すべてのシグナルを 3つの戦略 に対してテストし、統計を表示します。FlipFlop、Momentum、Reversalをワンクリックで切り替え、数値が即座に変化するのを確認できます。 FlipFlop - 常にポジションを保有。シグナルでエントリーし、反対シグナルでイグジット。当社のリサーチでは、US30、US500、DAXなどのトレンドのあるインデックスで最も効果的です。 Momentum - シグナルの方向に
トレンド スクリーナー インジケーターでトレンド取引の力を解き放ちます。ファジー ロジックと複数通貨システムを活用した究極のトレンド取引ソリューションです。 ファジー ロジックを活用した革新的なトレンド インジケーターである Trend Screener を使用して、トレンド取引を向上させます。 これは、13 を超えるプレミアム ツールと機能、および 3 つの取引戦略を組み合わせた強力なトレンド追跡インジケーターであり、Metatrader をトレンド アナライザーにする多用途の選択肢となります。 期間限定オファー : トレンド スクリーナー インジケーターは、わずか 100 ドルで生涯ご利用いただけます。 (元の価格 50$ ) (オファー延長) Trend Screener の 100% 非再描画精度の揺るぎない精度を体験して、取引の決定が過去の価格変動の影響を受けないようにしてください。 マルチタイムフレームおよびマルチ通貨機能の多用途性を解放し、比類のない自信を持って外国為替、商品、暗号通貨、インデックスの世界を取引できるようにします。 Trend Screener の包括的な
まず第一に、この取引インジケーターは再描画されず、再描画されず、遅延しないことを強調する価値があります。これにより、手動取引とロボット取引の両方に理想的なものになります。 ユーザーマニュアル:設定、入力、戦略。 アトミックアナリストは、価格の強さとモメンタムを利用して市場でより良いエッジを見つけるためのPA価格アクションインジケーターです。ノイズや誤ったシグナルを除去し、取引ポテンシャルを高めるための高度なフィルターを備えています。複雑なインジケーターの複数のレイヤーを使用して、アトミックアナリストはチャートをスキャンし、複雑な数学的計算をシンプルなシグナルと色に変換します。これにより、どのような初心者トレーダーでも理解して使用し、一貫した取引の決定を行うことができます。 「アトミックアナリスト」は、新規および経験豊富なトレーダー向けにカスタマイズされた包括的な取引ソリューションです。プレミアムインジケーターとトップノッチの機能を1つの取引戦略に組み合わせ、すべてのタイプのトレーダーにとって汎用性のある選択肢にします。 デイリートレーディングとスキャルピング戦略:高速で正確なデイ
Currency Strength Dashboard Pro MetaTrader 5 用の リアルタイム通貨強度分析プロフェッショナルダッシュボード 。 このインジケーターは、 8つの主要通貨 (EUR、USD、GBP、JPY、CHF、AUD、CAD、NZD)の強さを計算し、 28の通貨ペア を同時に複数の時間足で分析・表示します。 ダッシュボードにより、トレーダーは 市場全体の状況を一目で把握 でき、余計な計算や複数のチャートを切り替える必要がありません。 計算方法 このインジケーターは、 高度な数学的通貨強度分析手法 に基づいています。 これは、類似インジケーターで一般的に使用されている RSIベースの手法 と比較して、より正確で客観的です。 この方法は 28の通貨ペアすべての相互関係を同時に分析 し、市場における実際の力関係をよりクリーンで偏りのない形で表示します。 リアルタイムダッシュボード メインテーブルには 8つの通貨 の完全なデータが表示されます。 Rank(順位) — 通貨の総合強度による順位。 1(最も強い)〜8(最も弱い) 。 Strength(強度) — 現在
[ My Products ] , [ My Channel ]   ,  [ LIVE SIGNAL ] HFT Spike Detector HFT Spike Detector は、高頻度取引(HFT)による急激な価格変動をリアルタイムで分析・測定するために開発されたプロフェッショナルなティック監視ツールです。 目的は、ブローカーによって引き起こされる異常なスリッページ、流動性のギャップ、ミリ秒単位の価格スパイクを数値データで検出できるようにすることです。 リアルタイムのティックフローと約定条件を分析するため、バックテストで正確に評価することはできません。 このEAは、自動化のために用意されたセットファイルと一緒に使用するために購入できます: VolumeHedger EA 動作原理 この Expert Advisor は、受信するすべてのティックをリアルタイムで分析し、以下を行います: 価格変動速度 1秒あたりのティック密度 スリッページの大きさ 同方向のマイクロフロー 測定し、チャート上のパネルに表示します。 これにより、スプレッドを除いた実際の執行品質を確認できま
Meridian Pro
Ottaviano De Cicco
5 (1)
Meridian Pro:MT5用プロフェッショナル・マルチタイムフレーム・トレンドマトリックス 概要 Meridian Pro は Merkava Labs が開発したマルチタイムフレーム・トレンドマトリックスで、方向性の状態、強度、モメンタムの状況、マトリックスの合意をひとつのコンパクトなパネルに集約します。ひとつのアダプティブエンジンがM1からW1まで一貫して適用されます。シンボルごとの調整は不要。インジケーターの積み重ねも不要。すべてのアセットとすべてのタイムフレームをカバーするひとつの構造化された読み取りです。 発売キャンペーン — Meridian Proを USD 99 (導入価格)で入手。通常価格:USD 149 。 1. Meridian Proが他と異なる理由 ひとつのエンジン、バラバラなインジケーターのダッシュボードではない 多くのMTFダッシュボードは、タイムフレームごとに生のインジケーター値を繰り返すだけです。Meridian Proはマトリックス全体でひとつのアダプティブ・トレンドエンジンを使用するため、パネルの各行が同じ構造化フレームワークから導出されます
FX Power: 通貨の強弱を分析して、より賢い取引を実現 概要 FX Power は主要通貨と金の実際の強弱をあらゆる市場状況で理解するための必須ツールです。強い通貨を買い、弱い通貨を売ることで、 FX Power は取引の意思決定を簡素化し、高い確率の取引機会を見出します。トレンドを追従する場合でも、極端なデルタ値を使用して反転を予測する場合でも、このツールはあなたの取引スタイルに完全に適応します。ただ取引するだけではなく、 FX Power で賢く取引をしましょう。 1. なぜ FX Power がトレーダーにとって非常に有益なのか 通貨と金のリアルタイム強弱分析 • FX Power は主要通貨と金の相対的な強弱を計算し、マーケットダイナミクスに関する明確な洞察を提供します。 • どの資産がリードしているか、または後れを取っているかを監視して、取引するペアを賢く選びましょう。 マルチタイムフレームの包括的なビュー • 短期、中期、長期のタイムフレームで通貨と金の強弱を追跡し、マーケットトレンドに基づいて取引戦略を調整できます。 • スキャルピングからスイングトレード
Quantum TrendPulse を ご紹介します。これは、   SuperTrend   、   RSI   、および Stochastic のパワーを 1 つの包括的なインジケーターに組み合わせて、取引の可能性を最大限に引き出す究極の取引ツールです。精度と効率を求めるトレーダー向けに設計されたこのインジケーターは、市場のトレンド、勢いの変化、最適なエントリー ポイントとエグジット ポイントを自信を持って特定するのに役立ちます。 主な特徴: SuperTrend 統合: 現在の市場動向に簡単に追従し、収益性の波に乗ることができます。 RSI精度: 買われすぎと売られすぎのレベルを検出し、市場の反転のタイミングに最適で、SuperTrendのフィルターとして使用されます。 確率的精度: 確率的振動を活用して、変動の激しい市場で隠れたチャンスを見つけます。SuperTrend のフィルターとして使用されます。 マルチタイムフレーム分析:   M5 から H1 または H4 まで、さまざまなタイムフレームで市場を常に把握します。 カスタマイズ可能なアラート: カスタム取引条件が満たされ
OmniSync Projection
Antonio-alin Teculescu
5 (1)
Chronos Fractal Engine is an innovative price projection indicator for MetaTrader 5, designed to transform your technical analysis by intelligently identifying and projecting historical price patterns. Built upon an advanced correlation algorithm and the fractal principles of the market, this powerful tool visualizes potential future price movements, giving you a unique edge in your trading decisions. What is Chronos Fractal Engine? At its core, the Chronos Fractal Engine employs a sophisticat
Gann Made Easy   は、ミスター・ギャンの理論を使用した取引の最良の原則に基づいた、プロフェッショナルで使いやすい外国為替取引システムです。 W・D・ガン。このインジケーターは、ストップロスとテイクプロフィットレベルを含む正確な買いと売りのシグナルを提供します。 PUSH通知を利用して外出先でも取引可能です。 ご購入後、取引方法の説明と優れた追加インジケーターを無料で入手するには、私にご連絡ください! おそらく、ギャンの取引手法についてはすでに何度も聞いたことがあるでしょう。通常、ギャンの理論は初心者のトレーダーだけでなく、すでにある程度の取引経験がある人にとっても非常に複雑なものです。なぜなら、ギャンの取引手法は理論的にはそれほど簡単に適用できるものではないからです。私はその知識を磨き、最良の原則を私の外国為替インジケーターに組み込むために数年を費やしました。 このインジケーターは非常に簡単に適用できます。必要なのは、それをチャートに添付し、簡単な取引推奨事項に従うだけです。このインジケーターは常に市場分析の仕事を行い、取引の機会を探します。適切なエントリーポイントを検
BTMM State Engine Pro is a MetaTrader 5 indicator for traders who use the Beat The Market Maker approach: Asian session context, kill zone timing, level progression, peak formation detection, and a multi-pair scanner from a single chart. It combines cycle state logic with a built-in scanner dashboard so you do not need the same tool on many charts at once. What it does Draws the Asian session range; session times can follow broker server offset or be set in inputs. Tracks level progression (L
ご紹介     Quantum Breakout PRO は 、ブレイクアウト ゾーンの取引方法を変革する画期的な MQL5 インジケーターです。 13年以上の取引経験を持つ経験豊富なトレーダーのチームによって開発されました。     クォンタム ブレイクアウト プロ   は、革新的でダイナミックなブレイクアウト ゾーン戦略により、あなたのトレーディングの旅を新たな高みに押し上げるように設計されています。 クォンタム ブレイクアウト インジケーターは、5 つの利益ターゲット ゾーンを備えたブレイクアウト ゾーン上のシグナル矢印と、ブレイクアウト ボックスに基づいたストップロスの提案を提供します。 初心者トレーダーにもプロのトレーダーにも適しています。 量子EAチャネル:       ここをクリック 重要!購入後、インストールマニュアルを受け取るためにプライベートメッセージを送ってください。 推奨事項: 時間枠: M15 通貨ペア: GBPJPY、EURJPY、USDJPY、NZDUSD、XAUUSD アカウントの種類: ECN、Raw、またはスプレッドが非常に低い R
優れたテクニカルインジケーター「Grabber」をご紹介します。これは、すぐに使える「オールインワン」トレーディング戦略として機能します。 ひとつのコードに、市場のテクニカル分析ツール、取引シグナル(矢印)、アラート機能、プッシュ通知が強力に統合されています。 このインジケーターを購入された方には、以下の特典を無料で提供します: Grabberユーティリティ:オープンポジションを自動で管理するツール ステップバイステップのビデオマニュアル:インジケーターのインストール、設定、取引方法を解説 カスタムセットファイル:インジケーターをすばやく自動設定し、最大限の成果を出すための設定ファイル 他の戦略はもう忘れてください!Grabberだけが、あなたを新たなトレードの高みへと導いてくれるのです。 Grabber戦略の主な特徴: 推奨タイムフレーム:M5〜H4 対応通貨ペア・資産:どれでも使用可能ですが、私が実際に検証した以下を推奨します(GBPUSD、GBPCAD、GBPCHF、AUDCAD、AUDUSD、AUDSGD、AUDCHF、NZDUSD、NZDCAD、EURCAD、EURUSD、E
ARICoin is a powerful trading companion designed to generate high-probability entry signals with dynamic TP/SL/DP levels based on volatility. Built-in performance tracking shows win/loss stats, PP1/PP2 hits, and success rates all updated live. Key Features: Buy/Sell signals with adaptive volatility bands Real-time TP/SL/DP levels based on ATR Built-in MA Filter with optional ATR/StdDev volatility Performance stats panel (Success, Profit/Loss, PP1/PP2) Alerts via popup, sound, push, or email Cust
Bill Williams Advanced is designed for automatic chart analysis using Bill Williams' "Profitunity" system. The indicator analyzes four timeframes at once. Manual (Be sure to read before purchasing) Advantages 1. Analyzes the chart using Bill Williams' "Profitunity" system. Signals are displayed in a table in the corner of the screen and on the price chart. 2. Finds all known AO and AC signals, as well as zone signals. Equipped with a trend filter based on the Alligator. 3. Finds "Divergence Bar
Smart Stop Indicator – チャート上で実現するインテリジェントなストップロス精度 概要 Smart Stop Indicator は、ストップロスを勘や感情ではなく、明確で体系的に設定したいトレーダーのために設計されています。本ツールは、クラシックなプライスアクション(高値更新・安値切り下げ)と最新のブレイクアウト認識ロジックを組み合わせ、次に来るべき論理的なストップレベルを正確に特定します。トレンド相場、レンジ、急速なブレイクアウト局面のいずれであっても、最適な SL ゾーンとその状態(“new”、“broken”、“valid”)をチャート上に直接表示します。さらに今回、SL 距離の %ADR 表示も新たに追加されています。 主な特徴 マーケット構造に基づく自動ストップ配置 • 市場構造とリアルタイムの値動きに基づき、意味のあるストップロスレベルを自動検出します。 スマートなブレイクアウト感知 • 急激な方向転換やブレイクアウトにも柔軟に対応し、早すぎるストップ調整を避けます。 SL %ADR の表示 • ストップロスまでの距離を ADR(Averag
Market Structure Order Block Dashboard MT5 は、 MT5(MetaTrader 5)用インジケーター です。 市場構造 と ICT / Smart Money Concepts に基づき、 HH/HL/LH/LL 、 BOS 、 ChoCH に加えて、 Order Blocks 、 Fair Value Gaps (FVG) 、 流動性 (EQH/EQL、sweeps)、 セッション / Kill Zones 、 Volume Profile を表示し、コンパクトなコンフルエンス・ダッシュボードを提供します。 重要: これは 分析ツール です。自動売買は行いません(EAではありません)。 購入者特典(ボーナス) 購入後、私のストアから 2つのボーナスインジケーター を(選択して)受け取ることができます。 ボーナスの受け取り方法: 1) 本商品のページに正直なレビューを投稿してください。 2) MQL5のメッセージで、 BONUS MSOB + 選んだ 2つのインジケーター名 を送ってください。 主な機能 市場構造: HH/HL/LH/LL
Crystal Heikin Ashi Signals - Professional Trend & Signal Detection Indicator Advanced Heikin Ashi Visualization with Intelligent Signal System for Manual & Automated Trading Final Price: $149 ---------> Price goes up $10 after every 10 sales . Limited slots available — act fast . Overview Crystal Heikin Ashi Signals is a professional-grade MetaTrader 5 indicator that combines pure Heikin Ashi candle visualization with an advanced momentum-shift detection system. Designed for both manual traders
このインジケーターは、反転ポイントと価格戻りゾーンを正確に表示します。     主要プレーヤー 。新たなトレンドが形成される場所を把握し、最大限の精度で意思決定を行い、すべての取引をコントロールします。 TREND LINES PRO インジケーターと組み合わせることで、その潜在能力を最大限に発揮します。 VERSION MT4 インジケーターが示す内容: 新しいトレンドの始まりに活性化する反転構造と反転レベル。 リスクと報酬の比率を最小限に抑えた利益 確定 と 損失停止の レベルの表示     RR 1:2   。 インテリジェントな削減ロジックによるストップロス。 指定されたインジケーターから 2 つのトレンド タイプの反転パターンを表示します。 指標: トレンドを追う   TREND LINES PRO   (世界的なトレンドの変化) TREND PRO   (クイックトレンド変更) シンプルで効果的   スキャナー   リアルタイムトレンド(新機能)。 マルチタイムフレームのインストゥルメント フィルタリング。 画面   利益     LOGIC AI信号の後。 当日プラス方
Market Structure Patterns
Samuel Manoel De Souza
4.47 (19)
Available for   MT4   and   MT5 . Join the Market Structure Patterns channel to download materials available for study and/or additional informations. Related posts: Market Structure Patterns - Introduction Beyond Fancy Order Blocks: Using True Volumetric Analysis with Market Structure Patterns & Timeless Charts Market Structure Patterns   is an indicator based on   smart money concepts   that displays   SMC/ICT   elements that can take your trading decisions to the next level. Take advantage
Gold Sniper Scalper Pro は、XAUUSD における ダマシブレイクアウト(false breakout)パターンの検出に特化した MetaTrader 5 用インジケーターです。価格がレンジの境界を突破してブレイクアウトトレーダーを誘い込み、その後反転してレンジ内に戻る4本バーのトラップ構造を識別します。インジケーターは各セットアップを17の品質要素で採点し、4層コンフルエンスパイプラインで評価し、7タイムフレームトレンドコンセンサスエンジンで検証し、ゴールドボラティリティレジーム分類器でフィルタリングします。すべてシグナルがチャートに表示される前に完了します。 詳細なユーザーガイドは、著者の   MQL5 ブログ   で入手できます。追加の更新は、著者の   MQL5 チャンネル   を通じて入手可能です。 現在のサポートポリシーに基づき、購入者は著者が開発した選定コンパニオンツールへの追加アクセスを受けることができます。 Forex通貨ペア、インデックス、暗号資産でも動作しますが、検出パラメーター、ボラティリティ処理、フィルターロジックはXAUUSD
作者のその他のプロダクト
MetaTrader 5 の秒チャート インジケーターを使用すると、MetaTrader 5 ターミナルで秒単位のタイムフレームのチャートを作成できます。このようなチャートのタイムフレームは、分単位や時間単位ではなく、秒単位で設定されます。したがって、M1 未満のタイムフレームのチャートを作成できます。たとえば、S15 は 15 秒の期間のタイムフレームです。結果のチャートにインジケーター、エキスパート アドバイザー、スクリプトを適用できます。 通常のチャートと同じように操作できる、完全に機能するチャートが得られます。 秒単位のタイムフレームは、既存のティック データベースにより、リアルタイムだけでなく履歴に基づいて構築されます。したがって、履歴がすでに蓄積されている秒単位のタイムフレームをいつでも開くことができます。 同時に、データは遅延なく基本チャートと同期して更新されます。 タイムフレームは秒単位で選択できます: S1、S2、S3、S4、S5、S6、S10、S12、S15、S20、S30。 また、任意の値を設定することもできます。 注: このインジケーターをインス
Basing Candles
Abdelkhabir Yassine Alaoui
4 (1)
Basing Candles indicator is an automatic indicator that detects and marks basing candles on the chart. A basing candle is a candle with body length less than 50% of its high-low range. A basing candle or basing candlestick is a trading indicator whose body length is less than half of its range between the highs and lows. That's less than 50% of its range. The indicator highlights the basing candles using custom candles directly in the main chart of the platform. The percentage criterion can be
FREE
Spread Actual
Abdelkhabir Yassine Alaoui
5 (1)
This indicator Displays current spread in the main window of the chart. You can modify the font parameters, indicator's position and the normalization of the spread value. The spread is redrawn after each tick, ensuring the most current and active spread value. This can be useful for brokers with variable spreads or with spreads that are widened often. You can also enable a spread label to be shown near the current Bid line. you can also set  alert : Email, and push notifications.
FREE
Usdjpy Hunter
Abdelkhabir Yassine Alaoui
This is a classic trading strategy based on two Moving Averages crossover. customized for usdjpy with a Good risk management strategy RR 1/2 . (    Long when fast MA crosses slow MA from below and Short when fast MA crosses slow MA from above ) TF : 5MIN MAX Lot size to use : 2% e.g : Balance =100 => lot size = 0.02 Balance =1000 => lot size = 0.20 Balance =10000 => lot size = 2 ------
FREE
MT5のアラート付きの自動固定範囲ボリュームプロファイル この指標は、価格がより多くの時間を費やした場所を示し、取引に使用できる重要なレベルを強調しています。 また、特定の取引セッションの最も重要な価格レベル、バリュー エリア、およびコントロール バリューの概要を示す、経時的な価格密度を示すことができます。 このインジケーターは、M1 と D1 の間の時間枠に添付でき、日次、週次、月次、さらには日中のセッションの市場プロファイルを表示します。 時間枠が短いほど、精度が高くなります。 可視性を高めるには、より長い時間枠をお勧めします。 フリードローの長方形セッションを使用して、任意の時間枠でカスタム マーケット プロファイルを作成することもできます。 プロファイルのブロックを描画するために、6 つの異なる配色を使用できます。 プロファイルを単色ヒストグラムとして描画することも可能です。 または、強気/弱気バーに基づいてプロファイルを色付けすることもできます。 このインディケータは裸の価格アクションに基づいており、標準的なインディケータは使用しません。 バリュー エリアの高値と安値
Volume Profile is a very useful indicator . it allows you to spot the price levels where important price action took place. It is similar to support and resistance levels but with a different logic. ( Check Out  Fixed Range Volume Profile MT5  ) One of the first thing that traders mark up when analyzing a chart is support and resistance. Volume Profile can be used for doing that too. The indicator scans the defined number of previous bars and calculates the volume of activity at each price le
DXY Correlation
Abdelkhabir Yassine Alaoui
Indicator  can be used for dxy correlation trading. it calculates the dollar index (USDX or DXY) using the EUR/USD, USD/JPY, GBP/USD, USD/CAD, USD/CHF and USD/SEK currency pairs. In order to trade them, you need to find a confirmed technical analysis pattern on the DXY chart and look for a correlated currency pair that has the same picture on its price chart. The formula used for calculation is the following: USDX = 50.14348112 × EURUSD -0.576   × USDJPY 0.136   × GBPUSD -0.119   × USDCAD 0.091
Best Pivot Point Indicator  display   pivot points   and   support and resistance   lines for the intraday trading. It calculates them using its own formula based on the previous trading session The indicator can display the following levels in addition to plain pivot points: Previous session's High and Low, today's Open. Sweet spots. Fibonacci levels. Camarilla pivots. Midpoint pivots.
Support And Resistance indicator that can display round levels and zones . It shows them directly on the chart, providing an easy help when you want to set stop-loss or take-profit level, or when you want to see the next market target.   If an asset price is moving down and bounces back up, the level is called support (think: price floor). If an asset price is moving upward and hits a level where it reverses downward, this is called resistance (think: price ceiling).
The Candle Remaining Closing Time indicator displays the amount of time left before the current candlestick closes on your chart. This tool is essential for traders who rely on precise timing to enter or exit trades, especially in fast-moving markets. By showing a real-time countdown, it helps you stay aware of upcoming candle completions across any timeframe—from 1-minute to daily charts. Whether you're a scalper watching minute-by-minute action or a swing trader timing key setups on higher tim
フィルタ:
レビューなし
レビューに返信