KT Chop Zone MT5
- インディケータ
- バージョン: 1.0

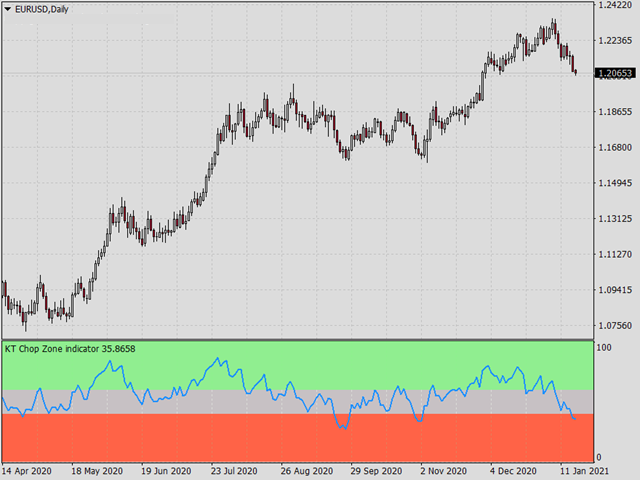
金融市場の多くは、全体の約30%の時間だけトレンドを形成し、残りの約70%はレンジ相場で推移していることはよく知られています。しかし、初心者トレーダーにとっては、市場が現在トレンド中なのか、それともレンジ内で動いているのかを見極めるのは簡単ではありません。
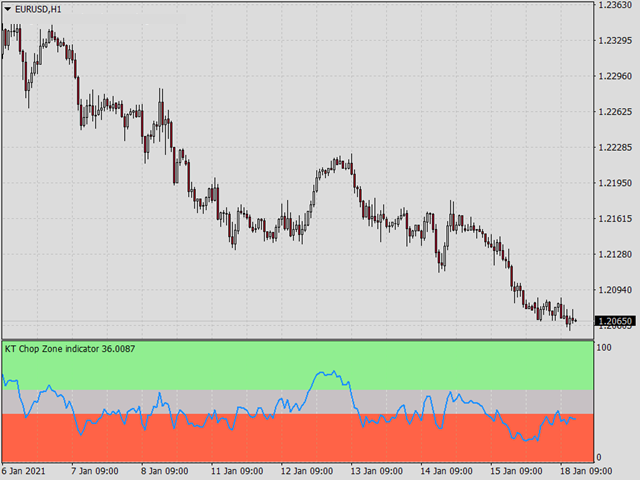
KT Chop Zone はこの課題を解決し、市場のフェーズを明確に3つのゾーン(下降ゾーン、上昇ゾーン、そしてレンジゾーン=Chop Zone)に分けて表示することで、相場環境を視覚的に判断しやすくします。
機能
- レンジ相場(Chop Zone)での取引を避けることで、トレードの精度を即座に向上させます。
- 利確や手仕舞いの目安としても使用できます。たとえば、ポジションがChop Zoneに入った際に決済することができます。
- Expert Advisor(EA)との完全な互換性あり。EAに簡単に組み込んで戦略の強化が可能です。
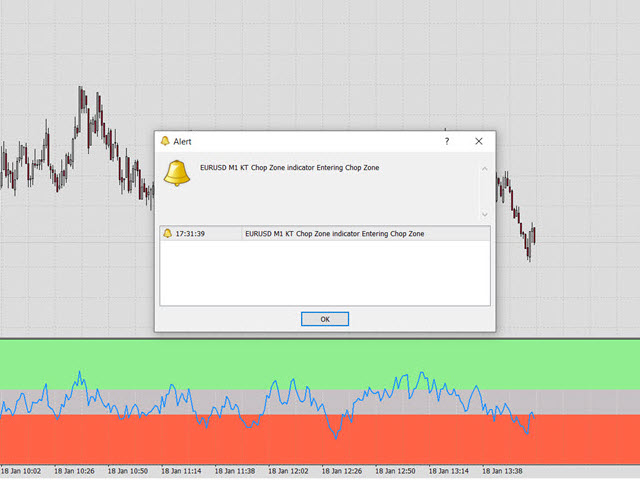
- すべてのMetaTraderアラートに対応しています。
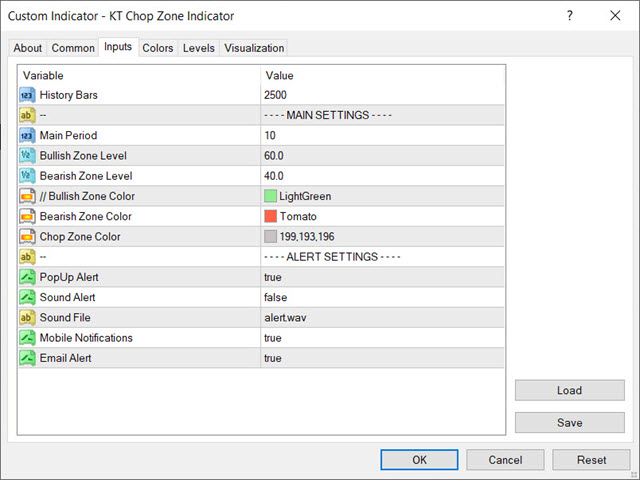
インプットパラメーター
- メイン期間: オシレーターに使われる整数値。推奨値は10〜30です。
- 上昇ゾーンのレベル: 上昇ゾーンの判定に使う数値を設定します。
- 下降ゾーンのレベル: 下降ゾーンの判定に使う数値を設定します。
- 色の設定
- アラートの設定
ユーザーは評価に対して何もコメントを残しませんでした