KT Chop Zone MT5
- Göstergeler
- Sürüm: 1.0
- Etkinleştirmeler: 10

Finansal piyasalarda zamanın yalnızca %30’u trend hareketlerle geçerken, geri kalan %70’i yatay yani belirli bir aralıkta dalgalanarak geçer. Ancak, çoğu yeni başlayan yatırımcı için piyasanın gerçekten bir trend içinde mi yoksa yatay bir aralıkta mı hareket ettiğini anlamak oldukça zordur.
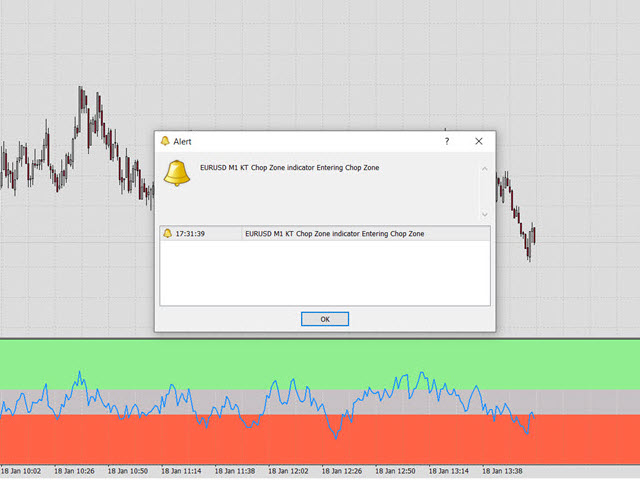
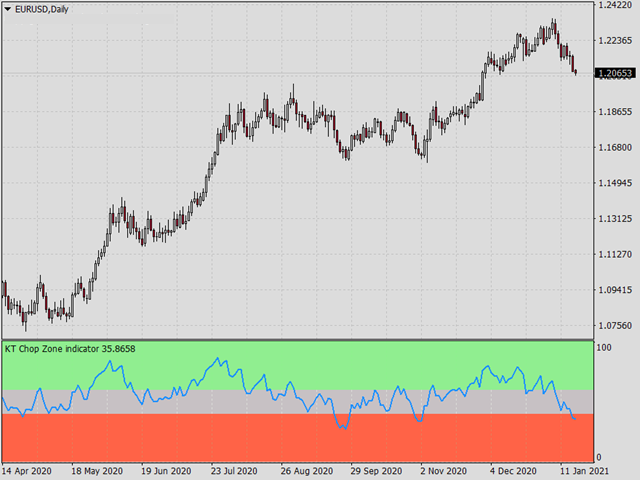
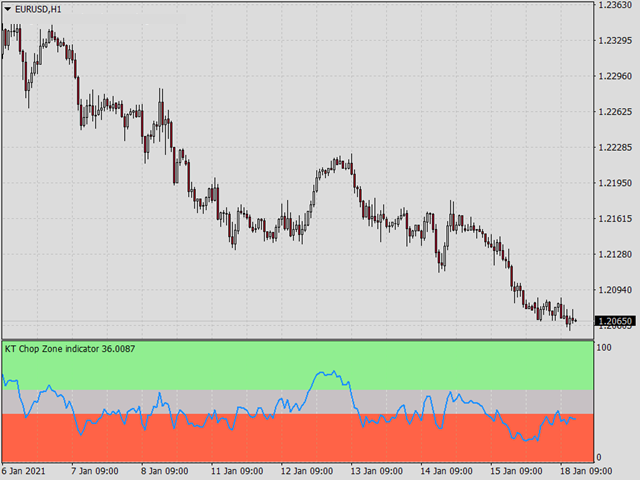
KT Chop Zone bu sorunu çözmek için geliştirilmiştir. Piyasa durumunu açıkça üç bölgeye ayırarak gösterir: Ayı Bölgesi, Boğa Bölgesi ve Chop Zone (Yatay Bölge).
Özellikler
- Yatay piyasalarda işlem yapmaktan kaçınarak ticaret performansınızı anında geliştirin.
- Çıkış sinyalleri için de kullanılabilir. Örneğin, fiyat Chop Zone’a girdiğinde uzun pozisyonunuzu kapatabilirsiniz.
- Uzman Danışmanlar (EA) ile tamamen uyumludur. Bu göstergeleri EA’nıza kolayca entegre edebilirsiniz.
- Tüm MetaTrader uyarı türleri dahildir.
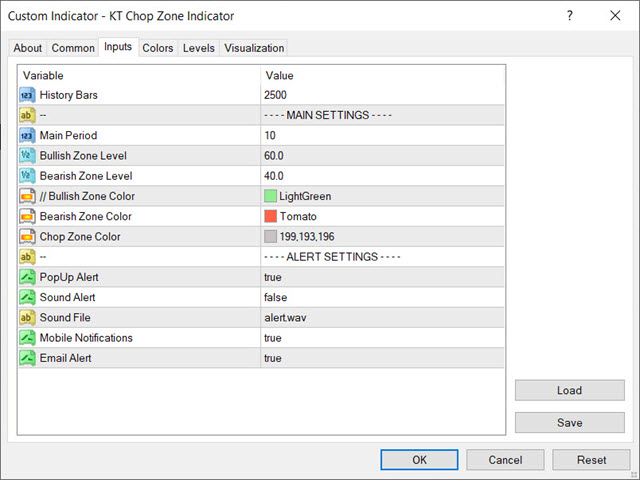
Giriş Parametreleri
- Ana Periyot: Osilatör için bir tam sayı değeri. 10 ile 30 arasında bir değer önerilir.
- Boğa Bölgesi Seviyesi: Boğa bölgesini tanımlamak için kullanılacak seviye.
- Ayı Bölgesi Seviyesi: Ayı bölgesini tanımlamak için kullanılacak seviye.
- Renk Ayarları
- Uyarı Ayarları
Kullanıcı değerlendirmeye herhangi bir yorum bırakmadı