KT MA Crossover MT5
- インディケータ
- バージョン: 1.5
- アップデート済み: 26 3月 2022

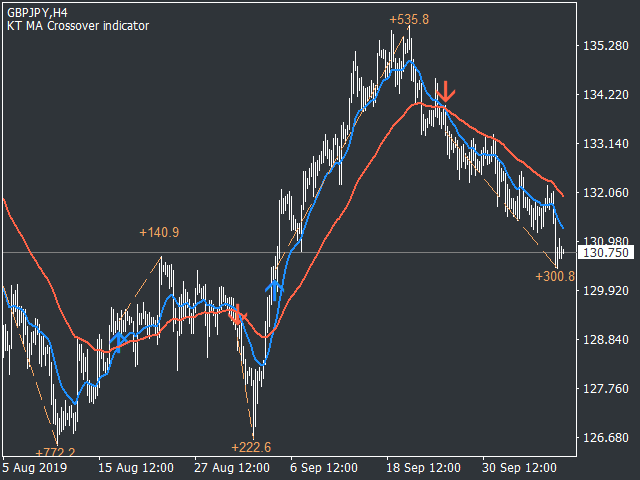
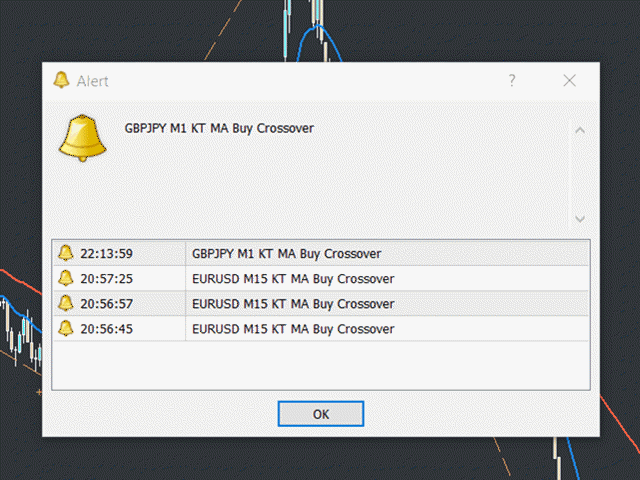
KT MA Crossover は、選択した移動平均線のクロスに基づいて買いと売りの矢印をチャートに描画します。さらに、各シグナルに対して適切なアラートを生成し、MFE(最も有利な価格変動)も表示します。これにより、トレーダーは過去のシグナルのパフォーマンスをより深く理解できます。
移動平均のクロスオーバーは、世界中のトレーダーがよく使う基本的な戦略の1つです。一般的には、速い移動平均と遅い移動平均を組み合わせて、その交差の方向によって買いまたは売りのエントリーシグナルを判断します。
- 買いシグナル:速いMAが遅いMAを上から下にクロスしたとき。
- 売りシグナル:速いMAが遅いMAを下から上にクロスしたとき。
特徴
- 各移動平均の設定は完全にカスタマイズ可能です。
- 各シグナルに対して MFE の値を表示します。
- 軽量に設計され、動作が非常にスムーズです。
- すべてのMetaTraderアラート機能に対応しています。
デメリット
移動平均は過去のデータに基づくため、遅行性のある指標です。特にレンジ相場では、移動平均のクロスがランダムに見える場合があり、多くのダマしシグナルを発生させる可能性があります。正しく活用するには、トレーダーの裁量判断が必要です。
入力パラメーター
- ヒストリーバー数: シグナルの計算に使う過去バーの数。
- ----- 速い・遅い移動平均を計算するための期間と方法を選択 -----
- 移動平均の表示: チャート上に移動平均を表示/非表示(クロスシグナルは影響なし)。
- 利益ラインの表示: MFEラインを表示/非表示。
- アラート設定: わかりやすいシンプルな設定