Hammer Star
- インディケータ
- バージョン: 1.1
- アップデート済み: 9 9月 2025

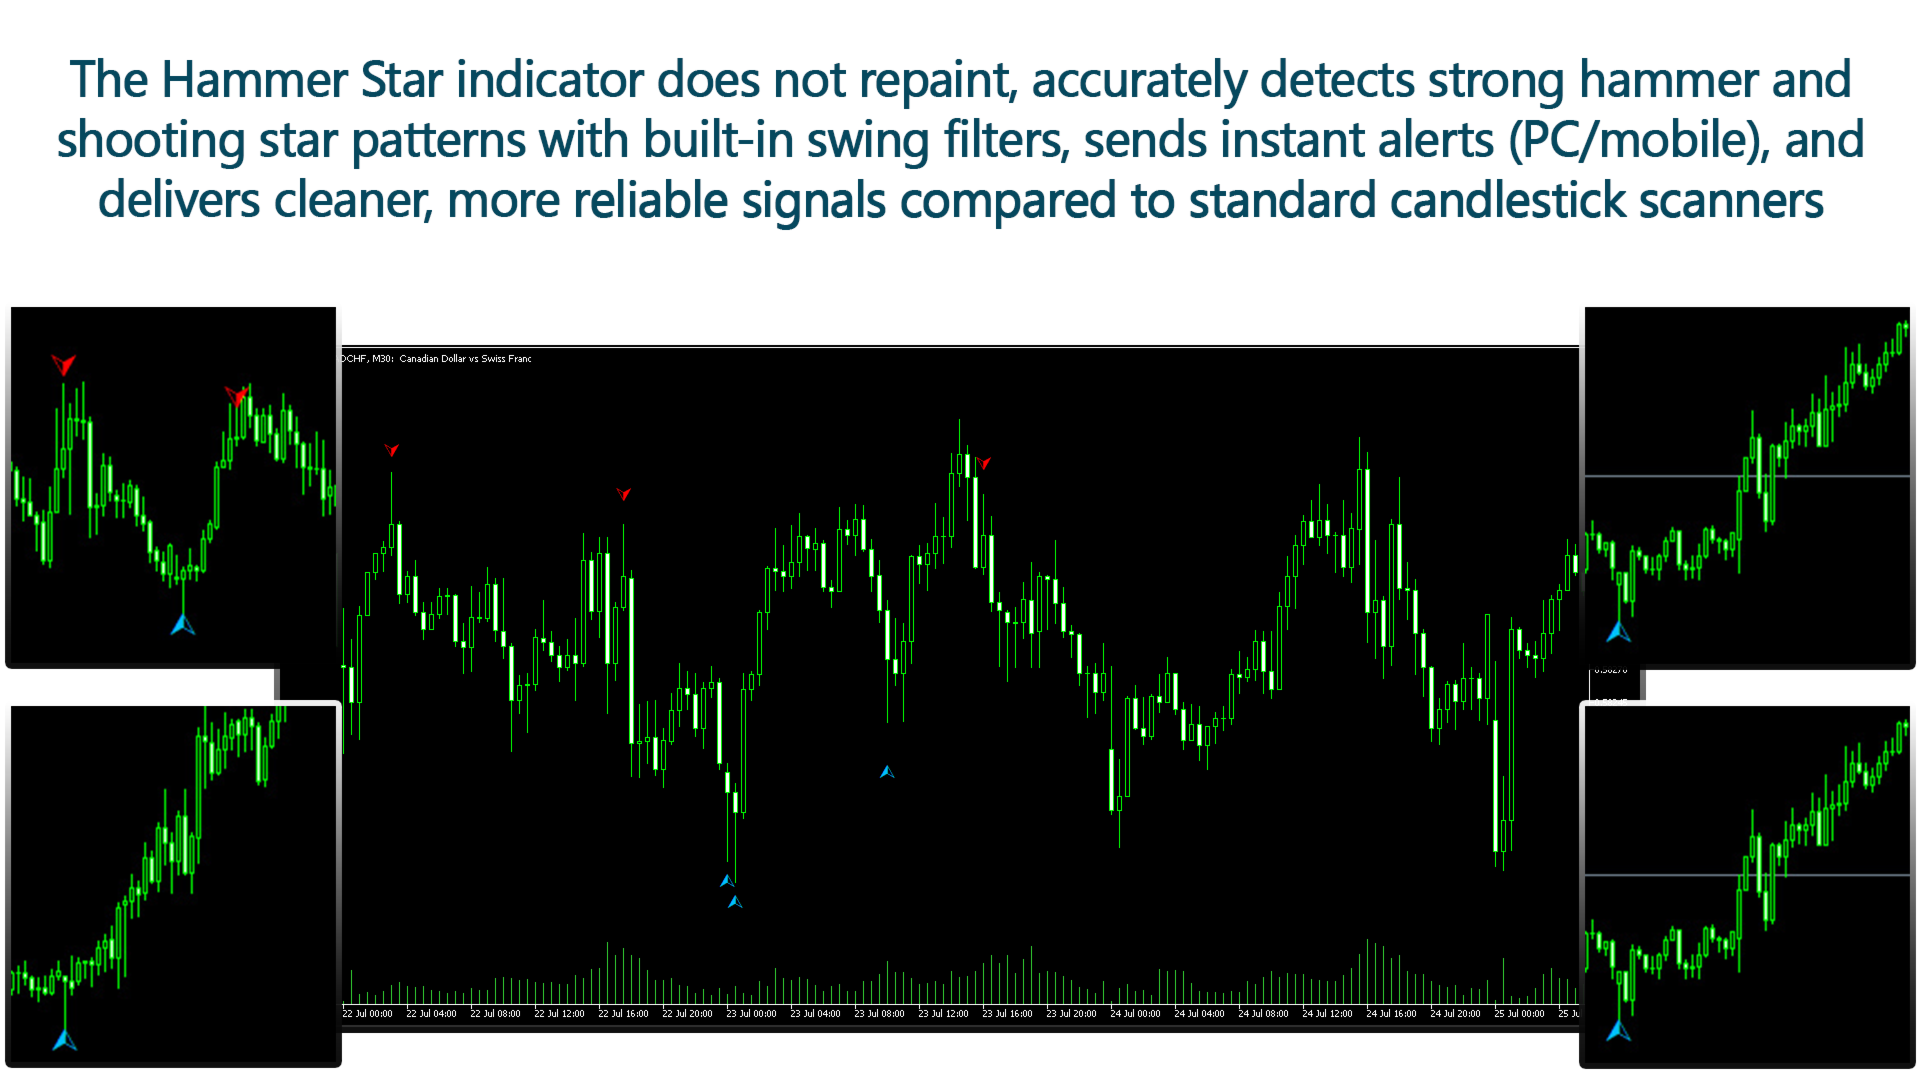
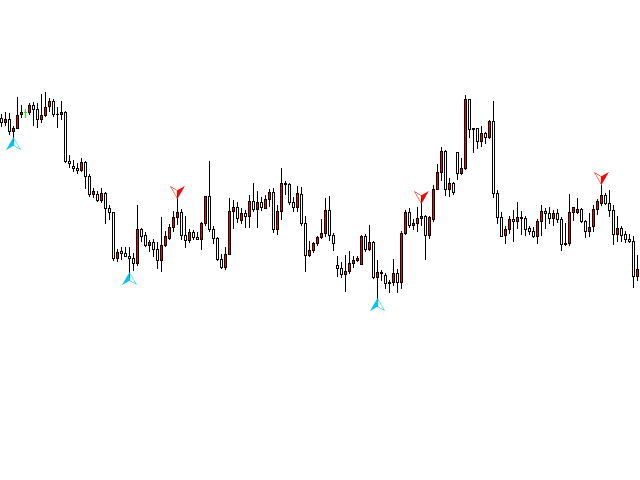
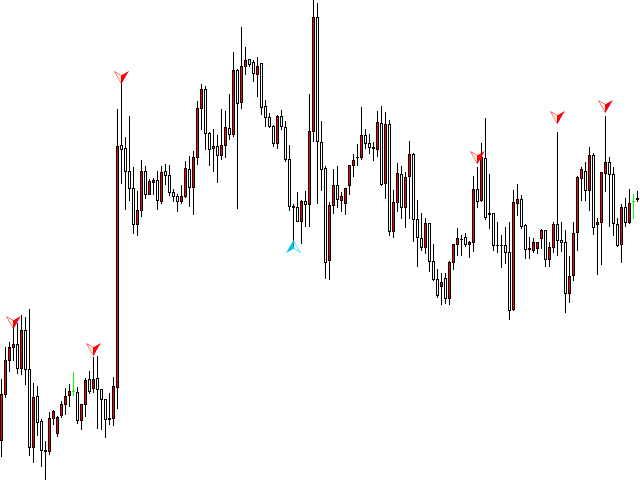
MT5 ハンマー&スター・バー形成インジケーター
この強力な MT5 インジケーターは、チャート上で ハンマー(Hammer) と スター・バー(Star Bar) の重要な反転パターンを素早く特定できるツールです。市場の方向性に関係なく、トレンド転換のチャンスを逃さずキャッチできます。
主な機能と利点:
-
高値/安値の検出:現在のローソク足を過去 X 本と比較し、信号の正確性を確保
-
ヒゲとローソク本体の比率調整:トップ/ボトムのヒゲは本体の X 倍以上で、ノイズを排除
-
逆ヒゲ確認:反対側のヒゲが信号ヒゲの X 倍以上で、取引信頼度を向上
-
通知機能:プッシュ通知やチャート上のコメントで重要なシグナルを見逃さない
-
推奨時間足:H4 以上の長めの時間枠で安定したシグナルを提供
-
すべてのトレーダー向け:初心者は簡単に使用可能、上級者は戦略に合わせてカスタマイズ可能
-
再描画なし:一度表示されたシグナルは固定、信頼できる分析をサポート
このインジケーターを使用することで、市場の反転ポイントを事前に把握し、最適なエントリーとエグジットを設定できます。デイトレードからスイングトレードまで、幅広い戦略で活用可能。
今すぐ MT5 ハンマー&スター・バーインジケーターを入手して、取引の精度と効率を大幅にアップさせましょう