Multi TF Charts
- インディケータ
- バージョン: 1.21
- アップデート済み: 15 6月 2021
- アクティベーション: 5

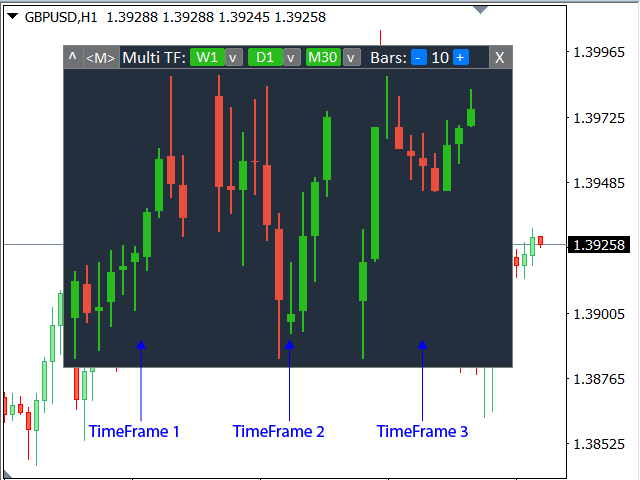
他の時間枠の最大3つの追加チャートを分析,メインのチャートを切り替えずに。
多機能ユーティリティ: 66以上の機能を含むこのツール | 質問があれば私に連絡してください | MT5バージョン
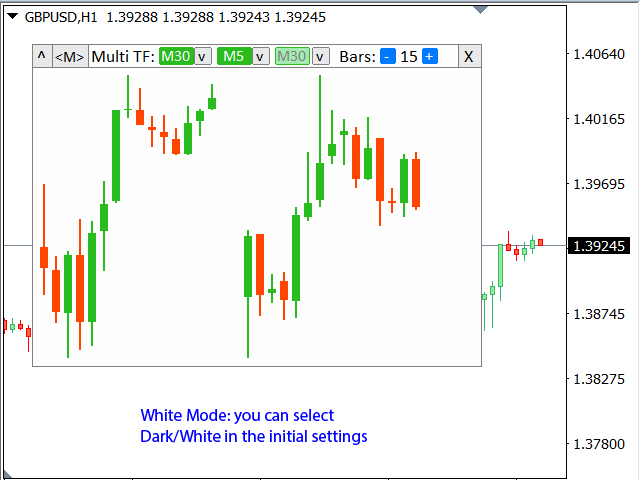
インジケーターは 別ウィンドウで開きます:
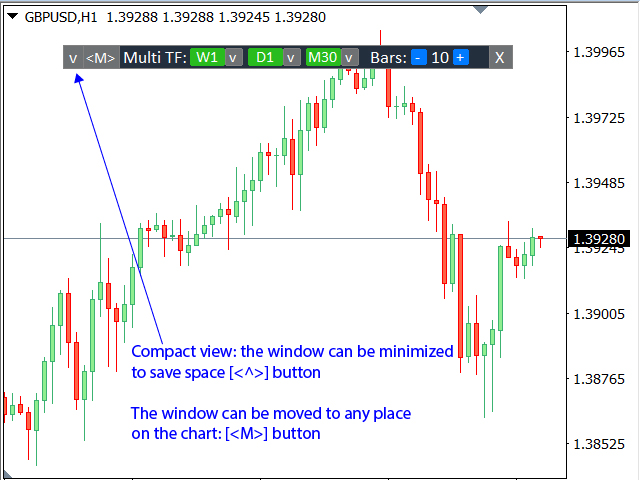
- ウィンドウは 移動可能 で、チャートの任意の場所に配置できます([<M>] ボタンを使用)。
- ウィンドウはスペースを節約するために最小化することもできます ([<^>] ボタン)
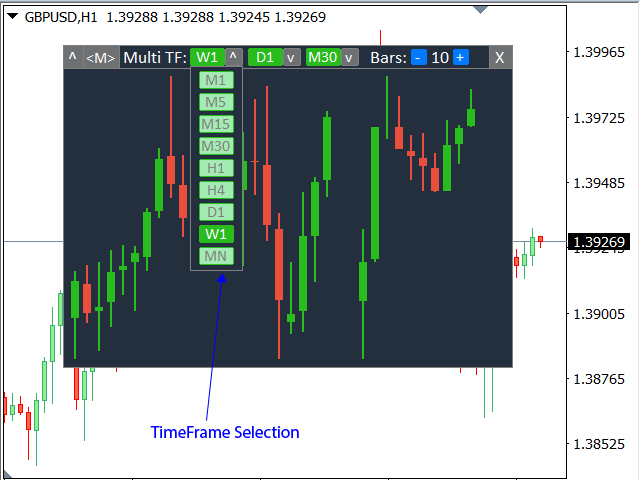
表示されるウィンドウで、次の設定が可能です:
- 1番目のチャート の期間(左側);
- 2番目のチャート の期間(中央);
- 3番目のチャート の期間(右側);
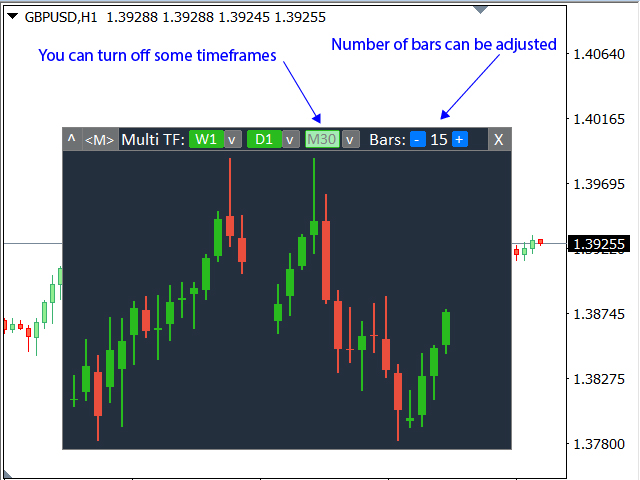
(各時間枠は無効化可能); - 各時間枠の バーの数 。
最大バーの数:
a) 3つのアクティブチャート:30;
b) 2つのアクティブチャート:45;
c) 1つのアクティブチャート:90;