XX Power

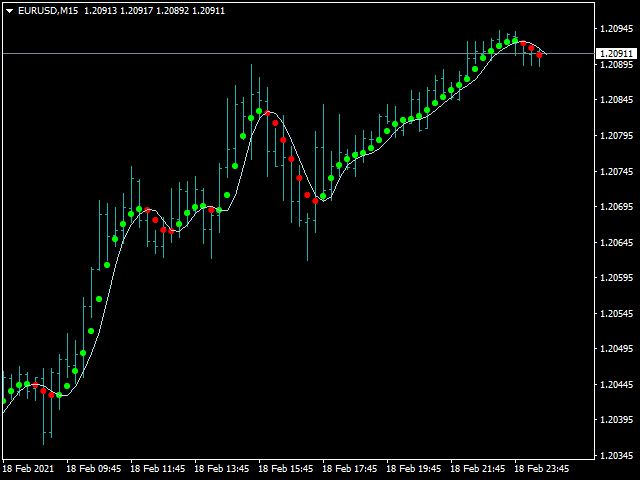
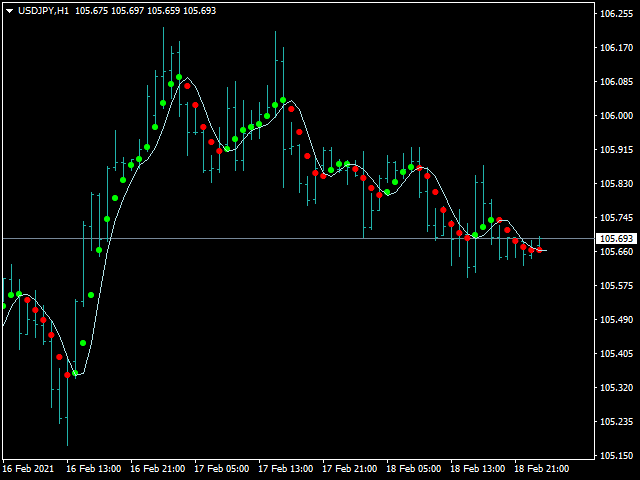
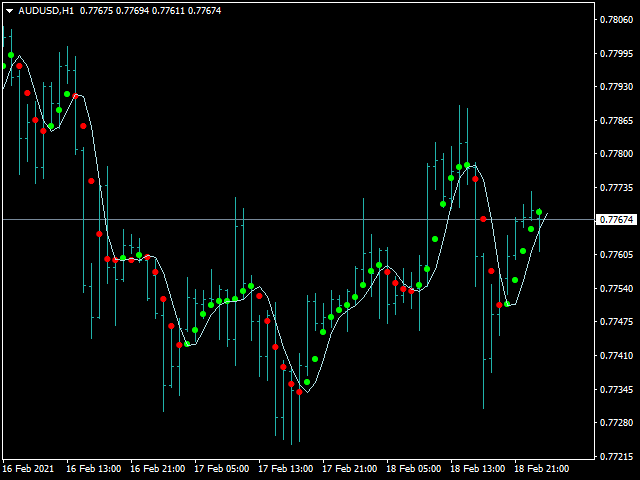
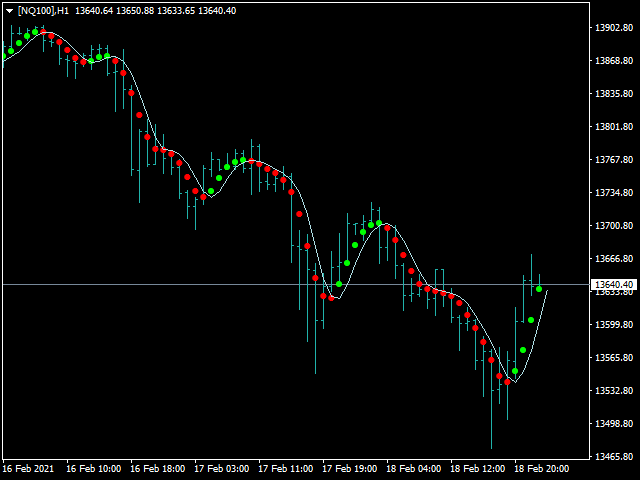
This indicator XX Power indicator.Indicator displays trend movement.Indicator helps to buy and sell.Indicator displays arrow and line.

Features

  • FiltPer - displays indicator period.

How to understand the status:

  •  If the Trend color is green, trend is up.
  • If the Trend color is red, trend is down.


   ////////////////////////////////////////////////////////////////////////////////////////////////////////////////////////////////////////////////////

//////////////////////////////////////////////////////////////////////////////////////////////////////////////////////////////////////////////////////

//////////////////////////////////////////////////////////////////////////////////////////////////////////////////////////////////////////////////////

//////////////////////////////////////////////////////////////////////////////////////////////////////////////////////////////////////////////////////

//////////////////////////////////////////////////////////////////////////////////////////////////////////////////////////////////////////////////////

//////////////////////////////////////////////////////////////////////////////////////////////////////////////////////////////////////////////////////

//////////////////////////////////////////////////////////////////////////////////////////////////////////////////////////////////////////////////////

//////////////////////////////////////////////////////////////////////////////////////////////////////////////////////////////////////////////////////

//////////////////////////////////////////////////////////////////////////////////////////////////////////////////////////////////////////////////////

//////////////////////////////////////////////////////////////////////////////////////////////////////////////////////////////////////////////////////

//////////////////////////////////////////////////////////////////////////////////////////////////////////////////////////////////////////////////////

//////////////////////////////////////////////////////////////////////////////////////////////////////////////////////////////////////////////////////

//////////////////////////////////////////////////////////////////////////////////////////////////////////////////////////////////////////////////////

/////////////////////////////////////////////////////////////////////////////////////////////////////////////////////////////////////////////////////

/////////////////////////////////////////////////////////////////////////////////////////////////////////////////////////////////////////////////////

/////////////////////////////////////////////////////////////////////////////////////////////////////////////////////////////////////////////////////

////////////////////////////////////////////////////////////////////////////////////////////////////////////////////////////////////////////////////

////////////////////////////////////////////////////////////////////////////////////////////////////////////////////////////////////////////////////


おすすめのプロダクト
FOREX FLIP ALERT   - Show where the price will reverse with more than 95% probability. This information will help every trader to effectively open trades. The indicator on the chart draws arrows in which place and in which direction the price will reverse. The indicator   does not redraw  its arrows and shows price reversals for medium and long distances. This means that after the arrow appears, the price will go in the indicated direction for many points. Benefits of the indicator: Gives sign
The Trend Professor is a moving average based indicator designed for the purpose of helping the community of traders to analyse the price trend. The indicator will be displayed in the main chart as it is indicated on the screenshot section. How it works The indicator has lines of moving averages and colored histograms to depict the direction of the trend. There will be a fast signal line colored blue/yellow/red at some points. The red/yellow colored lines stands for bearish trend/signal while th
Introducing Trend Zones: Your Ultimate Tool for Precise Market Entry and Exit Points. Trend Zones is a revolutionary MetaTrader 4 indicator designed to provide traders with clear buy and sell zones based on trend reversals and price action. Built upon advanced algorithms and non-repainting technology, this indicator offers unparalleled accuracy in identifying optimal entry and exit points in the forex market. Key Features: 1. Non-Repainting Signals: Trend Zones delivers non-repainting signals,
Market Profile with Dashboard Indicator - Complete User Guide indicator Overview The Market Profile with Dashboard is a comprehensive trading analysis tool for MetaTrader 4 that displays market profile data, volume analysis, and key market structure information directly on your chart. This indicator helps traders identify significant price levels, market balance areas, and potential trading opportunities based on market profile theory. Core Components and Features Market Profile Display - Sh
トレンドキャンドル — 瞬時にトレンドを読み取れるインジケーター トレンドキャンドルインジケーターは、チャート上のローソク足の色を自動的に表示し、複雑な分析を視覚的に分かりやすく表示します。市場の強さと方向性を瞬時に判断できます。上昇トレンドは緑、下降トレンドは赤、中立局面は灰色で表示されます。このツールは2つの適応型フィルターを同期させることで、不要なノイズを排除し、明確なシグナルを提供します。 主なメリット 瞬時にトレンドを可視化:市場の方向性を一目で把握できます。 非再描画アルゴリズム:シグナルはローソク足の終値で固定され、その後は変更されません。これにより、過去のデータに基づいた正確な分析と信頼性の高い取引が可能になります。 デュアルシグナルフィルタリング:高速フィルターと低速フィルターが連携し、誤った動きをフィルタリングし、質の高いトレンド状況を浮き彫りにします。 充実したアラート:トレンド反転の通知は、ポップアップウィンドウ、モバイル端末へのプッシュ通知、メール、またはサウンドアラートで受信できます。 汎用性:このインジケーターは、あらゆる金融商品と時間枠で
Final neutral bottom pro
Saqr Mohammad Yousef Almasarweh
The Final Neutral Bottom indicator by saqr studio is a powerful technical analysis tool designed for MetaTrader 4 (MT4). It meticulously analyzes price action within a recent range to identify strong momentum shifts, providing clear, actionable trading signals with pre-calculated risk management zones. Core Features Momentum Analysis Box: The indicator automatically draws a box around a user-defined number of recent candles to establish the current trading range (high and low). Clear Buy/Sell S
XABCD (Harmonic Pattern) Ratio Labeler – Simple, Visual Pattern Validation Tool This tool was designed for traders who work with harmonic or XABCD patterns and want a fast, flexible way to manually validate them on their chart. How It Works: Click a button to place 5 editable labels (X, A, B, C, D) directly on your chart. Drag them to your desired swing points. The tool automatically draws the connecting legs (XA, AB, BC, CD, etc.) and calculates key Fibonacci ratios: AB / XA BC / AB AD / XA
Stop chasing the market. The Follow Line Indicator provides clear, high-probability signals right on your chart. This advanced tool features a Dynamic Trend Line that instantly adapts to market structure. It’s your immediate visual reference: Blue means you're in an uptrend, and Red signals a downtrend. The core function tracks price extremes and volatility to define the true trend strength. The best part is the automatic signal generation: Buy Arrow: Appears when the trend line flips from Red t
!! FLASH SALE !!   Over 80% off !!     For ONE week only. Now only $47 - normally $297! >>>      Ends on 30 June 2023 - Don't miss it! Buy And Sell Signal Arrows On The Chart When The Price Is About To Reverse. Also Sends Alerts – On MT4 To Your Phone To Your Email. Does not repaint. Works on any pair, any timeframe.   (Just ajust the settings for your pair and timeframe.) 10 Activations allowed so you are free from limitations MT5 version here .   Spreads from 0.1pip RAW/ECN Accounts,  
これは、トレンドしひょー指標は、あか赤とみどり緑のじっせん実線をはんえー反映して、しじょー市場かかく価格のへんか変化をはんえー反映して、じっせん実線のいろ色のへんか変化は、しじょー市場のへんか変化がはっせー発生しているかのー可能せー性がひじ ょー非常にたかい高いです!   みどり緑のせん線はしじょー市場かかく価格がうえ上ます升しているきかん期間をしめし示し、あか赤のせん線はしじょー市場かかく価格がげらく下落しているきかん期間をしめし示します。 この メトリクス を より よく   しよー 使用 する ため に 、 この メトリクス を   こーにゅー 購入 し て   しよー 使用 する   まえ 前 に 、 この メトリクス の   むりょー 無料 デモ   ばん 版 を ダウンロード し て テスト する こと を お   すすめ 勧め し ます
Candles Size ( Points ) Please leave a review about this product to help other users benefit from it. This simple tool provides crucial insights into current and historical market conditions, helping traders make informed decisions. Identify the longest candlestick over a customizable historical period. This information helps you spot significant price movements. See on YOUTUBE for key features This indicator is compatible with MetaTrader 4 The indicator   is easy to install and use, making it
FREE
Candle close countdown indicator. Almost all indicators work by ticks and therefore stop counting when the price stops in moments of little volatility. This indicator does not stop and remains synchronized with the broker's clock. It also has other functions that can help the trader. All features are configurable and you can choose if you want to use it or not: - Volume control:                         the counter changes color when the current candle has a higher volume of contracts than the pr
Fast flat
Dimitri Nepomniachtchi
The Fast flat indicator can recognize and notify you of short flats after the price rises or falls. Where the price can rush further or reverse. ++ The indicator is open to arbitrary flat settings. You will probably have to conduct quite a few tests, approaching the best results. I will be very grateful if you share in the comments your tests, parameters and advice to other users, who may also be able to improve your results. Should I use it for entry signals, order stops, hedging...? - The indi
The Ultimate Dashboard New Year Sale - save $20 (normal price $79) Indicators are useful for traders, but when you put them into a dashboard that can scan 28 symbols at once they become even better, and when you can also combine different indicators and timeframes to give you synchronized alerts, then they become awesome. This easy to use dashboard provides you with 23 leading indicators, use them individually or together, to create powerful combination alerts. So when you want to know that RS
REMINDER: Early buyers hot price discount: Price subject to rise after first 20 copies. Starting price $65 and final price will be $1275. Secure your discounted copy Now! Smart Money Analyser Indicator User Manual 1. Introduction Welcome to the   Smart Money Analyser Indicator This powerful tool provides traders with comprehensive market analysis by combining various technical indicators to generate actionable trading signals. Designed to be user-friendly, this indicator helps traders of all
The Trend Rever indicator uses two lines of different colors to display buy or sell signals. The first of these lines is red and the second is blue. When changing the color of the lines, an arrow is also displayed, which indicates which deal to open, buy or sell. A simple but effective system for determining the Forex trend. The algorithm takes into account the measurement of prices, and this method also focuses on the measurement of each of the price drops - which gives more detailed informati
Horizontal volume bars, Cluster analysis, Volume profile Volume in Range gets information about the accumulated volume in a specified vertical range and period in bars. The received data is then plotted on the chart as rectangular boxes with the volume quantity inside. Usage:- The tool acts as a support resistance levels but most importantly it should be used to check in which direction the price breaks out of the significant levels formed by this indicator and then actions to be taken on correc
This powerful indicator intercepts 21 patterns simultaneously on 28 Pairs and on all timeframes. Just put the indicator on a single chart to see all patterns that appear on all pairs in all timeframes The patterns found are: For Bearish: Bearish Abandoned Baby; Bearish Engulfing; Bearish Harami; Bear Kicker; Dark Cloud Cover; Evening Doji Star; Evening Star; Shooting Star; Three Black Crows; Three Inside Down; Three Outside Down; For Bullish: Bullish Abandoned Baby; Bullish Engulfing; Bullish Ha
The Trend Analysis Indicator is an innovative tool designed for traders and investors who seek to navigate the complexities of the financial markets with greater precision and insight. This powerful indicator is engineered to adeptly identify whether a market is trending or not, offering users a vital edge in their trading strategy. Key Features: Accurate Trend Detection : The core functionality of the Trend Analysis Indicator lies in its ability to accurately detect market trends. It analyzes p
A technical indicator that displays information about the trading volume in the form of a histogram of distribution by price levels. It is used as an independent indicator that helps to evaluate the current objective situation of the instrument, as well as in the format of integration with other methods of analysis, to confirm or filter when making trading decisions. Key Features: Interactive profile update, real-time work Five modes of histogram calculation The possibility of separating the vol
The Squat is a function of the range of a given price bar and the volume, or TIC volume, that occurs while that range is being created. The basic idea is that high volume and little price movement indicate substantial support or resistance. The idea behind the approach to this indicator is to first look for likely Fibonacci support and resistance and then see if Squat manifests when that point is reached. The indicator determines one of the high probability patterns of DiNapoli. It does not re
スマートシンボルスイッチャー - 高度なチャートナビゲーションツール スマートシンボルスイッチャーでトレーディングワークフローを効率化しましょう。これは、効率的なマルチシンボルおよびマルチタイムフレーム管理のために設計された強力なMT4インジケーターです。カスタマイズ可能なキーボードショートカットで、銘柄とチャート期間をシームレスに切り替え、超高速実行を実現します。 機能には、カラフルまたはシンプルな列レイアウトによる柔軟な表示オプション、最適な表示のための調整可能なズーム機能、ワークスペースを整理するための便利な非表示機能が含まれます。シンボルを手動で追加するか、自動検出でウォッチリストを作成できます。直感的なドラッグアンドムーブインターフェースにより、お好みに応じて要素を整理および再配置できます。 複数のチャートを管理するアクティブトレーダーに最適なスマートシンボルスイッチャーは、繰り返しのクリックを排除し、プロフェッショナルグレードのチャートコントロールにより、トレーディング効率を向上させます。 主な機能: シンボルとタイムフレームの即座の切り替え カスタマイズ可能なキーボードシ
ブレーカートレーダーになり、価格が反転すると市場構造からの利益が変化します。 注文ブロックブレーカーインジケーターは、トレンドまたは価格の動きが枯渇に近づいており、逆転の準備ができていることを識別します。通常、反転または大規模なプルバックが発生しようとしているときに発生する市場構造の変化について警告します。 この指標は、ブレイクアウトと価格の勢いを識別する独自の計算を使用します。使い果たされる可能性のあるポイントの近くで新しい高値が形成されるたびに、インディケーターはその高値の作成を担当する最後の注文ブロックを描きます。次に、移動する価格とともに注文ブロックを追跡します。その後、価格が反対方向にシフトし、その注文ブロックを突破すると、新しい市場構造を作成し、トレンドまたは大きな後退の可能性のある反転の開始を警告します。 注文ブロックは、高値/安値が作成される前の最後の反対色のろうそくであり、価格がこれらの重要な領域を下抜けすると、トレンドの短期的ま​​たは長期的な反転の兆候です。 特徴 重要な枯渇点での市場構造の変化を警告します 価格が使い果たされるレベルに近づくと、自動的に
The YFX Symbol Selector indicator is used to easily change the chart symbol and period with a click of a button. This is done by using a selector GUI object that can be placed on any corner of the chart. The GUI selector contains the following information: Descriptive header for GUI selector panel Symbol information and controls for changing the chart symbol Period information and controls for changing the chart period Footer containing the current bid/ask quote for the currently selected symbol
HC candlestick pattern is a simple and convenient indicator able to define candle patterns.‌ Candlestick charts are a type of financial chart for tracking the movement of securities. They have their origins in the centuries-old Japanese rice trade and have made their way into modern day price charting. Some investors find them more visually appealing than the standard bar charts and the price action is easier to interpret. Hc candlestick pattern is a special indicator designed to find divergence
Don Hits
Nestor Alejandro Chiariello
積極的な取引の専門家であるドンを紹介します。これは多方向システムであり、すべての時間とすべての通貨をカバーし、ドローダウンコントロールを備えています。 このシステムは、私のマーチンゲール ロジックの 1 つを使用して、より短い時間とより長い時間で何が起こるかを追跡します。また、ドローダウンに介入する必要があるかどうかも決定されます。多くの人がマーチンを好まないことはわかっています 彼らはアカウントを書き込むことに慣れていますが、私のシステムは違うと信じてください。これはエラーをカバーし、常に動作を続けるために実装されたロジックです。これらのシステムは DD が高くなる可能性があるため、内部 それを制御するために設計されたシステム、市場で最も利益を生み出すのはマーティン社であることを忘れないでください。 グリッド取引の高度な技術を使用した攻撃的なシステムで、市場全体を管理します。最も高度な技術は、エントリーとエグジットのどちらかを制御する保護であるため、ドンヒットでエントリーすることができます。つまり、積極的にエントリーします。 ただし、継続的に累積的な防御を行う厳密かつ複雑なシステ
Quantum Swing 1. What is Quantum Swing The indicator calculates and displays future price levels based on quantum mathematics with high accuracy of probability and direction. Levels are displayed in the form of zones for making trading decisions; they clearly define a narrow price range for placing orders with a minimum stop-loss and maximum take-profit. The indicator displays future trading zones on different timeframes H1, H4, D, W. Quantum oscillations are also displayed without reference to
FREE
The Chart Navigator is a powerful and user-friendly indicator designed to enhance your chart navigation experience in the MetaTrader platform. With its advanced features and intuitive interface, it enables traders to effortlessly explore multiple timeframes, switch between symbols, and efficiently analyze price movements. Key Features: Timeframe Navigation: Seamlessly switch between different timeframes with just a single click. The Chart Navigator provides a graphical object that allows you to
FREE
IMPORTANT; Price is subject to rise at any time from now! Do not miss this offer! Dear trader I am glad to introduce my new tool called Trend Analyser Dashboard to you. The design, style, and settings of this indicator  have been made simple to make its users not take too much time in understanding the indicator itself.   The purpose is to help traders in analysing the direction of the major trend and the status of the trend whether in weak trend or its strong trend. The indicator will also prov
MT4 To Notion
Levi Dane Benjamin
5 (2)
このプログラムでは、非常に使いやすいユーザーインターフェースを使用して、MetaTraderアカウントからすべての取引を直接Notionにエクスポートできます。  MT5 バージョン  |  ユーザーガイド + デモ 始めるには、ユーザーガイドをご利用いただき、Notionのテンプレートをダウンロードしてください。 デモが必要な場合は、ユーザーガイドをご覧ください。ストラテジーテスターでは機能しません! 主な特長 取引口座からすべての取引をNotionにエクスポート 最終日からの取引をエクスポートする 最終週からの取引をエクスポートする 最終月からの取引をエクスポートする カスタム時間範囲からの取引をエクスポートする すべての新しい閉じられた取引を自動的にNotionに送信する 注文タイプ、ボリューム、オープン時間、クローズ時間などのエクスポートに含めるフィールドを選択する 始め方 上記のユーザーガイドに移動するか、EAを起動して「接続ヘルプを取得」をクリックしてください。 接続したら、「開始:すべてをエクスポート」をクリックして、履歴からすべての現在の取引をNotionに送信します
このプロダクトを購入した人は以下も購入しています
Gann Made Easy は、ミスター・ギャンの理論を使用した取引の最良の原則に基づいた、プロフェッショナルで使いやすい外国為替取引システムです。 W・D・ガン。このインジケーターは、ストップロスとテイクプロフィットレベルを含む正確な買いと売りのシグナルを提供します。 PUSH通知を利用して外出先でも取引可能です。 ご購入後、取引方法の説明と優れた追加インジケーターを無料で入手するには、私にご連絡ください! おそらく、ギャンの取引手法についてはすでに何度も聞いたことがあるでしょう。通常、ギャンの理論は初心者のトレーダーだけでなく、すでにある程度の取引経験がある人にとっても非常に複雑なものです。なぜなら、ギャンの取引手法は理論的にはそれほど簡単に適用できるものではないからです。私はその知識を磨き、最良の原則を私の外国為替インジケーターに組み込むために数年を費やしました。 このインジケーターは非常に簡単に適用できます。必要なのは、それをチャートに添付し、簡単な取引推奨事項に従うだけです。このインジケーターは常に市場分析の仕事を行い、取引の機会を探します。適切なエントリーポイントを検出す
M1 SNIPER は使いやすいトレーディングインジケーターシステムです。M1時間足向けに設計された矢印インジケーターです。M1時間足でのスキャルピングのためのスタンドアロンシステムとして、また既存のトレーディングシステムの一部としても使用できます。このトレーディングシステムはM1時間足での取引に特化して設計されていますが、他の時間足でも使用できます。元々、この手法はXAUUSDとBTCUSDの取引用に設計しましたが、他の市場においても役立つと考えています。 インジケーターのシグナルは、トレンドの方向と逆方向に取引できます。インジケーターのシグナルを利用して両方向に取引するのに役立つ特別な取引テクニックをご紹介します。この手法は、特別な動的なサポートとレジスタンスの価格帯を利用することに基づいています。 ご購入後、M1 SNIPER矢印インジケーターをすぐにダウンロードできます。さらに、M1 SNIPERツールのすべてのユーザーに、以下のスクリーンショットに表示されているApollo Dynamic SRインジケーターを無料で提供しています。この2つのインジケーターを組み合わせることで
Scalper Inside PRO – Since 2020. An exclusive indicator that utilizes an innovative algorithm to swiftly and accurately determine the market trend. The indicator automatically calculates opening, closing, and profit levels, providing detailed trading statistics. With these features, you can choose the most appropriate trading instrument for the current market conditions. Additionally, you can easily integrate your own arrow indicators into Scalper Inside Pro to quickly evaluate their statistics
After purchase, contact me privately to receive 1 month of free testing with EA Forex Proton! This advanced MT4 trading robot automatically executes signals from any MT4 indicator, including Market Makers. The latest version also includes AI integration, allowing each trade signal to be analyzed using Artificial Intelligence. Live Signal with EA Forex Proton: Click here Market Makers is a powerful price action trading system designed to identify high-probability Buy and Sell opportunities based
まず第一に、この取引ツールはノンリペイント、ノンリドロー、ノンラグの指標であり、プロの取引に理想的ですことを強調する価値があります。 オンラインコース、ユーザーマニュアル、デモ。 スマートプライスアクションコンセプトインジケーターは、新米から経験豊富なトレーダーまで、非常 に強力なツールです。Inner Circle Trader AnalysisやSmart Money Concepts Trading Strategiesなど、20以上の有用な指標を1つに組み合わせています。このインジケーターはスマートマネーコンセプトに焦点を当て、大手機関の取引方法を提供し、彼らの動きを予測するのに役立ちます。 特に、流動性分析に優れており、機関がどのように取引しているかを理解しやすくしています。市場のトレンドを予測し、価格の動きを慎重に分析するのに優れています。機関の戦略とトレードを合わせることで、市場の動向についてより正確な予測ができます。このインジケーターは多目的であり、市場構造を分析し、重要な注文ブロックを特定し、さまざまなパターンを認識するのに優れています。 このインジケーターは
Ultimate Sniper Dashboard
Hispraise Chinedum Abraham
4.82 (22)
299ドルで割引中! 今後値上げの可能性あり! 下の説明を読んでください! 究極のスナイパーダッシュボードのための最高のエントリーシステム。究極のダイナミックレベル。(私の製品をチェックしてください) 究極のスナイパーダッシュボードはMT4多通貨テスト制限のため、ライブマーケットでのみ作動します。 究極のスナイパーダッシュボードをご紹介します。HA-Sniper、MA-Sniper、その他多くの特別なモードが含まれる最高の製品です。究極のスナイパーダッシュボードは絶対的な獣です! 初心者やエキスパートトレーダーにとって最高のソリューションです。もう二度と動きを見逃さない! シンプルさとピップを愛するトレーダーのために、特別な製品をご用意しました。シンプルでありながら、ダッシュボードは複数のカスタムアルゴリズムに基づき28の通貨ペアを監視し、すべての作業を行います。たった一つのチャートで、プロのように市場を読み解くことができます。もし、為替ペアが動き出したときに、その方向性を正確に特定することができれば、あなたの取引はどれほど改善されることでしょう。   当社のシステムは、高い確率
Trend Screener
STE S.S.COMPANY
4.79 (95)
トレンドインジケーター、1つのツールに組み込まれたすべての重要なトレンド機能を備えたトレンドトレーディングとフィルタリングのための画期的なユニークなソリューション! これは、すべてのシンボル/商品(外国為替、商品、暗号通貨、インデックス、株式)で使用できる100%再描画されていないマルチタイムフレームおよびマルチ通貨インジケーターです。 期間限定オファー: サポートおよびレジスタンス スクリーナー インジケーターは、たった 50 ドルで永久的にご利用いただけます。(元の価格 250 ドル) (オファー延長) トレンドスクリーナーは、チャート内のドットで矢印トレンドシグナルを提供するインジケーターに続く効率的なインジケーターです。 トレンド分析インジケーターで使用できる機能: 1.トレンドスキャナー。 2.最大利益分析を備えたトレンドライン。 3.トレンド通貨強度メーター。 4.アラート付きのトレンド反転ドット。 5.アラート付きの強いトレンドドット。 6.トレンド矢印 毎日の分析例、毎日のシグナルパフォーマンス...など、トレンドスクリーナーインジケーターを使用して、ここで見つけること
「 Dynamic Scalper System 」インジケーターは、トレンド波の中でスキャルピング取引を行う手法のために設計されています。 主要通貨ペアと金でテスト済みで、他の取引商品との互換性があります。 トレンドに沿った短期的なポジションオープンのシグナルを提供し、追加の価格変動サポートも提供します。 インジケーターの原理 大きな矢印はトレンドの方向を決定します。 トレンド波の中では、小さな矢印の形でスキャルピングシグナルを生成するアルゴリズムが機能します。 赤い矢印は強気方向、青い矢印は弱気方向です。 トレンドの方向には敏感な価格変動ラインが描かれ、小さな矢印のシグナルと連動します。 シグナルは次のように機能します。適切なタイミングでラインが現れるとエントリーシグナルが形成され、ラインが開いている間はポジションが保持され、完了すると取引が終了します。 推奨される動作時間枠はM1~H4です。 矢印は現在のローソク足に形成され、次のローソク足が開いている場合は、前のローソク足の矢印は再描画されません。 入力パラメータ Trend Wave Period - トレンド方向
まず第一に、この取引インジケーターは再描画されず、再描画されず、遅延しないことを強調する価値があります。これにより、手動取引とロボット取引の両方に理想的なものになります。 ユーザーマニュアル:設定、入力、戦略。 アトミックアナリストは、価格の強さとモメンタムを利用して市場でより良いエッジを見つけるためのPA価格アクションインジケーターです。ノイズや誤ったシグナルを除去し、取引ポテンシャルを高めるための高度なフィルターを備えています。複雑なインジケーターの複数のレイヤーを使用して、アトミックアナリストはチャートをスキャンし、複雑な数学的計算をシンプルなシグナルと色に変換します。これにより、どのような初心者トレーダーでも理解して使用し、一貫した取引の決定を行うことができます。 「アトミックアナリスト」は、新規および経験豊富なトレーダー向けにカスタマイズされた包括的な取引ソリューションです。プレミアムインジケーターとトップノッチの機能を1つの取引戦略に組み合わせ、すべてのタイプのトレーダーにとって汎用性のある選択肢にします。 デイリートレーディングとスキャルピング戦略:高速で正確な
Ultimate Dynamic Levels
Hispraise Chinedum Abraham
4.7 (10)
現在、ホリデーディスカウントで399ドル! 今後値上がりする可能性があります。以下の説明をお読みください。 Ultimate Dynamic Levelsの紹介 - Ultimate Sniper DashboardのBESTエントリーインジケーター! 極めてローリスクなタイムリーエントリーと高RR!!! アルティメットスナイパーダッシュボードはこちら。 初心者はもちろん、プロのトレーダーにとっても最も重要な能力は、いつどこで相場が転換するかを正確に判断し、いかに安全に参入し、利益を得て退場するかを見極めることです。 アルティメット・ダイナミック・レベルズ・インディケーターは、相場が転換する可能性が最も高い場所を簡単に教えてくれるので、極めてローリスクなトレードを自信を持って行うことができ、同時にチャートをクリーンでシンプルに保ちながら、$$$を稼ぐことができるのです! アルティメット・ダイナミック・レベルズ・インディケーターは、複数の時間枠で重要な隠れたレベルを一度に見つけるユニークで強力なアルゴリズムを持っています。また、他の典型的なSRインジケーターのように、レベルを再描
Super Signal – Skyblade Edition プロ仕様のノンリペイント / ノーラグ・トレンドシグナルシステム。卓越した勝率を実現 | MT4 / MT5 対応 1分足、5分足、15分足などの低い時間足で最も効果を発揮します。 主な特徴: Super Signal – Skyblade Edition は、トレンド取引に特化したスマートなシグナルシステムです。マルチレイヤーのフィルターロジックを用いて、明確な方向性と実際のモメンタムに支えられた強力なトレンドのみを検出します。 このシステムは 天井や底を予測するものではありません 。次の3つの条件がすべて満たされた場合にのみシグナルを発生させます: 明確なトレンド方向 モメンタムの増加 健全なボラティリティ構造 市場セッションに基づく流動性分析と組み合わせることで、シグナルの精度とタイミングがさらに向上します。 シグナルの特性: すべての矢印シグナルは 100% 非リペイント / 遅延なし 一度出現したシグナルは固定され、点滅・消失しません チャート上の矢印、情報パネル、ポップアップ通知、音声アラート、プッシュ通知
ON Trade Waves Patterns Harmonic Elliot Wolfeをご紹介します。これは手動および自動の方法を使用して市場のさまざまなパターンを検出するために設計された高度なインジケーターです。以下はその動作方法です: ハーモニックパターン: このインジケーターは、チャートに表示されるハーモニックパターンを識別できます。これらのパターンは、Scott Carneyの「Harmonic Trading vol 1および2」で説明されているように、ハーモニックトレーディング理論を実践するトレーダーにとって重要です。手動で描画するか、自動検出に頼るかにかかわらず、ON Trade Waves Patternsがお手伝いします。 コントロールパネル: このインジケーターはユーザーフレンドリーなコントロールパネルを備えています。チャートと時間枠の設定を保存し、異なる構成間をスムーズに切り替えることができます。チャートスペースを最大限に活用するために最小化することもできます。他の分析ツールで作業することを好む場合、閉じるボタンをクリックするだけで、すべてのインジケーターデ
現在20%OFF! 初心者やエキスパートトレーダーに最適なソリューションです。 このインディケータは、エキゾチックペア・コモディティ・インデックス・先物など、あらゆるシンボルの通貨の強さを表示することに特化したインディケータです。金、銀、原油、DAX、US30、MXN、TRY、CNHなどの通貨の強さを表示するために、9行目にどのシンボルでも追加することができます。独自の機能を多数搭載し、新しい計算式を採用したため、ユニークで高品質、かつ手頃な価格のトレーディングツールとなっています。新しいトレンドやスキャルピングチャンスのトリガーポイントを正確に把握することができるため、あなたのトレードがどのように改善されるか想像してみてください。 ユーザーマニュアル:ここをクリック   https://www.mql5.com/en/blogs/post/708876 すべての時間枠に対応します。あなたはすぐにトレンドを見ることができるようになります! 新しいアルゴリズムに基づいて設計されているため、潜在的な取引の特定と確認がより簡単になります。これは、8つの主要通貨と1つのシンボルの強弱
通貨強さウィザードは、取引を成功させるためのオールインワン ソリューションを提供する非常に強力な指標です。このインジケーターは、複数の時間枠のすべての通貨のデータを使用して、このまたはその外国為替ペアのパワーを計算します。このデータは、使いやすい通貨インデックスと通貨パワーラインの形式で表され、特定の通貨のパワーを確認するために使用できます。 必要なのは、取引したいチャートにインジケーターを接続することだけです。インジケーターは、取引する通貨の実際の強さを示します。このインジケーターは、トレンドに合わせて取引するときに有利に利用できる売買高の圧力の極値も示します。このインジケーターには、フィボナッチに基づく可能なターゲットも表示されます。 このインジケーターは、PUSH 通知を含むあらゆるタイプのアラートを提供します。 購入後ご連絡下さい。私の取引のヒントをあなたと共有し、素晴らしいボーナスインジケーターを無料で提供します! 幸せで有益な取引をお祈りします。
説明書(ロシア語)  /  説明書 (英語)  /  バージョン MT5 主な機能: 売り手と買い手のアクティブなゾーンを表示します。 このインジケーターは、買いと売りの適切な最初のインパルスレベル/ゾーンをすべて表示します。これらのレベル/ゾーンがアクティブになると、エントリーポイントの探索が始まり、レベルの色が変わり、特定の色で塗りつぶされます。状況をより直感的に把握できるように、矢印も表示されます。 LOGIC AI - テンプレートをアクティブ化するときにエントリポイントを検索するためのゾーン(円)の表示 視認性を向上させるため、人工知能を用いて進入ポイントを探索したゾーンを表示する機能が追加されました。 より高い時間枠からのレベル/ゾーンの表示(MTFモード) より長い時間間隔でレベル/ゾーンを表示する機能を追加しました。また、インジケーターに自動トレンド検出機能(   TPSproTREND PRO   )を実装しました。 取引のための個別の専門的なステップバイステップのアルゴリズム このアルゴリズムは、トレンドの方向と逆方向の両方でデイトレードを行うために設計されていま
BTMM State Engine Pro is a MetaTrader 4 indicator for traders who use the Beat The Market Maker approach: Asian session context, kill zone timing, level progression, peak formation detection, and a multi-pair scanner from a single chart. It combines cycle state logic with a built-in scanner dashboard so you do not need the same tool on many charts at once. What it does Draws the Asian session range; session times can follow broker server offset or be set in inputs. Tracks level progression (L
Linear Trend Predictor ー - エントリ ポイントと方向サポート ラインを組み合わせたトレンド インジケーター。高値/安値チャネルを突破するという原理に基づいて機能します。 インジケーターのアルゴリズムは市場のノイズをフィルタリングし、ボラティリティと市場の動向を考慮します。 インジケーターの機能  平滑化手法を使用して、市場のトレンドと、買い注文または売り注文を開くためのエントリー ポイントを表示します。  任意の時間枠のチャートを分析して、短期および長期の市場の動きを判断するのに適しています。  あらゆる市場や時間枠に適応可能な入力パラメータにより、トレーダーはインジケーターを独自にカスタマイズできます。  設定されたインジケーター信号は消えず、再描画もされません。ローソク足の終値で決定されます。  いくつかの種類の通知が矢印と組み合わされています。  このインジケーターは、独立した取引システムとして使用することも、他の取引システムへの追加として使用することもできます。  あらゆるレベルの経験を持つトレーダーが使用できます。 主なパラメータ Vol
現在40%オフ 初心者やエキスパートトレーダーに最適なソリューション! このインジケーターは、独自の機能と新しい計算式を取り入れた、ユニークで高品質、かつ手頃な価格のトレーディングツールです。たった1枚のチャートで28の為替ペアの通貨強度を読み取ることができます。新しいトレンドやスキャルピングチャンスの引き金となるポイントを正確に特定することができるので、あなたのトレードがどのように改善されるか想像してみてください。 ユーザーマニュアルはこちら  https://www.mql5.com/en/blogs/post/697384 これが最初の1本、オリジナルだ! 価値のないクローンを買わないでください。 特別な サブウィンドウの矢印で強い通貨の勢いを表示 GAPがあなたのトレードを導く! 基準通貨や気配値が売られすぎ・買われすぎのゾーン(外相フィボナッチレベル)にあるとき、個別チャートのメインウィンドウに警告表示。 通貨がレンジの外側から反落した場合、プルバック/リバーサルのアラート。 クロスパターンの特別なアラート 複数の時間枠を選択可能で、トレンドを素早く確認できます
Easy Breakout
Mohamed Hassan
4.71 (14)
After your purchase, feel free to contact me for more details on how to receive a bonus indicator called VFI, which pairs perfectly with Easy Breakout for enhanced confluence!    Easy Breakout is a powerful price action trading system built on one of the most popular and widely trusted strategies among traders: the Breakout strategy ! This indicator delivers crystal-clear Buy and Sell signals based on breakouts from key support and resistance zones. Unlike typical breakout indicators, it levera
Trend indicator AI
Ramil Minniakhmetov
4.53 (83)
Trend Ai indicatorは、トレンドの識別と実用的なエントリポイントと反転アラートを組み合わせることで、トレーダーの市場分析を強化する優れたツールです。 この指標は、ユーザーが自信と正確さで外国為替市場の複雑さをナビゲートすることを可能にします トレンドAiインジケーターは、主要なシグナル以外にも、プルバックやリトレースメント中に発生するセカンダリエントリポイントを識別し、トレーダーが確立されたトレンド内の価格修正を活用できるようにします。 重要な利点: *MT4およびMT5の仕事 *明確な買いまたは売りシグナル *再描画しません ·すべての資産で動作します 私はeaやセットをtelegram it詐欺で販売しないように注意してください。 すべての設定はここでブログで無料です。  重要! 指示とボーナスを得るために購入後すぐに私に連絡してください! 私の他のプロダクトと同様、実質操作の監視はここに見つけることができます: https://www.mql5.com/en/users/mechanic/seller&nbsp ; 設定および入力: すべての
Volatility Trend System - a trading system that gives signals for entries. The volatility system gives linear and point signals in the direction of the trend, as well as signals to exit it, without redrawing and delays. The trend indicator monitors the direction of the medium-term trend, shows the direction and its change. The signal indicator is based on changes in volatility and shows market entries. The indicator is equipped with several types of alerts. Can be applied to various trading ins
トレンドラインプロ   市場の真の方向転換点を理解するのに役立ちます。この指標は、真のトレンド反転と主要プレーヤーが再び参入するポイントを示します。 分かりますか     BOSライン   複雑な設定や不要なノイズなしに、より長い時間足でのトレンドの変化と重要なレベルを把握できます。シグナルは再描画されず、バーが閉じた後もチャート上に残ります。 VERSION MT 5     -     RFI LEVELS PRO インジケーター と組み合わせることで、その潜在能力を最大限に発揮します。 インジケーターが示す内容: 本当の変化   トレンド(BOSライン) 一度シグナルが現れたら、それは有効です!これは、リペイント機能を持つインジケーターとの重要な違いです。リペイント機能を持つインジケーターは、シグナルを発した後、それを変更し、資金の損失につながる可能性があります。これにより、より高い確率と精度で市場に参入できます。また、矢印が現れた後、目標値(利益確定)に達するか、反転シグナルが現れるまで、ローソク足の色を変更する機能もあります。 繰り返しエントリ       主要プレーヤーの
Order Block Hunter
Noha Mohamed Fathy Younes Badr
5 (10)
Order block hunter indicator is the best indicator for  hunt the order blocks that area where there has been a large concentration of limit orders waiting to be executed Order blocks are identified on a chart by observing previous price action and looking for areas where the price experienced significant movement or sudden changes in direction .This indicator does that for you by using very complicated codes and helps you to take the best areas To buy and sell because it make marks at the best a
GOLD Impulse with Alert
Bernhard Schweigert
4.67 (12)
このインディケータは、当社の2つの製品 Advanced Currency IMPULSE with ALERT  +   Currency Strength Exotics . のスーパーコンビネーションです。 このインジケーターは全ての時間枠で作動し、8つの主要通貨と1つのシンボルの強弱のインパルスをグラフで表示します。 このインジケータは、金、エキゾチックペア、商品、インデックス、先物など、あらゆるシンボルの通貨強度の加速度を表示することに特化されています。金、銀、原油、DAX、US30、MXN、TRY、CNHなどの通貨強度の加速度(インパルスまたは速度)を表示するために、任意のシンボルを9行目に追加できる、この種の最初のものです。 新しいアルゴリズムに基づいて構築され、潜在的な取引の特定と確認がさらに容易になりました。これは、通貨の強さや弱さが加速しているかどうかをグラフィカルに表示し、その加速の速度を測定するためです。加速すると物事は明らかに速く進みますが、これはFX市場でも同じです。つまり、反対方向に加速している通貨をペアリングすれば、潜在的に利益を生む取引を特定
Apollo SR Master は、サポート/レジスタンスゾーンを利用した取引をより容易かつ確実にする特別な機能を備えたサポート/レジスタンスインジケーターです。このインジケーターは、ローカル価格の高値と安値を検出することで、タイムラグなしでリアルタイムにサポート/レジスタンスゾーンを計算します。そして、新たに形成されたSRゾーンを確認するために、インジケーターは特別なシグナルを表示します。このシグナルは、SRゾーンを実際の売りまたは買いシグナルとして考慮して使用できることを示します。この場合、SRゾーンの強度が高まり、SRエリアからの取引が成功する確率も高まります。これがこのインジケーターの基本的な考え方です。 SRゾーンは、ストップロスとテイクプロフィットの設定を容易にします。シグナルの方向に応じて、SRゾーンの上または下のスペースをストップロスとして設定できます。さらに、反対側のSRゾーンは、潜在的なテイクプロフィットエリアとして設定できます。 また、Apollo SRマスターインジケーターをご利用のすべてのユーザーには、「Apollo Price Action System」
KT Gaussian Trend Filter は、ガウスフィルターと線形回帰スムージングを組み合わせることで、明確かつ正確なトレンド分析を実現します。わかりやすい買いと売りのシグナルを生成しながら、市場の長期的な方向性を効果的に示します。 機能 カスタマイズ可能なガウスフィルター: 期間やポール設定を調整してスムージング精度を高め、トレンドの明瞭さを向上。 線形回帰による強化: ガウススムージングをさらに最適化し、市場のノイズによる誤信号を最小限に抑えます。 マルチタイムフレームスキャナー: 複数の時間軸におけるガウストレンドの方向を自動検出し、わかりやすいダッシュボードに表示します。 トレーリングバンド機能: トレンド中の深い押し目でのエントリーポイントを簡単に把握可能。 カラーカスタマイズ対応: チャートの配色や取引スタイルに合わせて色を自由に設定できます。 内蔵アラート機能: ポップアップ、メール、プッシュ通知、サウンドアラートで即時通知を受け取れます。 使い方 このインジケーターは明確なシグナルを提供し、トレーダーがエントリーやエグジットのタイミングを判断しやすくします
Advanced Supply Demand
Bernhard Schweigert
4.91 (299)
現在40%オフ 初心者にもエキスパートトレーダーにも最適なソリューション このインジケーターは独自の機能と新しい公式を多数内蔵しており、ユニークで高品質かつ手頃な取引ツールです。このアップデートでは、2つの時間枠ゾーンを表示できるようになります。より長いTFだけでなく、チャートTFとより長いTF(ネストゾーンを表示)の両方を表示できます。すべてのSupply Demandトレーダーの皆さんのお気に召すはずです。:) 重要情報の公開 Advanced Supply Demandの可能性を最大化するには、 https://www.mql5.com/ja/blogs/post/720245 にアクセスしてください。   エントリーまたはターゲットの正確なトリガーポイントを正確に特定できれば取引がどのように改善されるか想像してみてください。新しい基盤となるアルゴリズムに基づいて構築されているため、買い手と売り手の間の潜在的な不均衡をさらに簡単に特定できます。これは、最も強い需要と供給のゾーンと、過去のパフォーマンス(古いゾーンを表示)がグラフィカルに表現されるためです。これらの機能は、最適な
Route Lines Prices -は、価格の方向性を予測するために設計されたインジケーターです。シンプルなインターフェースには、価格変動と将来の方向性を計算するための複数のアルゴリズムが搭載されています。これらのアルゴリズムには、使用する時間枠に基づいたボラティリティ計算と価格平滑化が含まれています。 このインジケーターには、「 Calculating price values 」値を変更するためのパラメーターが1つだけあります。デフォルト値の1は、バランスの取れた自動計算を提供し、インジケーターを手動で設定することなく使用できます。 値を2から500まで手動で変更することで、インジケーターを独自のトレーディングシステムに合わせてカスタマイズできます。 このインジケーターは、M1からH4の時間枠での使用を推奨します。あらゆる取引銘柄で使用できます。 シグナル矢印はローソク足の終値で生成され、過去の履歴には再描画されません。 メインチャートには、重複した矢印が表示されます。 複数のアラートタイプが利用可能です。内蔵のライン軌跡カウンターは、終値に基づいて動作します。これ
PRO Renko Systemは、特別にRENKOチャートを取引するために設計された高精度の取引システムです。 これは、様々な取引商品に適用することができる普遍的なシステムです。 システムは効果的に正確な逆転信号へのアクセスを与えるいわゆる市場の騒音を中和する。 表示器は非常に使いやすく、信号の生成に責任がある1つの変数だけがあります。 あなたは簡単にお好みの任意の取引ツールとレンコバーのサイズにツールを適応させることができます。 私はいつもあなたが私のソフトウェアで収益性の高い取引を支援するために余分なサポートを提供する準備ができています! 私はあなたに幸せで収益性の高い取引をしたいです! ご購入後にご連絡ください! 私はあなたに私のレンコチャートジェネレータを送信します。 私はまた、私の個人的な推奨事項やシステムの他のモジュールを無料で共有します!
これは、キャンドルの終値を予測する指標です。 このインジケータは、主にD1チャートでの使用を目的としていますが. この指標は、従来の外国為替取引とバイナリオプション取引の両方に適しています。 インジケーターは、スタンドアロンのトレーディングシステムとして使用することも、既存のトレーディングシステムへの追加として機能させることもできます。 このインジケーターは、現在のキャンドルを分析し、キャンドル自体の内部の特定の強度係数と、前のキャンドルのパラメーターを計算します。 したがって、この指標は、市場の動きのさらなる方向性と現在のキャンドルの終値を予測します。 この方法のおかげで、この指標は、短期の日中取引だけでなく、中期および長期の取引にも適しています。 インジケーターを使用すると、市場の状況の分析中にインジケーターが生成する潜在的な信号の数を設定できます。 インジケーターの設定には、このための特別なパラメーターがあります。 また、インジケーターは、チャート上のメッセージの形式で、電子メールで、およびPUSH通知の形式で、新しい信号について通知することができます。 購入後は必ず私に書いて
作者のその他のプロダクト
This indicator Super Channel Pro Pluss indicator.Indicator displays trend movement. Indicator calculates automatically line. Features FiltPer - displays indicator channel period. deviation - displays indicator channel deviation. deviation2 - displays indicator channel deviation. deviation3 - displays indicator channel deviation. How to understand the status: If the arrow is up and line color Teal ;trend is up. If the arrow is down and line color Red; trend is down. If the arrow is Yellow close
This indicator displays the ZigZag Pointer Fibonacci Expansion Triangle movements timeframes only M1-W1. Parameters InDepth: Displays the Depth movements. InDeviation: Displays the Deviation movements. InBackstep: Displays the Backstep movements. Fibonacci Expansion: Displays the Fibonacci Expansion movements. Fibonacci Expansion true.(false) Triangle: Displays the Triangle movements. Triangle true.(false) How to understand the status: If the Triangle is green, trend is up. If the Triangle is r
This indicator displays the trend movements. Parameters Trend: Displays the trend movements, true/false. X: moves the trend left and right. Y: moves the trend up and down. How to understand the status: (M1), square indicates the timeframe for 1 minute. If the square is green, trend is up. If the square is red, trend is down. (M5), square indicates the timeframe for 5 minute. If the square is green, trend is up. If the square is red, trend is down. (M15), square indicates the timeframe for 15 mi
This indicator helps to define the dominant trend. The Blue line and Red line changes at incrementations of the trends. Parameters ki: factor of the delay. per: Displays the indicator period. Trend: Displays the Trend movements. Trend true.(false) X: moves the trend left and right. Y: moves the trend up and down. How to understand the status: If the arrow is blue, trend is up. If the arrow is red, trend is down.
This indicator displays the trend movements. Parameters XRMultiplier: XR multiplier. Line: line movement (true/false). XRzak: XRzak movements (true/false). Arrow1: arrow movements (true/false). Arrow2: arrow movements up and down (true/false). Trend: trend movements (true/false). X: move the trend left and right. Y: move the trend up and down. How to understand the status: If the arrow is green, trend is up. If the arrow is red, trend is down.
This indicator displays the trend movements. Parameters XRMultiplier1: XR multiplier 1. XRMultiplier2: XR multiplier 2. Line1: line 1 movement (true/false). Line2: line 2 movement (true/false). XRTrend: XR trend displays Line 1 and Line 2 movements (true/false). X: move the trend left and right. Y: move the trend up and down. How to understand the status: If the Line is green, trend is up. If the Line is red, trend is down.
This indicator zone indicator.Indicator displays high and low zone. Features Green color - Shows movement on the high zone. Red colr - Shows movement on the low zone. Yellow colr - Shows movement on the zero zone.    How to understand the status: If the bar is higher than the yellow color line , trend is up. If the bar is lower than the yellow color line , trend is down.
This indicator super indicator.Indicator displays trend movement. Indicator calculates automatically bars Features FiltPer - displays indicator period. Multiplier - displays indicator multiplier. How to understand the status: If the indicator bar is higher , trend is up. If the indicator bar is lower , trend is down. IIIIIIIIIIIIIIIIIIIIIIIIIIIIIIIIIIIIIIIIIIIIIIIIIIIIIIIIIIIIIIIIIIIIII
This indicator displays super power trend movement. Features Multiplier - displays multiplier movement. Multiplier2 - displays multiplier2 movement. Trend - displays indicator trend 1 and trend 2 (true/false). separate_windor - displays trend separate window.(0-1....) X - move the trend left and right. Y - move the trend up and down. How to understand the status: If the Trend color is green, trend is up. If the Trend color is red, trend is down.
This indicator displays Super Power  Beeta trend movement.Indicator is version 2 . Features Multiplier - displays multiplier movement. Multiplier2 - displays multiplier2 movement. Trend - displays indicator trend 1 and trend 2 (true/false). Background:color - displays background color (true/false). separate_window - displays trend separate window.(0-1....) separate_window2 - displays trend (background color )separate window.(1-2....) X - move the trend left and right. Y - move the trend up an
This indicator displays XR Power Trend movement.Indicator displays Moving Average period 5,Moving Average period 26,Moving Average period 52,Commodity Channel Index,MACD,Average Directional Movement Index,Bulls Power,Bears Power,Stochastic Oscillator,Relative Strength Index,Force Index,Momentum,DeMarker,average movement.Indicators period is standard period.    Features X - move the trend left and right. Y - move the trend up and down. How to understand the status: If the Trend color is green, t
This indicator Master XR indicator.Indicator displays trend movement. Indicator calculates automatically line. Features FiltPer - displays indicator period. deviation - displays indicator deviation. deviation2 - displays indicator deviation. How to understand the status: If (Timeframe M1-H1) FiltPer = 100; If ( Timeframe H4-MN) FiltPer = 5-20; ////////////////////////////////////////////////////////////////////////////////////////////////////////////////////////////////////////////////////// //
This indicator Super MA Pluss indicator.Indicator displays trend movement. Indicator calculates automatically line. Features FiltPer - displays indicator period. How to understand the status: If the arrow is green, trend is up. If the arrow is red, trend is down. /////////////////////////////////////////////////////////////////////////////////////////////////////////////////////////////////////////////////// ///////////////////////////////////////////////////////////////////////////////////////
This indicator Super Channel Arrow and zak indicator.Indicator displays trend movement. Indicator calculates automatically line. Features FiltPer - displays indicator channel period. FiltPer2 - displays indicator period. deviation - displays indicator channel deviation. How to understand the status: If the arrow is green, trend is up. If the arrow is red, trend is down. best FiltPer ,period timeframe M1-H1 (100);H4-MN (50) best FiltPer2, period timeframe M1-H1 (50);H4-MN (25) //////////////////
This indicator Super Channel Pro indicator.Indicator displays trend movement. Indicator calculates automatically line. Features FiltPer - displays indicator channel period. deviation - displays indicator channel deviation. deviation2 - displays indicator channel deviation. How to understand the status: If the arrow is green, trend is up. If the arrow is red, trend is down. ///////////////////////////////////////////////////////////////////////////////////////////////////////////////////////////
This indicator Super XT indicator.Indicator displays trend movement. Indicator calculates automatically line. Features FiltPer - displays indicator period. Window - displays indicator trend (true/false). Trend - displays indicator trend (true/false). X - move the trend left and right. Y - move the trend up and down.     How to understand the status: If the Trend color is green, trend is up. If the Trend color is red, trend is down. ////////////////////////////////////////////////////////
This indicator Super Turbo indicator.Indicator displays trend movement. Indicator calculates automatically line. Features FiltPer - displays indicator period. Step - displays indicator Step. Trend - displays indicator trend (true/false). X - move the trend left and right. Y - move the trend up and down. How to understand the status: If the Trend color is green, trend is up. If the Trend color is red, trend is down. ///////////////////////////////////////////////////////////////////////////
This indicator Pluuto Alert indicator.Indicator displays trend movement. Indicator calculates automatically line.Alert = arrow.When the alert is up the next alert is down,when the alert is down the next alert is up (new bar). Features FiltPer - displays indicator period.Line1. FiltPer2 - displays indicator period.Line2. Multiplier - displays indicator multiplier.(FlitPer,Line1;step) Deviation1 - displays indicator deviation.(Line2) Deviation2 - displays indicator deviation.(Arrow) Trend - displa
This indicator Pluuto Alert Plus indicator.Indicator displays trend movement. Indicator calculates automatically line.Alert = FiltPer.When the alert is up the next alert is down,when the alert is down the next alert is up (new bar). Features FiltPer - displays indicator period.Line1. FiltPer2 - displays indicator period.Line2. Multiplier - displays indicator multiplier.(FlitPer,Line1;step) Deviation1 - displays indicator deviation.(Line2) Deviation2 - displays indicator deviation.(Line2) Deviati
This indicator Pluuto Alert Pro indicator.Indicator displays trend movement. Indicator calculates automatically line.Alert = (FiltPer1,Line1_Arrow).When the alert is up the next alert is down,when the alert is down the next alert is up (new bar). Features FiltPer1 - displays indicator period.Per1 FiltPer2 - displays indicator period.Per2. FiltPer3 - displays indicator period.Per3. Multiplier1_per1 - displays indicator multiplier.(FlitPe1,step) Multiplier2_line1 - displays indicator multiplier.(L
This indicator Matrix X indicator.Indicator displays Stochastic oscillator,Williams Percent Range,DeMarker,Relative Strength Index,Matrix trend movement. Indicator helps to buy and sell.Matrix trend = (Stochastic+WPR+DeMarker+RSI)/4. Features KPeriod - displays Stochastic K period. DPeriod - displays Stochastic D period. Slowing- displays Stochastic Slowing. Stochastic_Method - displays Stochastic Method. Stochastic_price - displays Stochastic Price. WPR_per - displays WPR period. Dem_per - disp
This indicator Mega Super indicator.Indicator displays trend movement. Indicator helps to buy and sell.In dicator displays arrow and line. Features per - displays indicator period. How to understand the status: If the arrow color is green, trend is up. I f the arrow color is red, trend is down. //////////////////////////////////////////////////////////////////////////////////////////////////////////////////////////////////////////////////// ///////////////////////////////////////////////////
This indicator Matic indicator.Indicator displays trend movement. Indicator helps to buy and sell. The indicator shows the movement of sak1 and sak2 Stddevchannel, Regression. Features HLper - displays indicator iHighest and iLowest period. ExtDepth - displays indicator ExtDepth. ExtDeviation - displays indicator ExtDeviation. ExtBackstep - displays indicator ExtBackstep. zak1_ST_RE - displays indicator zak1,Stddevchannel,Regression.(true,false) zak2_ST_RE - displays indicator zak2,Stddevchannel
This indicator Matic Pro indicator.Indicator displays trend movement. Indicator helps to buy and sell. The indicator shows the movement of sak1 and sak2 Stddevchannel, Regression + zak2 indicator. Features HLper - displays indicator iHighest and iLowest period. ExtDepth - displays indicator ExtDepth. ExtDeviation - displays indicator ExtDeviation. ExtBackstep - displays indicator ExtBackstep. p - line indicator bars back.(bars back= zak2) m - regression.(1-8),the best(2-3) i0 -line indicator bar
This indicator Super Neuro Trend indicator.Indicator displays trend movement. Indicator helps to buy and sell. Features FiltPer- displays indicator period. deviation - displaus indicator deviation. Trend - displaus indicator trend.( true,false) Rectangle - displaus indicator rectangle. (true,false)  How to understand the status: If the trend color is green, trend is up. I f the trend color is red, trend is down. I f the trend waiting,trend waiting.     ///////////////////////////////////////////
This indicator Mega Super Neuro Trend indicator.Indicator displays trend movement. Indicator helps to buy and sell.Trend1= line1 > < line1,trend2=line1 > < line2,trend3 = line1,line2  > < line3. Features Trend - displaus indicator trend.( true,false) How to understand the status: If the trend color is green, trend is up. I f the trend color is red, trend is down. ///////////////////////////////////////////////////////////////////////////////////////////////////////////////////////////////////
This indicator XRX Master indicator.Indicator displays trend movement. Indicator helps to buy and sell. Features FiltPer- displays indicator period. deviation - displaus indicator deviation. deviation2 - displaus indicator deviation 2. HL_period - displaus indicator Highest and Lowest period. HL_period2 - displaus indicator Highest 2 and Lowest 2 period. How to understand the status: If the trend color arrow is green, trend is up. I f the trend color arrow is red, trend is down. ///////////
This indicator XXX Master indicator.Indicator displays trend movement. Indicator helps to buy and sell. Features per- displays indicator period. Step- displays indicator step. line- true (false) How to understand the status: If the trend color arrow is green, trend is up. I f the trend color arrow is red, trend is down. //////////////////////////////////////////////////////////////////////////////////////////////////////////////////////////////////////////////////// /////////////////////////////
フィルタ:
レビューなし
レビューに返信