Fast flat

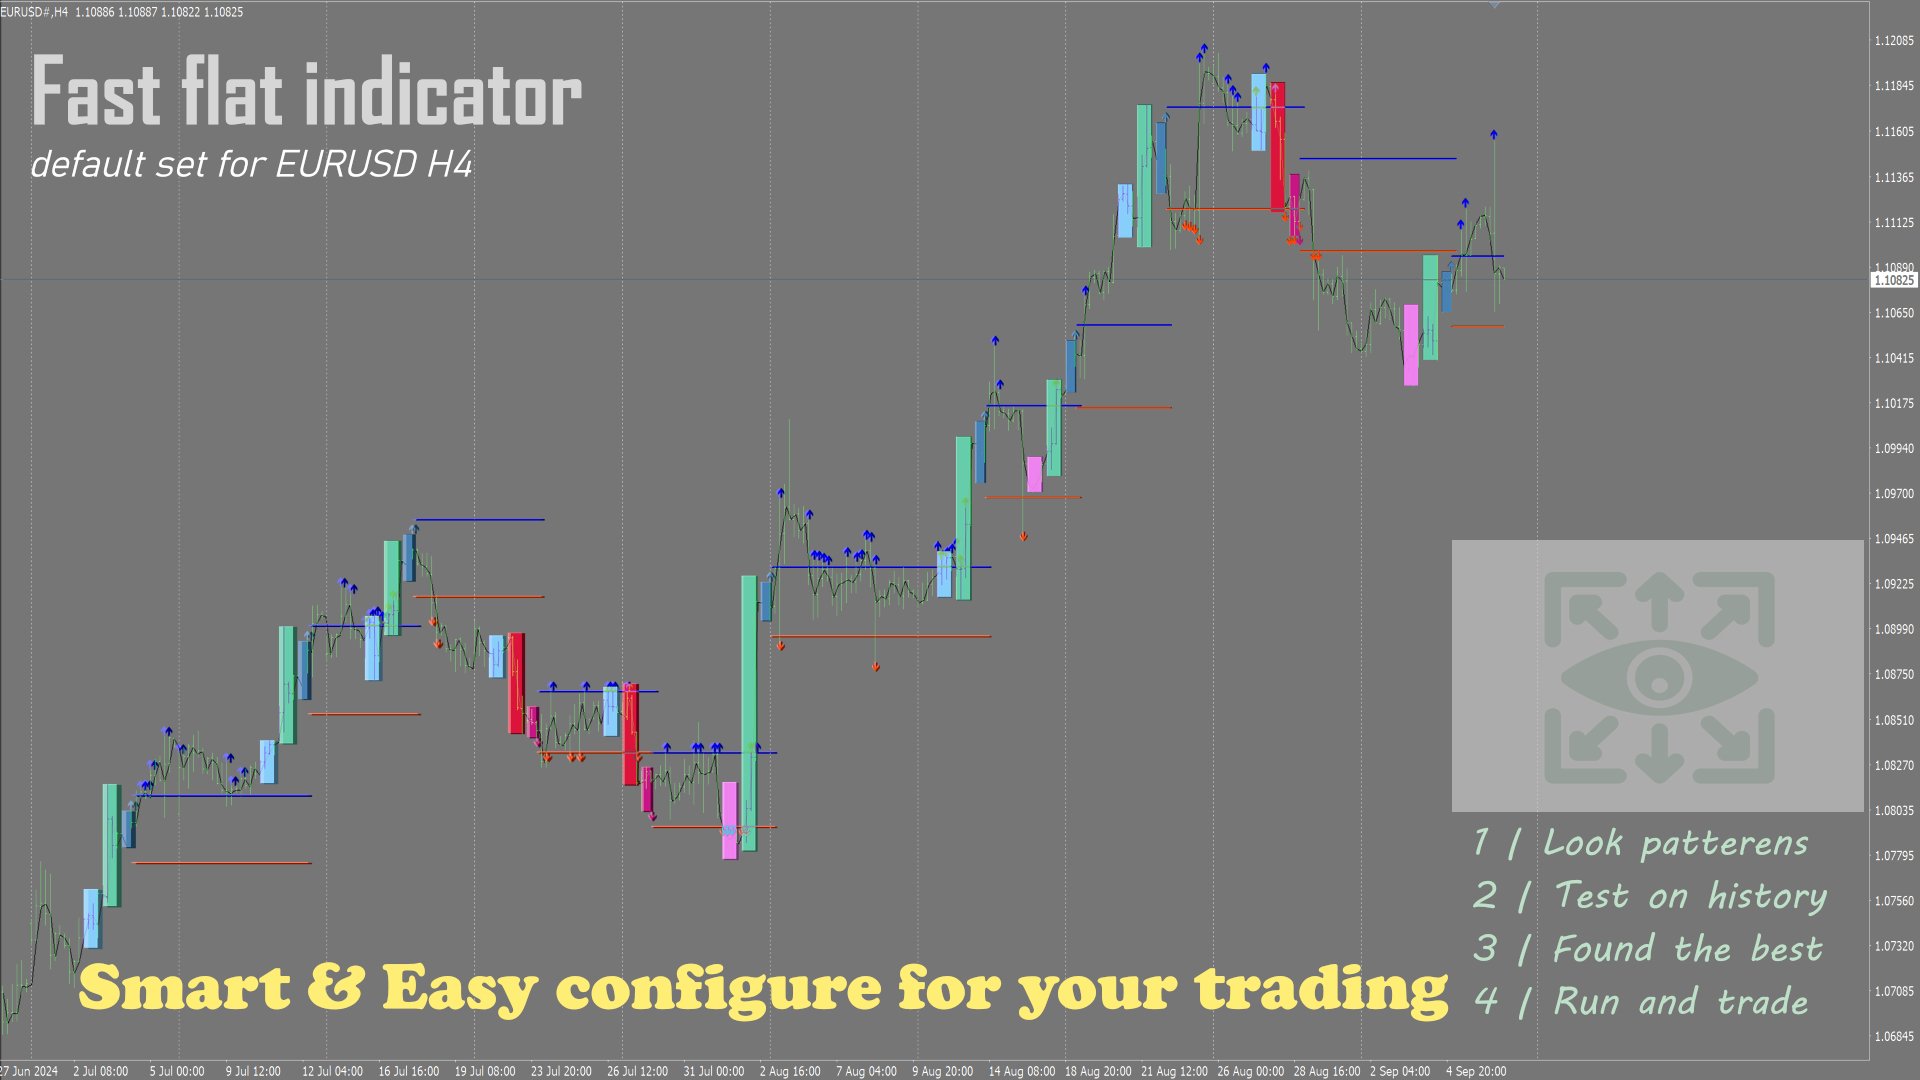
The Fast flat indicator can recognize and notify you of short flats after the price rises or falls. Where the price can rush further or reverse.

++ The indicator is open to arbitrary flat settings. You will probably have to conduct quite a few tests, approaching the best results. I will be very grateful if you share in the comments your tests, parameters and advice to other users, who may also be able to improve your results.

Should I use it for entry signals, order stops, hedging...?

- The indicator is adjustable with simple mathematical calculations. It can be adjusted and tested for your trading conditions.
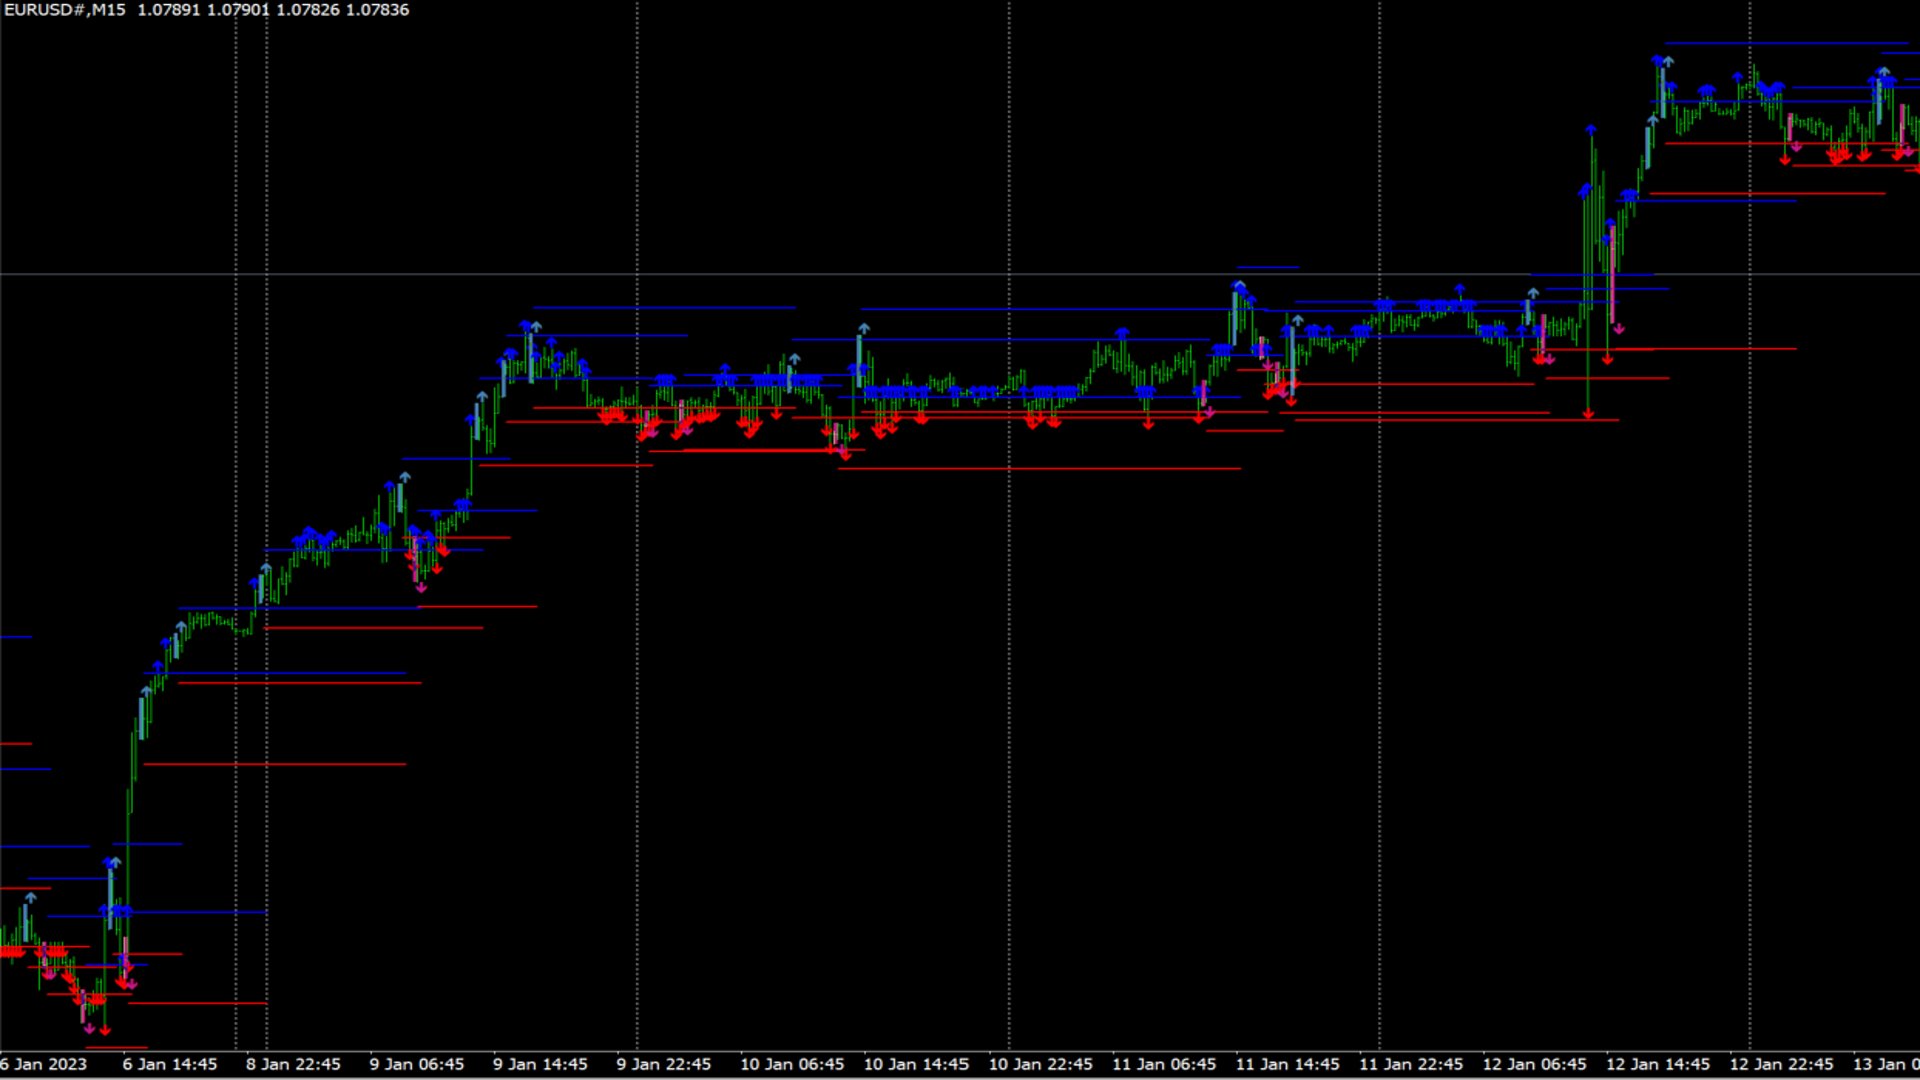
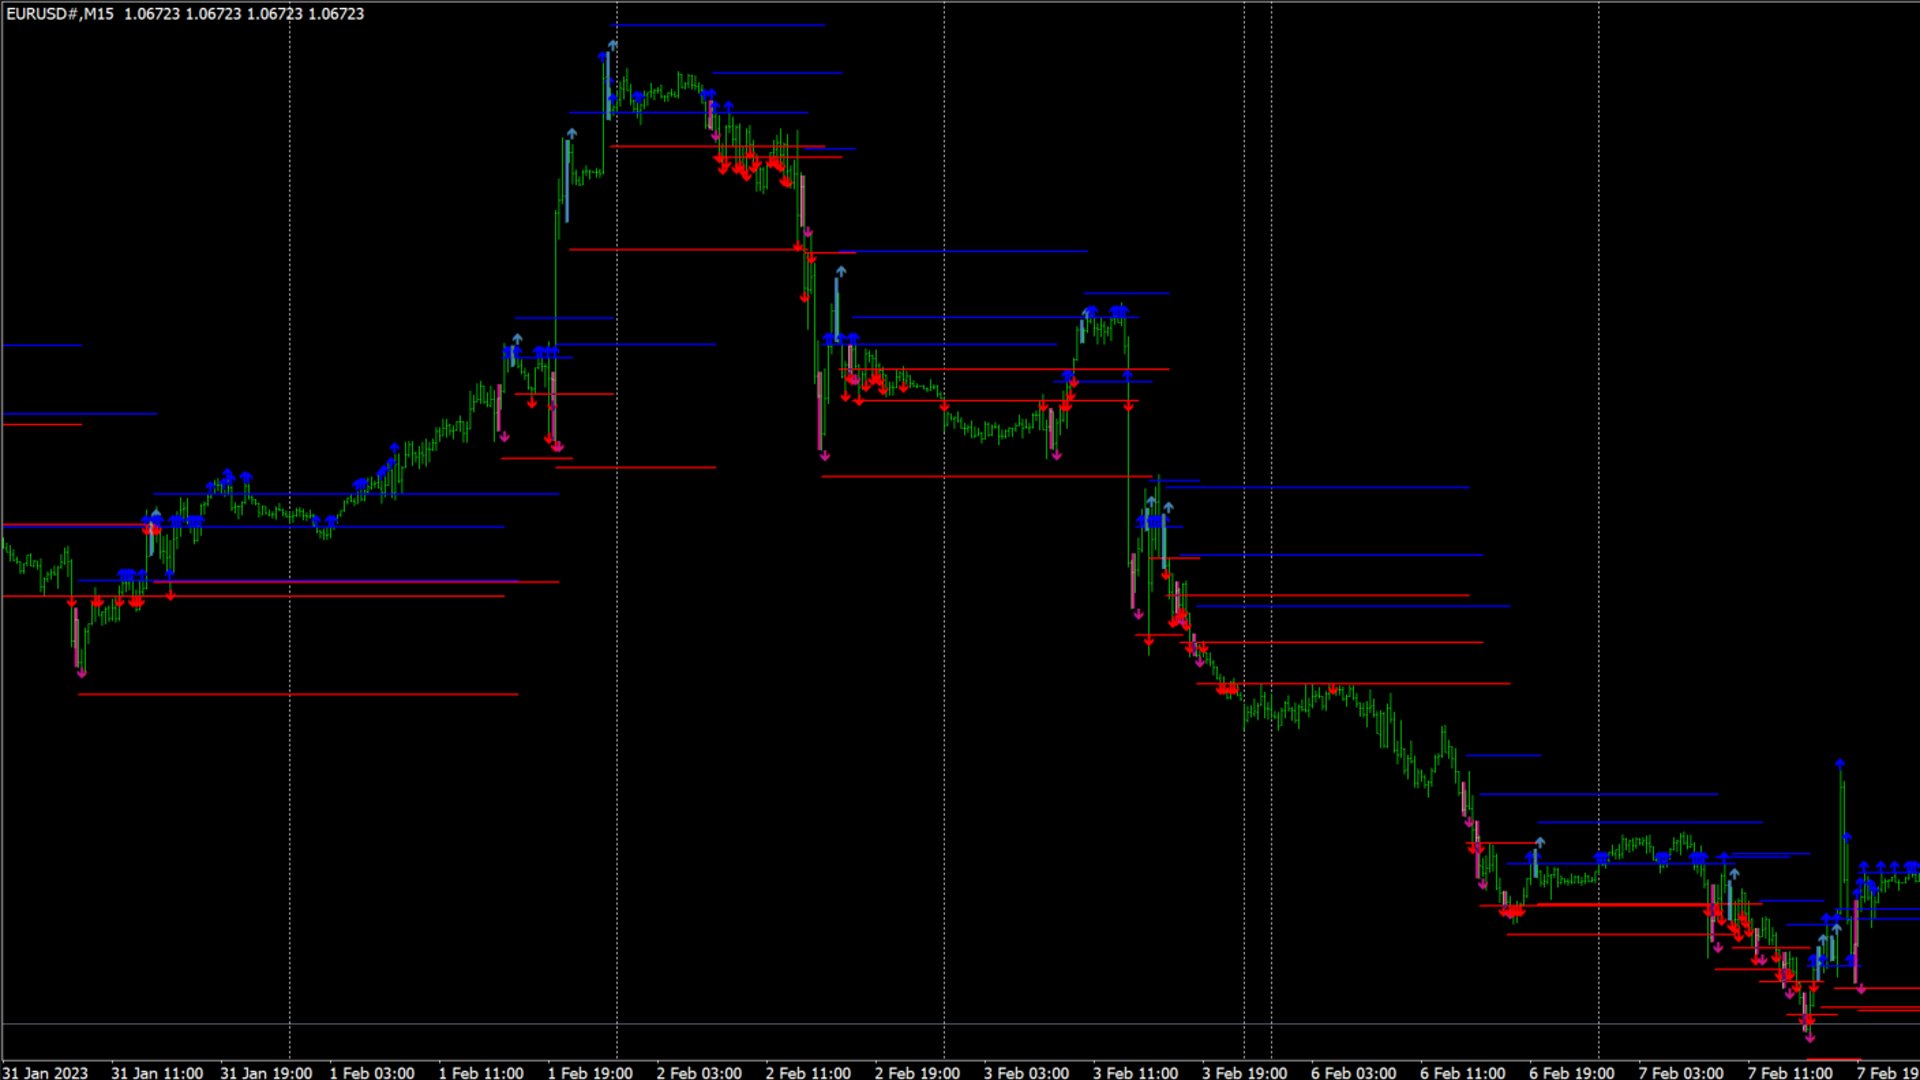
- In the picture drawn by the strategy tester, you can recognize various signals yourself:
--- Reversals
--- Level breakouts
--- Breakouts of the top and bottom
--- Support and resistance
--- Trading within a flat
--- Signals to close profits
--- Stop loss levels


The indicator can display the calculation of the senior timeframe on the junior one. For example, H4 on M15. You need to apply the indicator to the chart 2 times.

The sensitivity of the indicator depends on its settings.

The indicator can be applied to the chart more than once, with different parameters and change colors.

The chart can display all calculation blocks that help in its settings. When your strategy is ready, you can turn them off and leave only the flat boxes.

The indicator shows arrows, but you should not rush to accept them as signals to open a deal.


signals

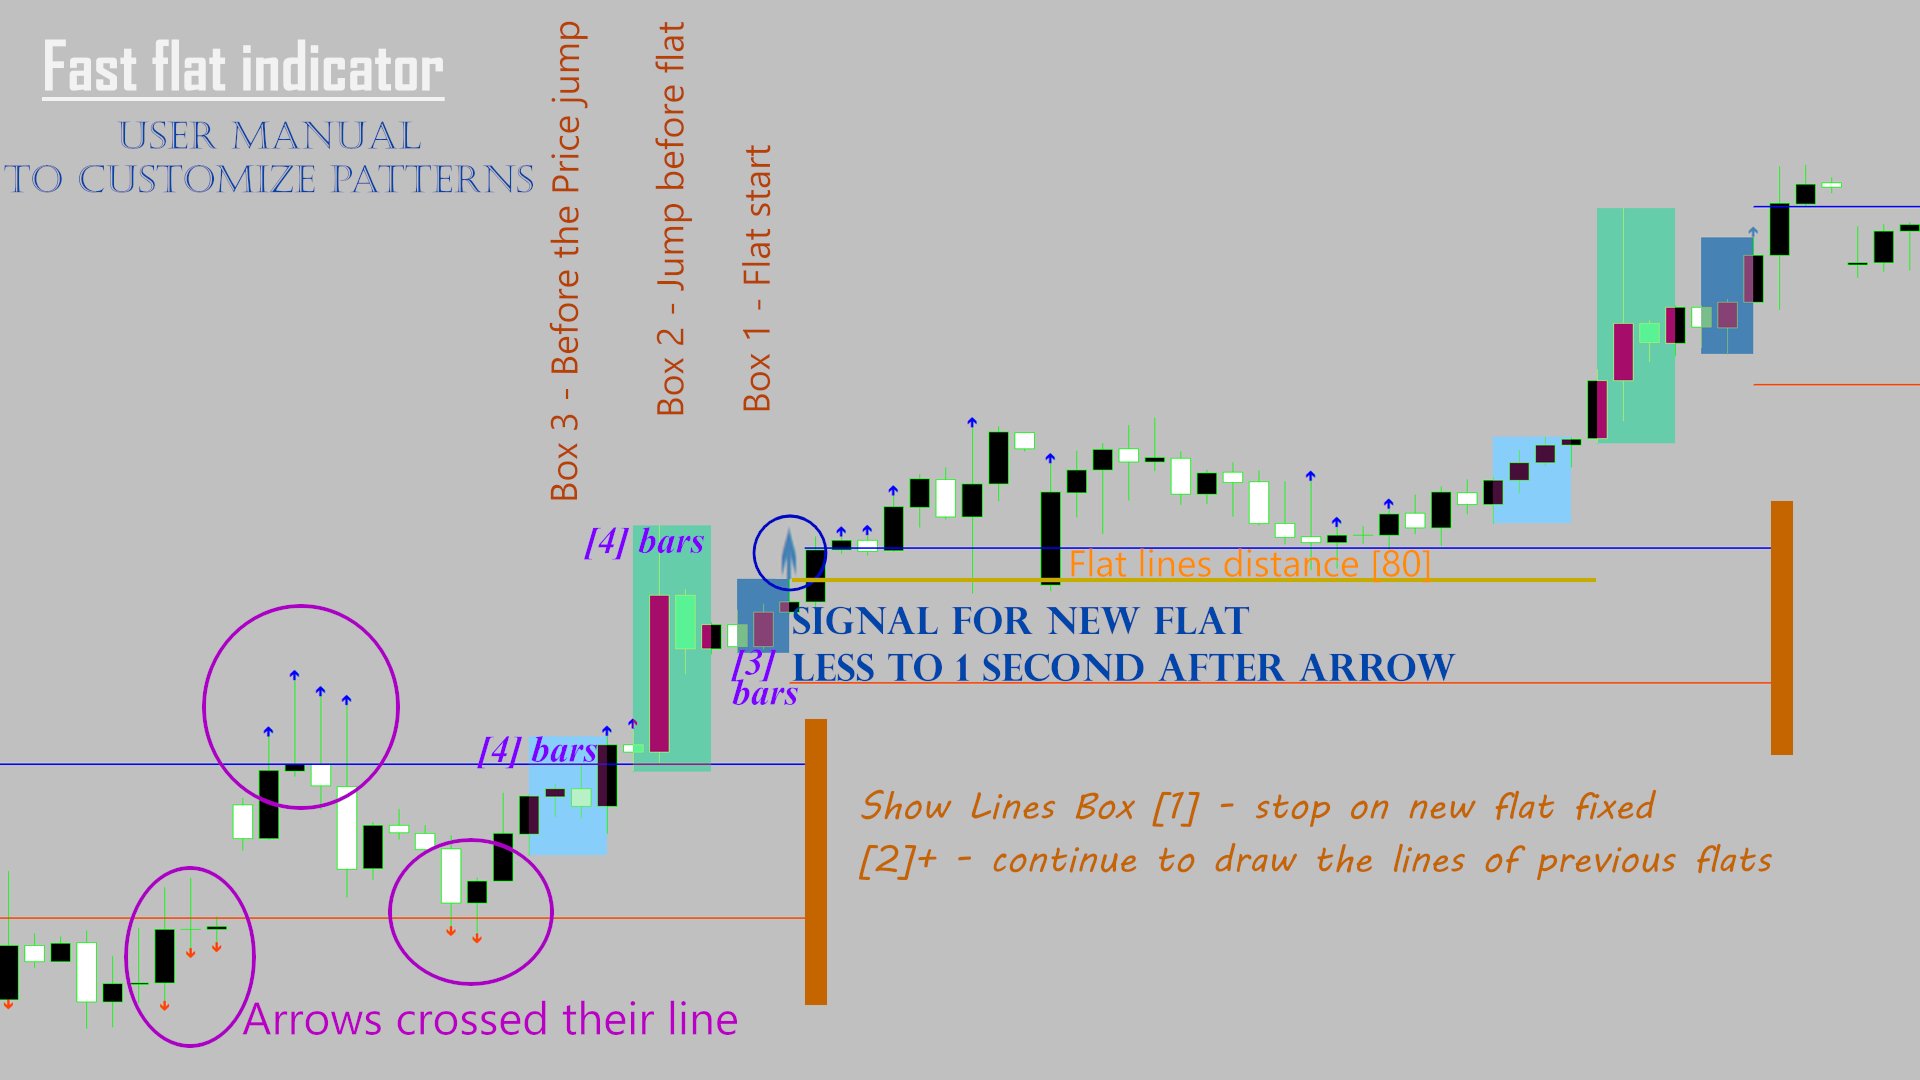
Arrows about the appearance of a new flat, which was formed from a jerk up/down. They appear at the opening of a new bar, as soon as a flat was recognized before this bar.

Lines at the bottom and top of the appeared flat, you can set the indent from the flat in points.

Arrows from lines. Appear from lines at a distance from the flat that is set in the parameters. An arrow from a line appears when the price passes the line in its direction.

Lines are drawn and continue to be drawn from [_] specified last flats. 1 Lines will be drawn only from the last flat. 100 your chart may be covered with lines and it will be more difficult to detect signals.


Fast flat parameters

------- BOX1 RIGHT - Flat box ------First block, right block, flat block. Price stop block after the calculated jerk.

Flat bars - How many bars to fix the flat. The more bars, the wider the flat. With smaller bars, you can catch a temporary price stop and a further rush or reversal.
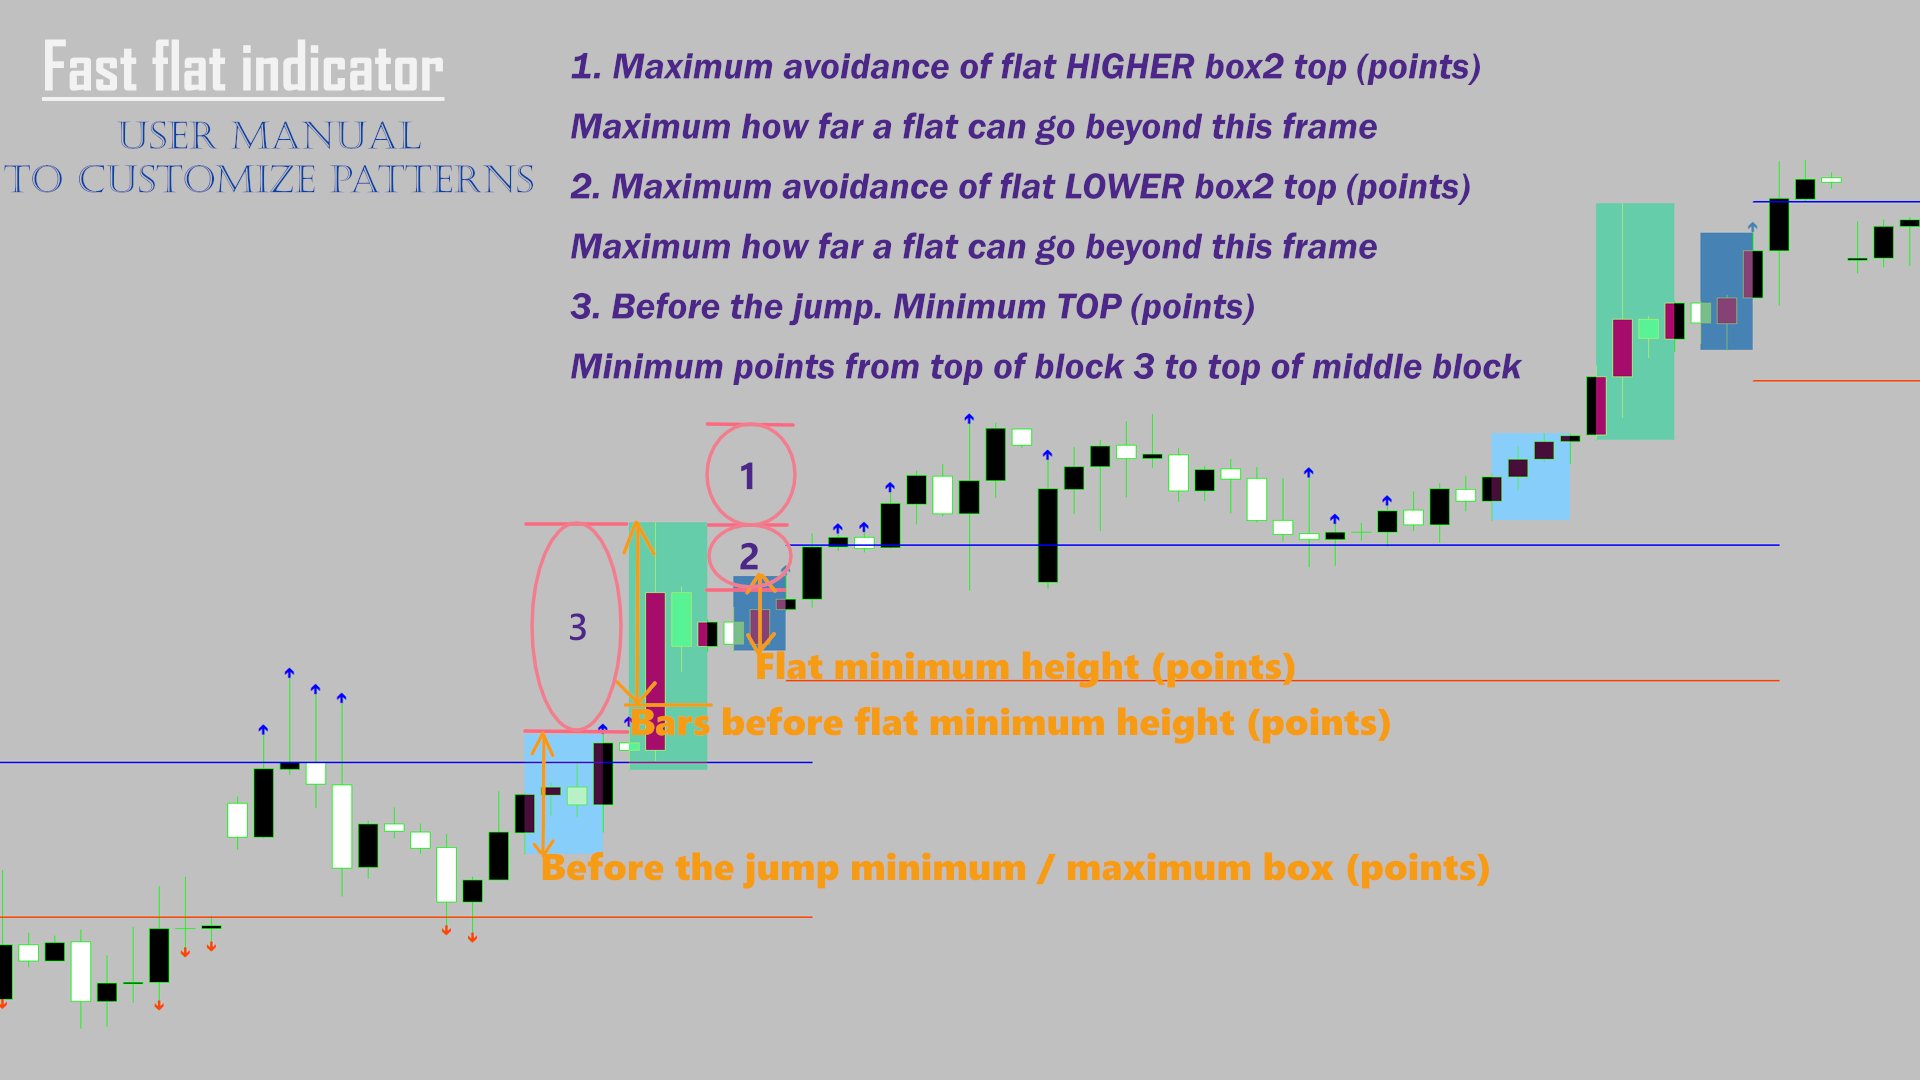
Flat minimum height (pp) - Minimum flat height, below which there will be no fixation.
Flat maximum height (pp) - Maximum flat height, no fixation will occur above it.
Excluding bars for min max height - How many bars can go beyond the flat boundaries. Have any height and break the flat higher or lower.
Shift bars find flat (0-off) - To avoid one flat on another, set how many bars after the last flat, will not display a new flat. Run the test with 0 and you will understand, maybe it suits you.

-- BOX2 MIDDLE - Jump before flat --The second block from the right. This is the block of a jump or rise, fall of the price before a flat.

Bars before flat - How many bars will be used in calculating the second block.
Bars before flat minimum height (pp) - The second block, its minimum height in points. The height of all its specified bars.
Maximum avoidance of flat HIGHER box2 top (pp) - How many points can a flat block deviate from the top of the second block upwards (for the upper flat, vice versa for the lower one).
Maximum avoidance of flat LOWER box2 top (pp) - How many points can a flat block deviate from the top of the second block downwards (for the upper flat, vice versa for the lower one).

------ BOX3 LEFT - Before jump -----The third block. Needed to resist the second block, to catch the upper flat on the rise, and the lower one on the descent.

Bars before the jump - How many bars will be involved in calculating the third block.
Before the jump minimum box (pp) - The third block, its minimum height in points. The height of all its specified bars.
Before the jump maximum box (pp) - The third block, its maximum height in points. The height of all its specified bars.
Before the jump. Minimum TOP (pp) - Minimum distance from the top of the third block to the top of the second block.
Before the jump. Price direction - The direction of the price of the third block, before the jump, the rise in the price of the second block. If you set "totop" then for the upper flat, the price of the third block went up. For the lower flat, the price of the third block went down. If you set "tobottom" then for the upper flat, the price of the third block went down. For the lower flat, the price of the third block went up.

---- Design ----

Show_Arrow_Flat - Show arrows when a new flat appears.
Show_Arrow_Line - Show arrows at line intersections.

Color box1 - Color of the upper flat.
Color box1 - Color of the lower flat.
Color box2 UP - Color of the second block up.
Color box2 DW - Color of the second block down.
Color box3 UP - Color of the third block where the price was moving upward.
Color box3 DW - Color of the third block where the price was going down.
Flat top line color - The top continuous line of the flat.
Flat bottom line color - The lower continuing line of the flat.

Flat lines distance - The distance of the upper and lower lines from the flat. Minimum 1.
Width lines distance - Width of lines from flat.
Show Lines Box - How many last flats will continue to draw lines.


Parameter Sets moved to comments

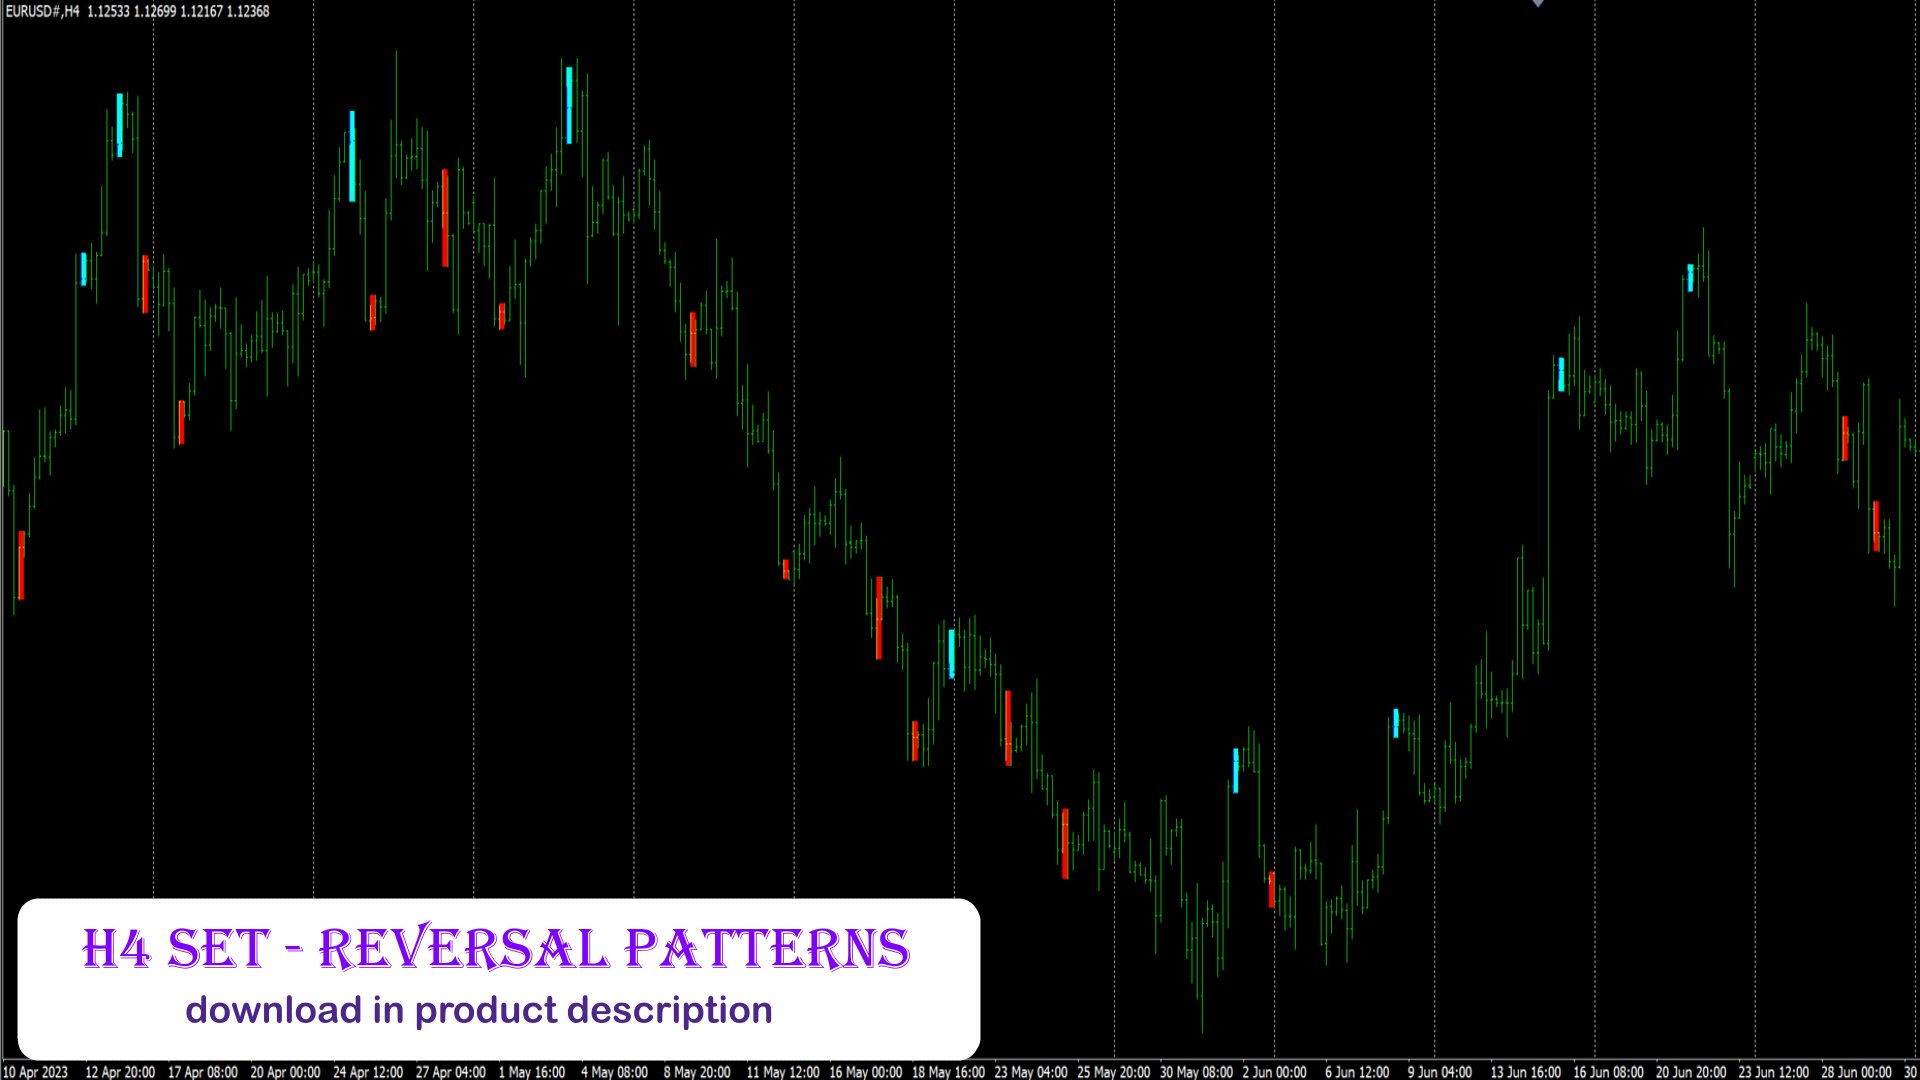
H4 set - Reversal patterns

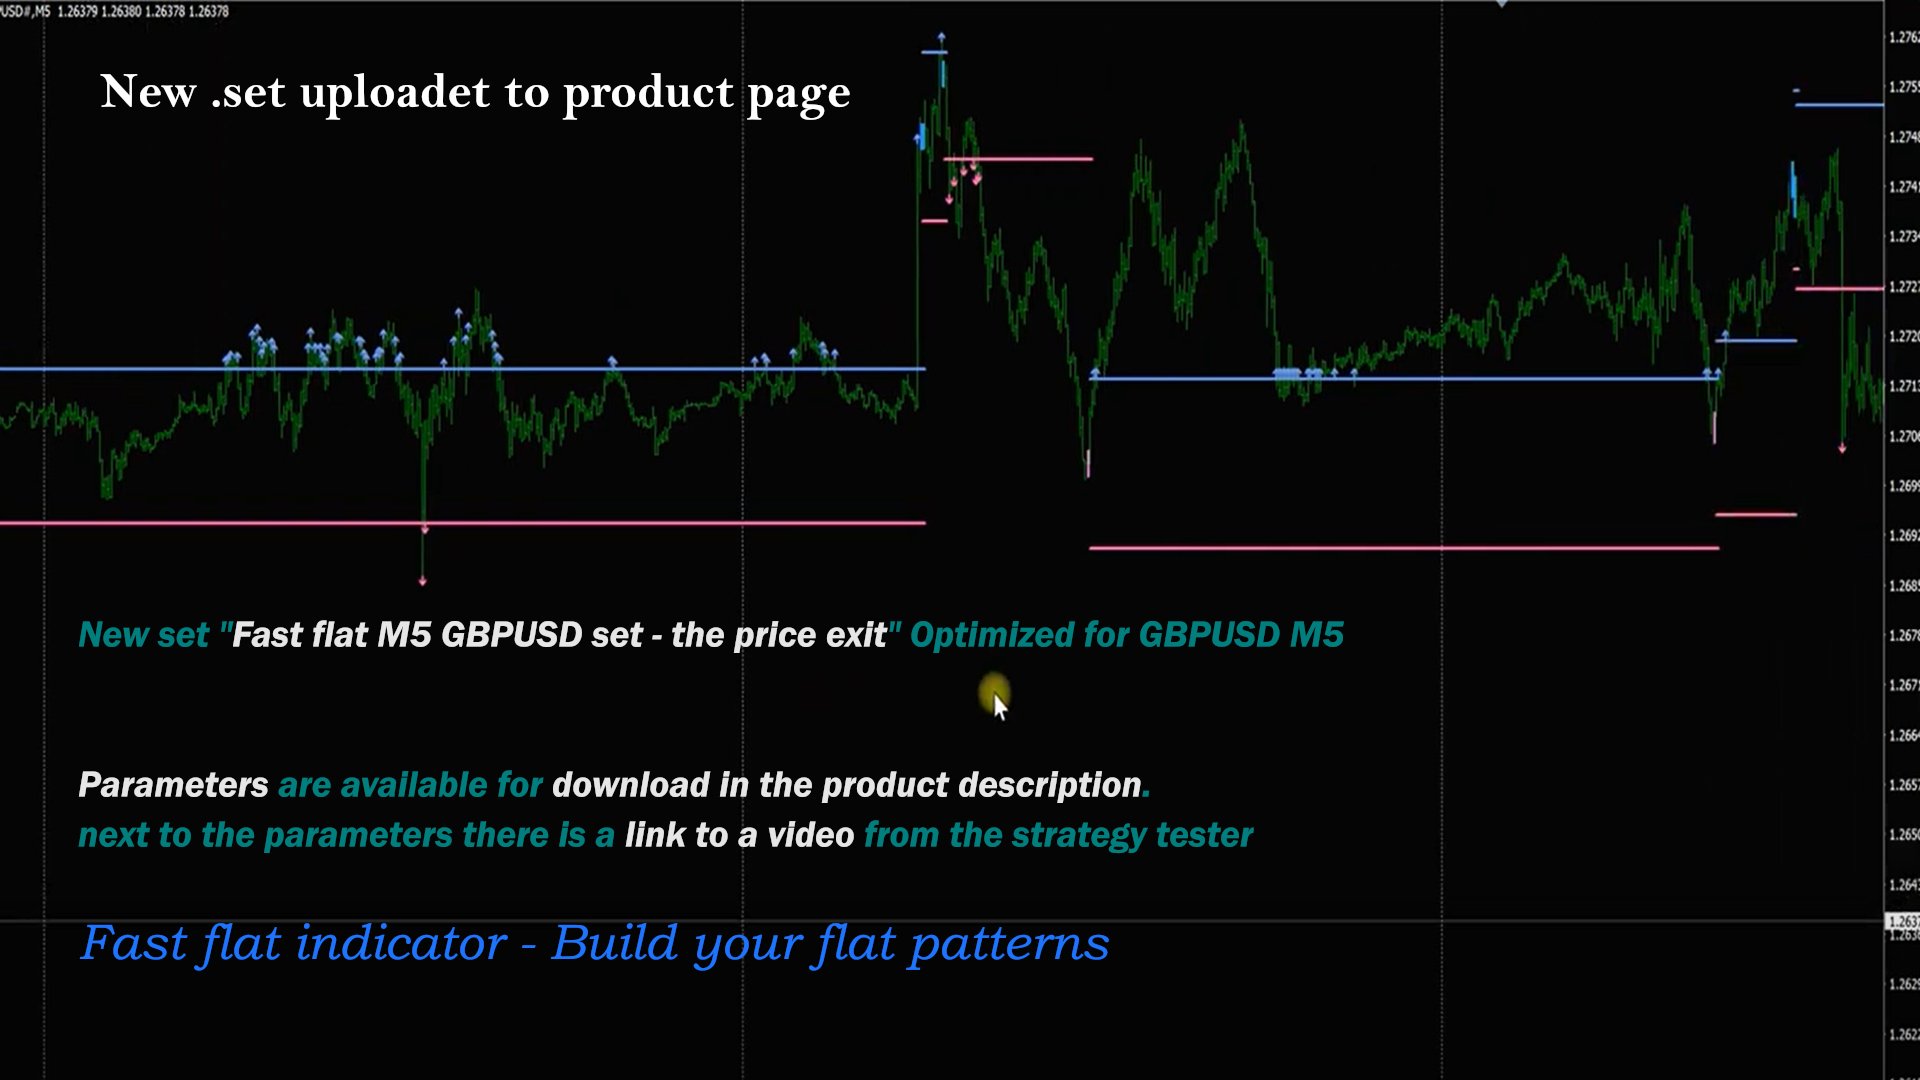
Fast flat M5 GBPUSD set - the price exit  / video

Fast flat M5 GBPUSD set - the price exit -- more signals


Buffers for auto trading

0 - Upper flat
1- Lower flat

2 - Upper flat - Upper line
4 - Upper flat - Lower line

3 - Lower flat - Upper line
5 - Lower flat - Lower line

おすすめのプロダクト
Rectangle Trading Custom   is a powerful technical analysis tool designed for price action and range-based traders. It allows users to define consolidation zones and receive alerts when the price breaks out of these zones or approaches trendlines drawn on the chart. Rectangles and Trendlines will be extended into future with one click. Rectangle point size, name and prices will be displayed around rectangle. Key Features: Draw Trading Zones (Rectangle Zones) Users can manually draw rectangles t
Boost trading system premium
Sebastian Alejandro Merino Sepulveda
No redrawing, No delay, No repainting arrows, indicator for binary options and forex IF YOU HAVE ANY QUESTIONS, CONSULTATIONS OR ACTIVATIONS OF THE INDICATORS PLEASE CONTACT ME IMMEDIATELY AT MY PERSONAL TELEGRAM When you buy this indicator you get two free indicators with binary and forex template for metatrader 4 One is a   bot   check there, it sends you signals automatically, you only execute after the signal, in favor or in reversal for FREE . The other   indicator  
Market Profile with Dashboard Indicator - Complete User Guide indicator Overview The Market Profile with Dashboard is a comprehensive trading analysis tool for MetaTrader 4 that displays market profile data, volume analysis, and key market structure information directly on your chart. This indicator helps traders identify significant price levels, market balance areas, and potential trading opportunities based on market profile theory. Core Components and Features Market Profile Display - Sh
Prosecution is a Forex arrow indicator that tracks the market trend, ignoring sharp market fluctuations and noise around the average price. The indicator is created on the basis of a special algorithm, and based on the developed algorithm, signals are created that allow you to track the trend and see its beginning and end, especially when several timeframes are combined to refine the signal. The arrows show the direction of the deal, and are colored accordingly, which can be seen in the screensh
RenkoVP
Kourosh Hossein Davallou
Overview RenkoVP is a professional tool for price structure analysis that runs fully online on the main chart. Unlike many other Renko indicators, it requires no offline charts. The indicator combines Renko bricks, volume profile, dynamic Fibonacci levels, and automatic pattern recognition to help traders identify trends, key zones, and precise entry/exit points. Renko Bricks Configuration The indicator offers both manual and automatic brick configuration: No offline chart required - runs direc
The Urgently indicator is designed to quickly determine the situation in the market, reflect the state of the market and signal profitable levels for opening trades. Market conditions change quickly enough, requiring constant calibration of trading strategies. Recommended for use in conjunction with any of the oscillators. The Urgently forex market trend indicator shows the trend direction and entry points. It smooths out price fluctuations when generating a signal by averaging the data and the
Introduction This indicator detects volume spread patterns for buy and sell opportunity. The patterns include demand and supply patterns. You might use each pattern for trading. However, these patterns are best used to detect the demand zone (=accumulation area) and supply zone (=distribution area). Demand pattern indicates generally potential buying opportunity. Supply pattern indicates generally potential selling opportunity. These are the underlying patterns rather than direct price action. T
Brief Description of the All Trend Lines Indicator The indicator analyzes the wave structure of the market. What it displays on the chart: First. Wave pivots (semaphores) • Red markers – wave highs • Yellow markers – wave lows • Yellow-green markers – additional local extremes Second. Trend lines • Purple/blue lines – trends based on highs (resistance/support) • Beige/green lines – trends based on lows • Lines are built automatically by connecting wave pivots of the same type Third. Main trend
!! FLASH SALE !!   Over 80% off !!     For ONE week only. Now only $47 - normally $297! >>>      Ends on 30 June 2023 - Don't miss it! Buy and Sell Arrows when price is about to retrace. It Also Sends Alerts – On MT4 To Your Phone To Your Email Does not repaint. Works ony any pair, any timeframe. 10 Activations allowed so you are free from limitations See an example of alerts from today (23 May 2020) using this and 2 more of my indicators  here . MT5 Version here . Spreads from 0.1pip RAW
!! FLASH SALE !!   Over 80% off !!     For ONE week only. Now only $47 - normally $297! >>>      Ends on 30 June 2023 - Don't miss it! Buy And Sell Signal Arrows On The Chart When The Price Is About To Reverse. Also Sends Alerts – On MT4 To Your Phone To Your Email. Does not repaint. Works on any pair, any timeframe.   (Just ajust the settings for your pair and timeframe.) 10 Activations allowed so you are free from limitations MT5 version here .   Spreads from 0.1pip RAW/ECN Accounts,  
If you are using volume spread analysis, whether your are a beginner or an expert, this system will give you a lot of features and help in your analysis. Please watch the video to see all the features. Features With one click you will find all the VSA patterns on your chart . Bars without opening price. Easy to read volume indicator. Bar reader (Bar type - Close type - Volume type - Spread type). Daily and weekly levels (Pivot - Camarilla - Fibo). Very light on the trading platform and moving b
The indicator allows you to trade binary options. The recommended time frame is М1 and the expiration time is 1,2,3 minutes. The indicator suitable for auto and manual trading. A possible signal is specified as a arrows above/under a candle. You should wait until the candle closes! Arrows are not re-painted Trade sessions: TOKYO section (Half-end) Currency pairs: USD/JPY Working time frame: M1 Expiration time: 1,2,3 minutes. The indicator also shows good results when using the martingale strateg
FREE
インディケータは現在のクオートを作成し、これを過去のものと比較して、これに基づいて価格変動予測を行います。インジケータには、目的の日付にすばやく移動するためのテキスト フィールドがあります。 オプション: シンボル - インジケーターが表示するシンボルの選択; SymbolPeriod - 指標がデータを取る期間の選択; IndicatorColor - インジケータの色; HorisontalShift - 指定されたバー数だけインディケータによって描画されたクオートのシフト; Inverse - true は引用符を逆にします。false - 元のビュー。 ChartVerticalShiftStep - チャートを垂直方向にシフトします (キーボードの上下矢印)。 次は日付を入力できるテキストフィールドの設定で、「Enter」を押すとすぐにジャンプできます。
便利な取引のための14のインジケーターと補助ツール このユーティリティには、トレーダーの特定の行動に役立つ14の追加ツールが含まれており、   取引プロセスを簡素化し、高速化します。 私の  #1 Trade Manager をチェックしてください: 66以上の機能とインジケーターを含む  |   ご質問はこちら  まで モニターの解像度が異なるため、一部のユーザーはラベルが重なって表示されたり、小さすぎたりする場合があります。この問題が発生した場合は、 フォントサイズを調整できます: 入力変数の最初のパラメータです。 パターンの視覚的設定が可能なプロフェッショナルなプライスアクションインジケーター。 未来のバーのインジケーター。 任意の時間軸のろうそくの終了までのカウントダウン。 バーのサイズのインジケーター。 自動サポートとレジスタンスレベル。 自動フィボナッチレベル。 ギャップインジケーター。 潜在的な利益/損失のレベル。 1つのウィンドウで複数の時間軸を表示するユーティリティ。 グローバル取引セッションのインジケーター。 オープントレードの結果を計算するユーティリティ。 市場情
Rira Renko
Vitor Palmeira Abbehusen
RENKO on Time Chart This indicator is an enhanced Renko, so you can watch the Renko bricks on the chart to understand price movement more clearly the other improvement is automated box size according to ATR (Average True Range) period you can set the ATR number as you want and the box size of Renko changes automatically based on price movement Inputs Mode: Box size is the input to specify the size of the Renko box you want to print on the chart. This input lets you choose the fixed box siz
このインジケーターは、離散ハートレー変換に基づいています。この変換を使用すると、財務時系列を処理するときにさまざまなアプローチを適用できます。このインジケーターの特徴は、その読み取り値がチャート上の1つのポイントではなく、インジケーター期間のすべてのポイントを参照していることです。 時系列を処理する場合、インジケーターを使用すると、時系列のさまざまな要素を選択できます。フィルタリングの最初の可能性は、このアプローチに基づいています。不要な高周波成分はすべて単に破棄されます。最初の図は、この方法の可能性を示しています。CutOffパラメーターを選択すると、元の時系列の詳細を選択できます(赤い線-主要な情報のみが残りますCutOff = 0、黄色-主要な最低周波数期間CutOff = 1 、青-最も高周波のノイズはすべて破棄されますCutOff = 4)。ただし、これが唯一の可能性ではありません。ノイズ成分は、追加のフィルタリングで抑制できます。 このインジケーターには両方のオプションが実装されています。そのパラメータは次のとおりです。 iPeriod-インジケーター期間 Shift-現
With the help of the Fine Market Forex indicator algorithm, you can quickly understand what kind of trend is currently developing in the market. Fine Market is a combined indicator based on several instruments. Fine Market is based on classic basic technical indicators - MA, RSI, MACD, Bollinger Bands, Stochastic. A trader does not need to impose several lines on Forex charts and set up each indicator separately. Fine Market is already successfully combined and has simplified settings, convenie
The new update makes this indicator a complete tool for studying, analyzing and operating probabilistic patterns. It includes: On-chart Multi-asset percentage monitor. Configurable martingales. Twenty-one pre-configured patterns , including Mhi patterns and C3. An advanced pattern editor to store up to 5 custom patterns. Backtest mode to test results with loss reports. Trend filter. Hit operational filter. Martingale Cycles option. Various types of strategies and alerts. Confluence between patte
Fibonacci BB Breakout Indicator is a powerful MT4 tool that automatically detects Bollinger Bands breakouts and draws Fibonacci extension levels as trend lines on your chart. It simplifies trading by highlighting potential support, resistance, and target zones after strong moves, with customizable alerts and an info panel for quick status checks.  Key Features - Automatic Breakout Detection: Spots bullish (price closes above upper BB) or bearish (below lower BB) breakouts on the previous close
The SPV Volatility indicator is one of the most effective filters. Volatility filter. Shows three volatility options. The so-called limit, real, and the last most effective filter for the filter is the percentage filter. Percentage display of folatility shows the ratio of limit to real volatility. And thus, if we trade in the middle of the channel, then it is necessary to set a condition that the percentage is less than a certain indicator value. If we trade on the channel breakout - following t
PDP indicator is used for: defining price probability distributions. This allows for a detailed representation of the channel and its borders and forecast the probability of a price appearing at each segment of its fluctuations; defining the channel change moment. Operation principles and features PDP analyzes a quote history on lower timeframes and calculates a price probability distribution on higher ones. Forecast algorithms allow the indicator to calculate probability distributions and mov
Floating peaks oscillator - it the manual trading system. It's based on Stochastik/RSI type of oscillator with dynamic/floating  overbought and oversold levels. When main line is green - market is under bullish pressure, when main line is red - market is under bearish pressure. Buy arrow appears at the floating bottom and sell arrow appears at floating top. Indicator allows to reverse signal types. Main indicator's adjustable inputs : mainTrendPeriod; signalTrendPeriod; smoothedTrendPeriod; tre
SMC Venom Model BPR インジケーターは、スマート マネー (SMC) コンセプトで取引するトレーダー向けのプロフェッショナル ツールです。価格チャート上の 2 つの主要なパターンを自動的に識別します。 FVG   (フェアバリューギャップ) は、3 本のローソク足の組み合わせで、最初のローソク足と 3 番目のローソク足の間にギャップがあります。ボリュームサポートのないレベル間のゾーンを形成し、価格修正につながることがよくあります。 BPR   (バランス価格範囲) は、2 つの FVG パターンの組み合わせで、「ブリッジ」を形成します。これは、価格がボリュームアクティビティの少ない動きで動くときに、ブレイクアウトしてレベルに戻るゾーンで、ローソク足の間にギャップを作成します。 これらのパターンは、大規模な市場プレーヤーと一般参加者の相互作用が発生するチャート上のボリュームと価格動向の分析に基づいて、トレーダーが主要なサポート/レジスタンス レベル、ブレイクアウト ゾーン、エントリ ポイントを識別するのに役立ちます。 インジケーターは、長方形と矢印の形でパターンを視
Become a constantly profitable 5-star forex trader!  We offer a few indicators to support you understand and analyse the market! With our strategies you will improve your trading system and bacome an expert... We have indicators for trend direction, market direction and others.. for multi-time frames and that covers all majors or your favorite trading symbols! Some of them offer a customizable calculation parameters... or Graph features! See how powerful they are! The are also easy-to-use t
AWキャンドルパターンインジケーターは、強力なキャンドルパターンスキャナーと組み合わせた高度なトレンドインジケーターの組み合わせです。これは、最も信頼性の高い30のローソク足パターンを認識して強調表示するための便利なツールです。さらに、それは色付きのバーに基づく現在の傾向分析器です。     サイズ変更と配置が可能なプラグインマルチタイムフレームトレンドパネル。トレンドフィルタリングに応じてパターンの表示を調整する独自の機能。 利点: キャンドルパターンを簡単に識別 結果を再描画しません 内蔵のマルチタイムトレンドパネル 無効なパターンタイプ(1、2、3キャンドル) パターン表示時のトレンドフィルタリングの調整 MT5 version - >   HERE   / Instructions and description  -> HERE 表示されるパターンのリスト: ハンマーパターン ピンアップ/ピンダウン 弱気なハラミ/強気なハラミ 弱気のハラミクロス/強気のハラミクロス ピボットポイント反転アップ/ピボットポイント反転ダウン ダブルバーローとハイクローズ/ダブルバーローとロークロ
This indicator XX Power indicator.Indicator displays trend movement. Indicator helps to buy and sell.In dicator displays arrow and line. Features FiltPer - displays indicator period. How to understand the status:   If the Trend color is green, trend is up. I f the Trend color is red, trend is down.    //////////////////////////////////////////////////////////////////////////////////////////////////////////////////////////////////////////////////// ////////////////////////////////////////////
Crypto_Forex MT4用インジケーター「ATRトレーリングストップ」(リペイント不要) - MT4用の優れた補助インジケーターATRトレーリングストップで、トレード手法をアップグレードしましょう。 - このインジケーターはトレーリングストップに最適です。 - ATRトレーリングストップは、市場のボラティリティに自動的に適応します。 - 遅延がなく、簡単に設定できます。 - このインジケーターは、主要トレンドの方向へのプライスアクションエントリーと組み合わせるのに最適です。 // 優れたトレードロボットとインジケーターは、こちらから入手できます: https://www.mql5.com/en/users/def1380/seller これは、このMQL5ウェブサイトでのみ提供されるオリジナル製品です。
Implementation of indication of trend movement with moments for potential stops in the Cloud Power indicator. The transition to the shadow warns of a possible reversal. The entry of the price inside the shadow speaks of a flat movement. The indicator tracks the market trend with unmatched reliability, ignoring sharp market fluctuations and noise around the average price. Simple, visual and efficient use. The indicator does not redraw and does not lag. It can be easily used as an independent t
REMINDER: Early buyers hot price discount: Price subject to rise after first 20 copies. Starting price $65 and final price will be $1275. Secure your discounted copy Now! Smart Money Analyser Indicator User Manual 1. Introduction Welcome to the   Smart Money Analyser Indicator This powerful tool provides traders with comprehensive market analysis by combining various technical indicators to generate actionable trading signals. Designed to be user-friendly, this indicator helps traders of all
ADM Oscillator Multiframe Unlike the classic indicator " Average Direction Movement index ", this indicator shows directly the difference between the +DI and -DI values. When +DI is greater than -DI results above zero and vice versa. This is more visual and, in addition, allows you to clearly see the interaction of indicator readings for different timeframes. It also uses a proprietary technology that allows you to see different timeframes simultaneously on a single time scale. For example, fo
このプロダクトを購入した人は以下も購入しています
Gann Made Easy は、ミスター・ギャンの理論を使用した取引の最良の原則に基づいた、プロフェッショナルで使いやすい外国為替取引システムです。 W・D・ガン。このインジケーターは、ストップロスとテイクプロフィットレベルを含む正確な買いと売りのシグナルを提供します。 PUSH通知を利用して外出先でも取引可能です。 購入後に私に連絡して、取引のヒント、ボーナス、および「GANN MADE EASY」EA アシスタントを無料で入手してください。 おそらく、ギャンの取引手法についてはすでに何度も聞いたことがあるでしょう。通常、ギャンの理論は初心者のトレーダーだけでなく、すでにある程度の取引経験がある人にとっても非常に複雑なものです。なぜなら、ギャンの取引手法は理論的にはそれほど簡単に適用できるものではないからです。私はその知識を磨き、最良の原則を私の外国為替インジケーターに組み込むために数年を費やしました。 このインジケーターは非常に簡単に適用できます。必要なのは、それをチャートに添付し、簡単な取引推奨事項に従うだけです。このインジケーターは常に市場分析の仕事を行い、取引の機会を探しま
An exclusive indicator that utilizes an innovative algorithm to swiftly and accurately determine the market trend. The indicator automatically calculates opening, closing, and profit levels, providing detailed trading statistics. With these features, you can choose the most appropriate trading instrument for the current market conditions. Additionally, you can easily integrate your own arrow indicators into Scalper Inside Pro to quickly evaluate their statistics and profitability. Scalper Inside
Game Changerは、あらゆる金融商品で使用できる革新的なトレンドインジケーターです。MetaTraderを強力なトレンドアナライザーへと変貌させます。あらゆる時間枠で動作し、トレンドの特定、反転の可能性のシグナル、トレーリングストップ機能、そして迅速な市場反応のためのリアルタイムアラートを提供します。経験豊富なプロでも、優位性を求める初心者でも、このツールは自信と規律、そして根本的なトレンドダイナミクスを明確に理解した上で取引を行うための力となります。このインジケーターはリドロー機能も備えています。 購入後すぐにご連絡いただければ、個人ボーナスを進呈いたします。Strong SupportとTrend Scannerインジケーターの無料コピーを入手できます。[email protected]までプライベートメッセージを送ってください。 私のEAや特別なセットはTelegramでは販売しておりません。MQL5でのみ販売しており、セットファイルは私のブログでのみ公開しています。詐欺師にはご注意ください。他の方からセットを購入しないでください。 設定 トレンド変化時のアラート
GOLD Impulse with Alert
Bernhard Schweigert
4.64 (11)
このインディケータは、当社の2つの製品 Advanced Currency IMPULSE with ALERT  +   Currency Strength Exotics . のスーパーコンビネーションです。 このインジケーターは全ての時間枠で作動し、8つの主要通貨と1つのシンボルの強弱のインパルスをグラフで表示します。 このインジケータは、金、エキゾチックペア、商品、インデックス、先物など、あらゆるシンボルの通貨強度の加速度を表示することに特化されています。金、銀、原油、DAX、US30、MXN、TRY、CNHなどの通貨強度の加速度(インパルスまたは速度)を表示するために、任意のシンボルを9行目に追加できる、この種の最初のものです。 新しいアルゴリズムに基づいて構築され、潜在的な取引の特定と確認がさらに容易になりました。これは、通貨の強さや弱さが加速しているかどうかをグラフィカルに表示し、その加速の速度を測定するためです。加速すると物事は明らかに速く進みますが、これはFX市場でも同じです。つまり、反対方向に加速している通貨をペアリングすれば、潜在的に利益を生む取引を特定
Miraculous Indicator – ガン・スクエア・オブ・ナインに基づく100%非リペイントのFXおよびバイナリーツール この動画では、FXおよびバイナリーオプションのトレーダー向けに特別に開発された、非常に正確で強力な取引ツールである Miraculous Indicator を紹介しています。このインジケーターがユニークなのは、伝説的な ガン・スクエア・オブ・ナイン と ガンの振動の法則 に基づいている点で、現代の取引で利用できる最も正確な予測ツールの一つとなっています。 Miraculous Indicatorは 完全に非リペイント であり、ローソク足が確定した後にシグナルが変化したり消えたりすることはありません。つまり、見たものがそのまま利用できます。これにより、トレーダーは自信を持ってエントリーおよびエグジットを行うための信頼性と一貫性のある根拠を得ることができます。 主な特徴: ガン・スクエア・オブ・ナインとガン理論に基づいて構築 100%非リペイントのシグナルシステム すべての時間枠(M1、M5、H1、H4、日足、週足)で機能 FXおよびバイナリーオプション取引
このインジケーターは、反転ポイントと価格戻りゾーンを正確に表示します。     主要プレーヤー 。新たなトレンドが形成される場所を把握し、最大限の精度で意思決定を行い、すべての取引をコントロールします。 TREND LINES PRO インジケーターと組み合わせることで、その潜在能力を最大限に発揮します。 VERSION MT5 インジケーターが示す内容: 新しいトレンドの始まりに活性化する反転構造と反転レベル。 リスクと報酬の比率を最小限に抑えた利益 確定 と 損失停止の レベルの表示     RR 1:2   。 インテリジェントな削減ロジックによるストップロス。 指定されたインジケーターから 2 つのトレンド タイプの反転パターンを表示します。 指標: トレンドを追う   TREND LINES PRO   (世界的なトレンドの変化) TREND PRO   (クイックトレンド変更) シンプルで効果的   スキャナー   リアルタイムトレンド(新機能)。 マルチタイムフレームのインストゥルメント フィルタリング。 画面   利益     LOGIC AI信号の後。 当日プラス方
M1 SNIPER は使いやすいトレーディングインジケーターシステムです。M1時間足向けに設計された矢印インジケーターです。M1時間足でのスキャルピングのためのスタンドアロンシステムとして、また既存のトレーディングシステムの一部としても使用できます。このトレーディングシステムはM1時間足での取引に特化して設計されていますが、他の時間足でも使用できます。元々、この手法はXAUUSDとBTCUSDの取引用に設計しましたが、他の市場においても役立つと考えています。 インジケーターのシグナルは、トレンドの方向と逆方向に取引できます。インジケーターのシグナルを利用して両方向に取引するのに役立つ特別な取引テクニックをご紹介します。この手法は、特別な動的なサポートとレジスタンスの価格帯を利用することに基づいています。 ご購入後、M1 SNIPER矢印インジケーターをすぐにダウンロードできます。さらに、M1 SNIPERツールのすべてのユーザーに、以下のスクリーンショットに表示されているApollo Dynamic SRインジケーターを無料で提供しています。この2つのインジケーターを組み合わせることで
Dynamic Forex28 Navigator - 次世代の Forex 取引ツール。 現在 49% オフ。 Dynamic Forex28 Navigator は、長年人気のインジケーターを進化させたもので、3 つの機能を 1 つにまとめています。 Advanced Currency Strength28 インジケーター (レビュー 695 件)  + Advanced Currency IMPULSE with ALERT (レビュー 520 件) + CS28 コンボ シグナル (ボーナス)。 インジケーターの詳細 https://www.mql5.com/en/blogs/post/758844 次世代の Strength インジケーターが提供するもの  オリジナルで気に入っていたすべての機能が、新機能と精度の向上によって強化されました。 主な機能: 独自の通貨強度計算式。 すべての時間枠でスムーズかつ正確な強度ライン。 トレンドの特定と正確なエントリーに最適です。 ダイナミックマーケットフィボナッチレベル (マーケットフィボナッチ)。 このインジケーターに固有
Precautions for subscribing to indicator This indicator only supports the computer version of MT4 Does not support MT5, mobile phones, tablets The indicator only shows the day's entry arrow The previous history arrow will not be displayed (Live broadcast is for demonstration) The indicator is a trading aid Is not a EA automatic trading No copy trading function The indicator only indicates the entry position No exit (target profit)  The entry stop loss point is set at 30-50 PIPS Or the front hi
通貨強さウィザードは、取引を成功させるためのオールインワン ソリューションを提供する非常に強力な指標です。このインジケーターは、複数の時間枠のすべての通貨のデータを使用して、このまたはその外国為替ペアのパワーを計算します。このデータは、使いやすい通貨インデックスと通貨パワーラインの形式で表され、特定の通貨のパワーを確認するために使用できます。 必要なのは、取引したいチャートにインジケーターを接続することだけです。インジケーターは、取引する通貨の実際の強さを示します。このインジケーターは、トレンドに合わせて取引するときに有利に利用できる売買高の圧力の極値も示します。このインジケーターには、フィボナッチに基づく可能なターゲットも表示されます。 このインジケーターは、PUSH 通知を含むあらゆるタイプのアラートを提供します。 購入後ご連絡下さい。私の取引のヒントをあなたと共有し、素晴らしいボーナスインジケーターを無料で提供します! 幸せで有益な取引をお祈りします。
トレンドラインプロ   市場の真の方向転換点を理解するのに役立ちます。この指標は、真のトレンド反転と主要プレーヤーが再び参入するポイントを示します。 分かりますか     BOSライン   複雑な設定や不要なノイズなしに、より長い時間足でのトレンドの変化と重要なレベルを把握できます。シグナルは再描画されず、バーが閉じた後もチャート上に残ります。 VERSION MT 5     -     RFI LEVELS PRO インジケーター と組み合わせることで、その潜在能力を最大限に発揮します。 インジケーターが示す内容: 本当の変化   トレンド(BOSライン) 一度シグナルが現れたら、それは有効です!これは、リペイント機能を持つインジケーターとの重要な違いです。リペイント機能を持つインジケーターは、シグナルを発した後、それを変更し、資金の損失につながる可能性があります。これにより、より高い確率と精度で市場に参入できます。また、矢印が現れた後、目標値(利益確定)に達するか、反転シグナルが現れるまで、ローソク足の色を変更する機能もあります。 繰り返しエントリ       主要プレーヤーの
現在40%OFF! 初心者やエキスパートトレーダーのためのベストソリューション! このダッシュボードソフトウェアは、28の通貨ペアで動作しています。それは私達の主要な指標(高度な通貨の強さ28と高度な通貨インパルス)の2に基づいています。それは全体の外国為替市場の大きい概観を与えます。それは、すべての(9)時間枠で28の外国為替ペアのための高度な通貨の強さの値、通貨の動きの速度と信号を示しています。チャート上で1つのインディケータを使用して市場全体を観察し、トレンドやスキャルピングの機会をピンポイントで見つけることができたら、あなたのトレードがどのように改善されるか想像してみてください。 このインディケータには、強い通貨と弱い通貨の識別、潜在的な取引の識別と確認がより簡単になるような機能が搭載されています。このインディケータは、通貨の強さや弱さが増加しているか減少しているか、また、すべての時間枠でどのように機能しているかをグラフィカルに表示します。 新機能として、現在の市場環境の変化に適応するダイナミックなマーケットフィボナッチレベルが追加され、すでに当社のAdvanced
Volatility Trend System - a trading system that gives signals for entries. The volatility system gives linear and point signals in the direction of the trend, as well as signals to exit it, without redrawing and delays. The trend indicator monitors the direction of the medium-term trend, shows the direction and its change. The signal indicator is based on changes in volatility and shows market entries. The indicator is equipped with several types of alerts. Can be applied to various trading ins
現在20%OFF! 初心者やエキスパートトレーダーに最適なソリューションです。 このインディケータは、エキゾチックペア・コモディティ・インデックス・先物など、あらゆるシンボルの通貨の強さを表示することに特化したインディケータです。金、銀、原油、DAX、US30、MXN、TRY、CNHなどの通貨の強さを表示するために、9行目にどのシンボルでも追加することができます。独自の機能を多数搭載し、新しい計算式を採用したため、ユニークで高品質、かつ手頃な価格のトレーディングツールとなっています。新しいトレンドやスキャルピングチャンスのトリガーポイントを正確に把握することができるため、あなたのトレードがどのように改善されるか想像してみてください。 ユーザーマニュアル:ここをクリック   https://www.mql5.com/en/blogs/post/708876 すべての時間枠に対応します。あなたはすぐにトレンドを見ることができるようになります! 新しいアルゴリズムに基づいて設計されているため、潜在的な取引の特定と確認がより簡単になります。これは、8つの主要通貨と1つのシンボルの強弱
Gold Scalper Super is an easy-to-use trading system. The indicator can be used as a standalone scalping system on the M1 time frame, as well as part of your existing trading system. Bonus: when purchasing an indicator, Trend Arrow Super is provided free of charge, write to us after purchase. The indicator 100% does not repaint!!! If a signal appears, it does not disappear! Unlike indicators with redrawing, which lead to the loss of a deposit, because they can show a signal and then remove it.
Smart Sweep Sniper MT4
Vincent Georges David Ferrier
# Smart Sweep Sniper MT4 Version MT4 Midnight Pro Edition , specialized for scalping and day trading in Prop Firm, Available here MT5 Version available here ## The Institutional Edge — Detect Where Smart Money Acts, Enter When It Matters If you like it, leave a positive review to support its development. If you encounter a bug, let us know before posting a review. When you complete your challenge, share your certificate in the comments. Happy trading! Smart Sweep Sniper is a precision-engine
Looking for a powerful yet lightweight swing detector that accurately identifies market structure turning points? Want clear, reliable buy and sell signals that work across any timeframe and any instrument? Buy Sell Arrow MT Swing is built exactly for that — precision swing detection made simple and effective. This indicator identifies Higher Highs (HH) , Higher Lows (HL) , Lower Highs (LH) , and Lower Lows (LL) with remarkable clarity. It is designed to help traders easily visualize market stru
FX Volume
Daniel Stein
4.63 (38)
FX Volume:ブローカー視点で捉える本物の市場センチメント クイック概要 トレード手法をさらに高めたいとお考えですか? FX Volume は、リテールトレーダーやブローカーのポジション状況をリアルタイムで提供します。これは、COTのような遅延レポートよりもはるかに早く知ることができます。安定した利益を目指す方も、さらなる優位性を求める方も、 FX Volume は大きな不均衡を見極め、ブレイクアウトを確認し、リスク管理を洗練させるのに役立ちます。今すぐ始めて、実際の出来高データがどのように意思決定を変革するかを体感してください! 1. FX Volume がトレーダーにとって非常に有益な理由 高精度の早期警戒シグナル • 各通貨ペアを売買しているトレーダー数を、他者よりも早く、ほぼリアルタイムで把握できます。 • FX Volume は、複数のリテールブローカーから得られる本物の出来高データを収集し、分かりやすい形式で提供する 唯一 のツールです。 強力なリスク管理 • ロングやショートの大きな偏り(インバランス)を特定し、潜在的なトレンド転換を見逃しません。ストップ
Presenting one-of-a-kind Gann Indicator for XAUUSD IQ Gold Gann Levels is a non-repainting, precision tool designed exclusively for XAUUSD/Gold intraday trading. It uses W.D. Gann’s square root method to plot real-time support and resistance levels, helping traders spot high-probability entries with confidence and clarity. William Delbert Gann (W.D. Gann) was an exceptional market analyst whose trading technique was based on a complex blend of mathematics, geometry, astrology, and ancient calcul
PRO Renko Systemは、特別にRENKOチャートを取引するために設計された高精度の取引システムです。 これは、様々な取引商品に適用することができる普遍的なシステムです。 システムは効果的に正確な逆転信号へのアクセスを与えるいわゆる市場の騒音を中和する。 表示器は非常に使いやすく、信号の生成に責任がある1つの変数だけがあります。 あなたは簡単にお好みの任意の取引ツールとレンコバーのサイズにツールを適応させることができます。 私はいつもあなたが私のソフトウェアで収益性の高い取引を支援するために余分なサポートを提供する準備ができています! 私はあなたに幸せで収益性の高い取引をしたいです! ご購入後にご連絡ください! 私はあなたに私のレンコチャートジェネレータを送信します。 私はまた、私の個人的な推奨事項やシステムの他のモジュールを無料で共有します!
まず第一に、この取引インジケーターは再描画されず、再描画されず、遅延しないことを強調する価値があります。これにより、手動取引とロボット取引の両方に理想的なものになります。 ユーザーマニュアル:設定、入力、戦略。 アトミックアナリストは、価格の強さとモメンタムを利用して市場でより良いエッジを見つけるためのPA価格アクションインジケーターです。ノイズや誤ったシグナルを除去し、取引ポテンシャルを高めるための高度なフィルターを備えています。複雑なインジケーターの複数のレイヤーを使用して、アトミックアナリストはチャートをスキャンし、複雑な数学的計算をシンプルなシグナルと色に変換します。これにより、どのような初心者トレーダーでも理解して使用し、一貫した取引の決定を行うことができます。 「アトミックアナリスト」は、新規および経験豊富なトレーダー向けにカスタマイズされた包括的な取引ソリューションです。プレミアムインジケーターとトップノッチの機能を1つの取引戦略に組み合わせ、すべてのタイプのトレーダーにとって汎用性のある選択肢にします。 デイリートレーディングとスキャルピング戦略:高速で正確な
El indicador "MR BEAST ALERTAS DE LIQUIDEZ" es una herramienta avanzada diseñada para proporcionar señales y alertas sobre la liquidez del mercado basándose en una serie de indicadores técnicos y análisis de tendencias. Ideal para traders que buscan oportunidades de trading en función de la dinámica de precios y los niveles de volatilidad, este indicador ofrece una visualización clara y detallada en la ventana del gráfico de MetaTrader. Características Principales: Canal ATR Adaptativo: Calcula
Pips Stalker
Abdulkarim Karazon
5 (2)
Pips Stalkerはロングショートアロータイプのインジケーターで、あらゆるレベルのトレーダーがより良い意思決定を行えるようにサポートします。インジケーターはリペイントされず、RSIを主なシグナルロジックとして用い、一度矢印が出されるとリペイントやバックペイントはなく、矢印の遅延もありません。 PIPS STALKER ARROWの特徴 : スタッツパネル は、全体の勝率%や連続の最大勝敗トレード数などの有用な統計、その他有用な情報を表示するユニークな情報ダッシュボードです。 TPとSL、組み込みのマネーマネジメント 指標は各矢印でTPとSLのオブジェクトを示し、トレーダーはマネーとリスク管理を組み込み、SLはATRに基づいて、TPは現在のATR SL価値に基づくリスク対リターン比率に基づいています。 再塗装不要、高い調整可能性 インジケーターはシグナル品質向上のオプションを豊富に提供しており、わずかな期間調整だけでどのペアでも機能します。パネルはトレーダーに現在の設定や期間が利益を上げているかどうかを示します。推奨期間枠:M1。 再調整開始資本金:100ドル。 推奨アカ
IQ FX Gann Levels a precision trading indicator based on W.D. Gann’s square root methods . It plots real-time, non-repainting support and resistance levels to help traders confidently spot intraday and scalping opportunities with high accuracy. William Delbert Gann (W.D. Gann) was an exceptional market analyst, whose trading technique was based on a complex blend of mathematics, geometry, astrology, and ancient mathematics which proved to be extremely accurate. Setup & Guide:  Download  MT5 Ver
FX Power: 通貨の強弱を分析して、より賢い取引を実現 概要 FX Power は主要通貨と金の実際の強弱をあらゆる市場状況で理解するための必須ツールです。強い通貨を買い、弱い通貨を売ることで、 FX Power は取引の意思決定を簡素化し、高い確率の取引機会を見出します。トレンドを追従する場合でも、極端なデルタ値を使用して反転を予測する場合でも、このツールはあなたの取引スタイルに完全に適応します。ただ取引するだけではなく、 FX Power で賢く取引をしましょう。 1. なぜ FX Power がトレーダーにとって非常に有益なのか 通貨と金のリアルタイム強弱分析 • FX Power は主要通貨と金の相対的な強弱を計算し、マーケットダイナミクスに関する明確な洞察を提供します。 • どの資産がリードしているか、または後れを取っているかを監視して、取引するペアを賢く選びましょう。 マルチタイムフレームの包括的なビュー • 短期、中期、長期のタイムフレームで通貨と金の強弱を追跡し、マーケットトレンドに基づいて取引戦略を調整できます。 • スキャルピングからスイングトレード
Step into the world of Forex trading with confidence, clarity, and precision using   Gold Indicator   a next-generation tool engineered to take your trading performance to the next level. Whether you’re a seasoned professional or just beginning your journey in the currency markets, Gold Indicator equips you with powerful insights and help you trade smarter, not harder. Built on the proven synergy of three advanced indicators, Gold Indicator focuses exclusively on medium and long-term trends eli
Advanced Supply Demand
Bernhard Schweigert
4.91 (299)
現在40%オフ 初心者にもエキスパートトレーダーにも最適なソリューション このインジケーターは独自の機能と新しい公式を多数内蔵しており、ユニークで高品質かつ手頃な取引ツールです。このアップデートでは、2つの時間枠ゾーンを表示できるようになります。より長いTFだけでなく、チャートTFとより長いTF(ネストゾーンを表示)の両方を表示できます。すべてのSupply Demandトレーダーの皆さんのお気に召すはずです。:) 重要情報の公開 Advanced Supply Demandの可能性を最大化するには、 https://www.mql5.com/ja/blogs/post/720245 にアクセスしてください。   エントリーまたはターゲットの正確なトリガーポイントを正確に特定できれば取引がどのように改善されるか想像してみてください。新しい基盤となるアルゴリズムに基づいて構築されているため、買い手と売り手の間の潜在的な不均衡をさらに簡単に特定できます。これは、最も強い需要と供給のゾーンと、過去のパフォーマンス(古いゾーンを表示)がグラフィカルに表現されるためです。これらの機能は、最適な
Introduction Harmonic Patterns are best used to predict potential turning point. Traditionally, Harmonic Pattern was identified manually connecting peaks and troughs points in the chart. Manual harmonic pattern detection is painfully tedious and not suitable for everyone. You are often exposed under subjective pattern identification with manual pattern detection. To avoid these limitations, Harmonic Pattern Plus was designed to automate your harmonic pattern detection process. The functionality
CRT Multi-Timeframe Market Structure & Liquidity Sweep Indicator Non-Repainting | Multi-Asset | MT5 Version Available MT5 Version:   https://www.mql5.com/en/market/product/162075 Full User Guide — explains what each feature does and why:   https://www.mql5.com/en/blogs/post/767525 Quick Start User Guide  — explains how to configure and in what order:  https://www.mql5.com/en/blogs/post/767540 Indicator Overview CRT Ghost Candle HTF Fractal is a complete institutional-grade market structure too
Trend indicator AI
Ramil Minniakhmetov
4.53 (83)
Trend Ai indicatorは、トレンドの識別と実用的なエントリポイントと反転アラートを組み合わせることで、トレーダーの市場分析を強化する優れたツールです。 この指標は、ユーザーが自信と正確さで外国為替市場の複雑さをナビゲートすることを可能にします トレンドAiインジケーターは、主要なシグナル以外にも、プルバックやリトレースメント中に発生するセカンダリエントリポイントを識別し、トレーダーが確立されたトレンド内の価格修正を活用できるようにします。 重要な利点: *MT4およびMT5の仕事 *明確な買いまたは売りシグナル *再描画しません ·すべての資産で動作します 私はeaやセットをtelegram it詐欺で販売しないように注意してください。 すべての設定はここでブログで無料です。  重要! 指示とボーナスを得るために購入後すぐに私に連絡してください! 私の他のプロダクトと同様、実質操作の監視はここに見つけることができます: https://www.mql5.com/en/users/mechanic/seller&nbsp ; 設定および入力: すべての
作者のその他のプロダクト
What we are talking about: This assistant can serve you for a long trading career. Optimized for those cases when you work on forecasts and want to buy a stock or crypto coin cheaper and sell it more expensive. Do you have an estimated closing price for profit: - If yes, then we will set up the robot to reach the price with greater profit and less risk. - If not, if you do not know exactly how much a stock or coin can grow, then you can maximize profit even with a small increase, due to a tempor
FREE
Using the indicator you can 1 Identify the trend and follow the large and small trends by drawing lines. When the price leaves the corridor of the lines, then with a high probability the price will go to the next line and reverse on it. 2 Long-line - Lay lines along the centers of fractals, the indicator can detect the fractal of the second point (Number bars analysis). Often the price can approach the line even after a week or a month and you can open a reversal trade. If the wave has passed w
FREE
BreakOut Space Fixation
Dimitri Nepomniachtchi
4.5 (2)
An EA version is being prepared. You can send a private message "notify about EA version". EA will be versatile with many settings for trading on various indicators. The new EA will also allow trading on this indicator. For example, allowing signals after X signals/bars to X signals/bars in one direction, before changing direction. If Break Out happened before/after the signal of another indicator. Collect profit on each next signal above/below the previous one. Send a private message "notify
FREE
EA   scans trades by magic numbers from trading robots in mt4 terminals. Then it passes the data on trades to   EA`S HOLDER     which filters the entry and exit signals by applying its own filters for opening and closing orders. Thus   EA`S HOLDER    conducts its trading based on the signals of running robots. Opening your own orders. Your trading robots transmit signals to this scanner.   The scanner transmits signals to the senior EA and you have a lot of opportunities.   Such as: - Maintain
FREE
This addon will pick up opened orders of experts by magic number and transfer to EA`s HOLDER inverted. If your trading bot opens a Buy order, then EA`s HOLDER will open a Sell order. If your trading bot opens a Sell order, then EA`s HOLDER will open a Buy order. Then EA`s HOLDER works with the orders opened by it according to your settings: - Copy, do not copy exit. - Change the stops to your own. SL TP. Original or Real or leave the original. - Set trailing, there are two of them. This can work
FREE
Do you know the spreads on which your trades are / will be opened. How well do you know about the spreads on which your trades are / will be opened. The main task of the indicator. Help the user / trader to study the spreads in the trading terminal. Get information about the minimum and maximum spread on each candle, from M1 and above. This information will help in the following cases: - Maximum trading spread EA    --- If your broker has smaller spreads or average statistically higher and th
Live Go
Dimitri Nepomniachtchi
Set your favorite indicator and start trading. Found your favorite indicator by virtual tests. - Virtual trading - Without opening trades on a live or demo account. ---- All transactions are saved only for you and trading statistics will be displayed on the chart. ---- Live Go conducts a full trading test in real time, showing clear test reports. ---- Live Go opens and closes trades without a spread / with spread, which allows you to check your trading strategy regardless of the broker’s condi
EAs Holder
Dimitri Nepomniachtchi
EA's HOLDER - 複数の取引ロボットを完全に制御して管理 EA の HOLDER は、複数の取引ロボット (EA) を効果的に管理するのに役立つトレーダー向けの高度なシステムです。このプログラムを使用すると、ロボットを個別の仮想口座に分散し、それぞれに個別のリスクと取引パラメータを設定できます。 EA の HOLDER はどのように機能しますか ? EA の HOLDER は、多数の取引ロボットを所有している、またはそれらを取得したいと考えているトレーダーの主要な問題である混沌とした管理を解決します。このプログラムは各ロボットに専用の仮想アカウントを提供し、それを使用して特定の EA の取引を柔軟に管理できます。 EAごとにリスクを設定すると、EAのHOLDERが指定された設定に従って内部アカウントを自動的に管理します。ロボットの戦略が損失を出し始めた場合、プログラムはその動作を規制し、ロットを減らし、EA が取引から完全に撤退するまで段階的に取引を停止します。これにより、成功したロボットは止まることなく収益を上げ続けることができます。 主な利点 : 分割と管理 :
An indicator of independent technical analysis by fractals and breakouts. Semi-automatic drawing of lines along points "A and B" in a matter of clicks. The classic version is available for free in my store under the name " BreakOut Space Center Projection " You can use it for your pleasure, the results of the indicators will be the same, but I wanted so much to simplify the process of technical analysis and created a quite comfortable indicator. My feeling is how to change from an old car to a n
Gold is a popular trading instrument for traders. It offers accessible conditions for long-term trading and scalping for quick profits. Read it, don't look between the lines, only then will you understand what kind of monster this is, this is the word I screamed when my keys opened the lock to the world of trade, which shook me up completely and opened many more doors, both in trade and in my career. The stars of fate led me to create a trading robot for gold. Specifically, gold. It's not just c
Fixer
Dimitri Nepomniachtchi
Track your orders, build a unified equity across selected symbols, magic numbers, terminals, and trading accounts. Closes orders when specified conditions are met. Creates new portfolios and adapts to already running portfolios according to your conditions. In short, take a look — it is worth it. If you have questions, write. If you are not sure about the settings, ask, I will help. Virtual SL, TP, Trailing.  * * * * It may seem like nothing special, but in practice they often help more than
A flock of piranhas devours trading bars on the chart, collecting profits. They hunt, receive signals to act, and enter the market. They don't wait long for distant prey, resting until it's nearby or switching to a new bar and ravaging it as it rises or falls. This happens so quickly and imperceptibly on the chart, as the number of closed orders increases in the statistics window and the profit line curves upward. Your terminal may freeze, but underneath, the piranhas are actively fighting to co
Instant converter of MT4 strategy tester report files to CSV files. For traders or developers. Test a trading EA in the strategy tester. Save the report (Results -> right-click -> Save as report) and move the StrategyTester.HTM file (you can rename it) to the common/files folder, which is the shared file folder for all terminals. Apply the script to any live chart where no EA is running. The script won't disrupt anything and will disappear from the chart after conversion. Set the strategy te
フィルタ:
レビューなし
レビューに返信