Price Rejection and Reversal Signals MT4
- インディケータ
- バージョン: 1.1
- アップデート済み: 18 5月 2022
- アクティベーション: 10

!! FLASH SALE !!
Over 80% off !! For ONE week only.
Now only $47 - normally $297!
>>> Ends on 30 June 2023 - Don't miss it!
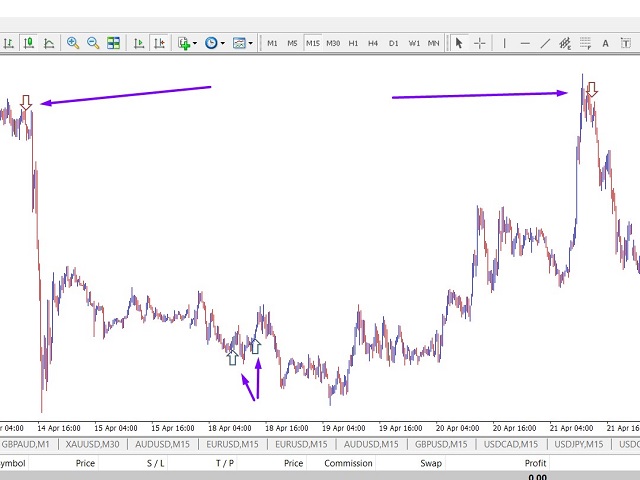
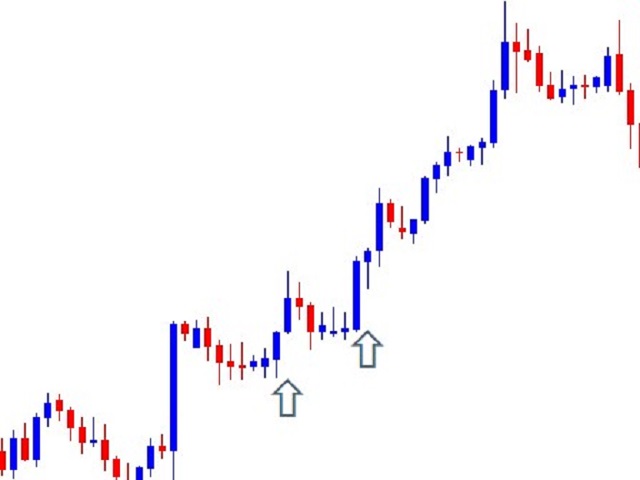
Buy And Sell Signal Arrows On The Chart When The Price Is About To Reverse.
Also Sends Alerts –
- On MT4
- To Your Phone
- To Your Email.
- Does not repaint.
- Works on any pair, any timeframe. (Just ajust the settings for your pair and timeframe.)
- 10 Activations allowed so you are free from limitations
Spreads from 0.1pip RAW/ECN Accounts, click here.
Check out my Waka Esque EA signal here: >> High Risk Settings or Medium Risk Settings.
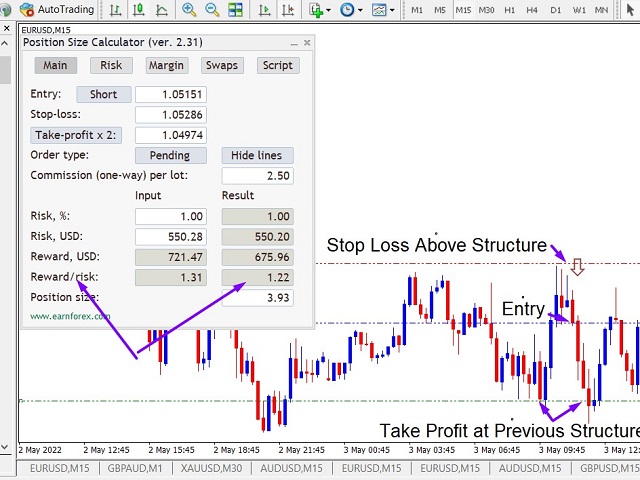
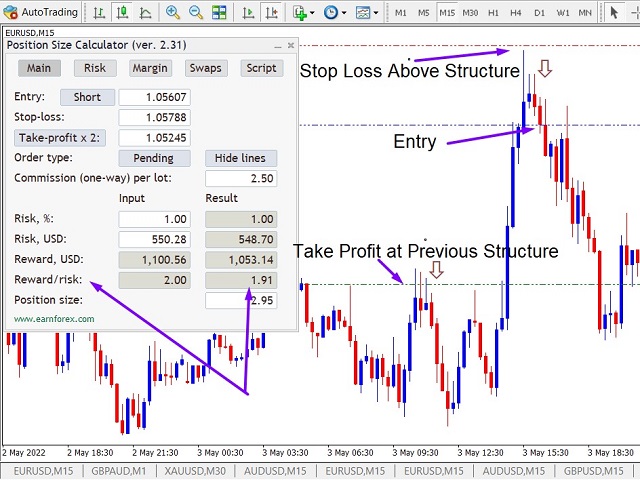
What is Price Rejection and Reversal and why is it important to you?
If price shows certain signs of rejection e.g. a large wick, this often means that it will then reverse and continue in the opposite direction from the wick.
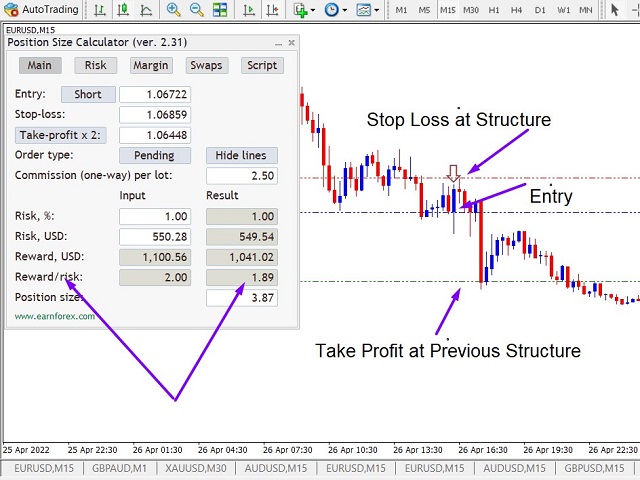
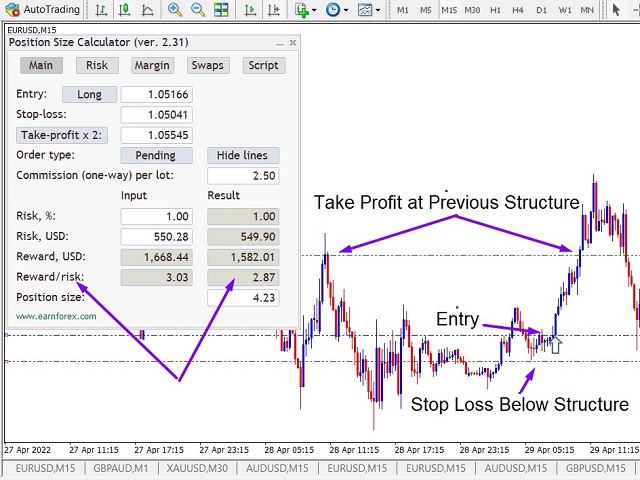
Price then normally will go to previous structure (support or resistance) and you can use those as your targets for Take Profits.
The Price Rejection and Reversal Signals Indicator tells you when the price is about to reverse. Using Price Rejection should be a part of every Trader’s strategy.
Works very well in conjunction with the Trend Continuation Alerts Indicator and the Consolidation Breakout Indicator.
Obviously, any indicator will not predict all reversals all the time – the markets are unpredictable – otherwise we would all be successful all the time.
This is still Forex and you will not win every trade. Practice on Demo before trading with live money and always use good money management.
I recommend that you only take a trade if there is a minimum Reward to Risk Ratio of 2:1 available. Personally, I only take trades of 3:1 or more.
You could also "filter" your trades using higher timeframe trend, or using an exponential moving average e.g. 100EMA
Please feel free to message me if you have any questions.
SETTINGS:
- Please make sure you adjust the settings for the timeframe and pair you are trading.
- Let me know if you need any help.
MinWickSize
This sets the minimum size of the "rejection" wicks in relation to the candles' body length. For price rejection, you want big wicks.
0.5 would mean the wick can be half of the size of the candle body. The lower the value, more signals, but less accurate.
MaxSignalCandleWickSize
This sets the maximum wick size of the signal candle in relation to the candle's body length.
Remember, this candle is in the direction of the trade you will take, so you want the opposite to a rejection i.e. a small wick.
0.5 would mean the wick can be half of the size of the candle body. The higher the value, more signals, but less accurate.
MinSR_Range
This sets the minimum range of the candles doing the rejection. A larger setting here stops you getting signals from tiny candles where there is not any real rejection or price movement.
MinSignalBreakoutPips
Minimum number of pips you want the signal candle to break above or below the temporary structure on the opposite side from the rejection to get a signal on the chart.
TimeOfTheDay(from hour)
The hour you want the Indicator to start each day.
TimeOfTheDay(from mins)
The number of minutes past the hour you want the Indicator to start each day.
TimeOfTheDay(to hour)
The hour you want the Indicator to stop each day.
TimeOfTheDay(to min)
The number of minutes past the hour you want the Indicator to stop each day.
Send_Email
Sends an alert to your email (if you have set this up in MT4).
Audible_Alerts
Gives a sound alert and pop-up message in MT4.
Push_Notifications
Sends an alert to your phone (if you have set this up in MT4).
Good indicator