Volume in Range MT4
- インディケータ
- バージョン: 1.0
- アクティベーション: 10

Horizontal volume bars, Cluster analysis, Volume profile
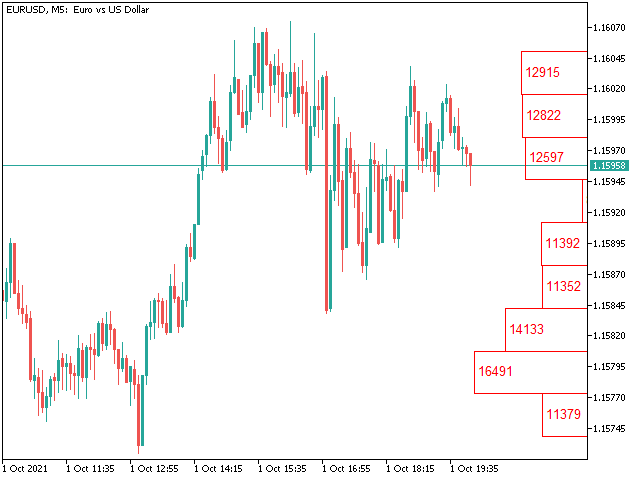
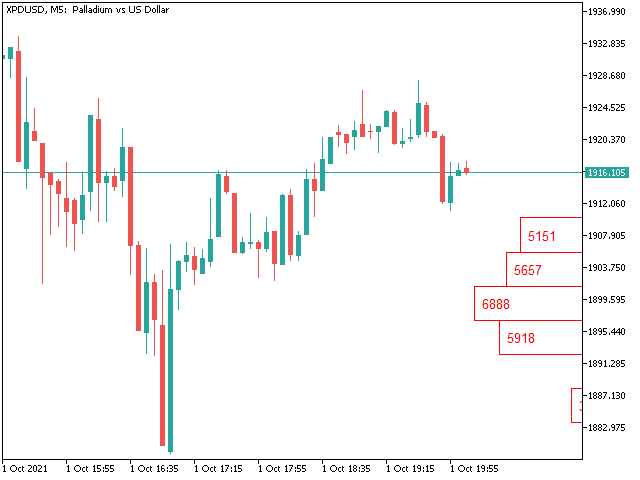
Volume in Range gets information about the accumulated volume in a specified vertical range and period in bars. The received data is then plotted on the chart as rectangular boxes with the volume quantity inside.
Usage:-
The tool acts as a support resistance levels but most importantly it should be used to check in which direction the price breaks out of the significant levels formed by this indicator and then actions to be taken on corrections or retracements.