Trend Analyser Dashboard

5

IMPORTANT; Price is subject to rise at any time from now! Do not miss this offer!

Dear trader I am glad to introduce my new tool called Trend Analyser Dashboard to you.

The design, style, and settings of this indicator  have been made simple to make its users not take too much time in understanding the indicator itself.  

The purpose is to help traders in analysing the direction of the major trend and the status of the trend whether in weak trend or its strong trend.

The indicator will also provide you with recommended will tell you whether the trend is strong or weak, it will also tell you whether to buy or not to buy in that strong or weak trend plus where you should put your take profit and stop loss targets.

Timeframe

The indicator can be used for all time-frame. 

Settings and Inputs

It is recommended not to change the default input settings to get the desired results but if you think that there is a need to do so then you may change the input settings to meet your desires and you should know that this will interfere with the default signals and may alter your results with this indicator. From the author's recommendation just do not alter the default settings.

How the indicator works.

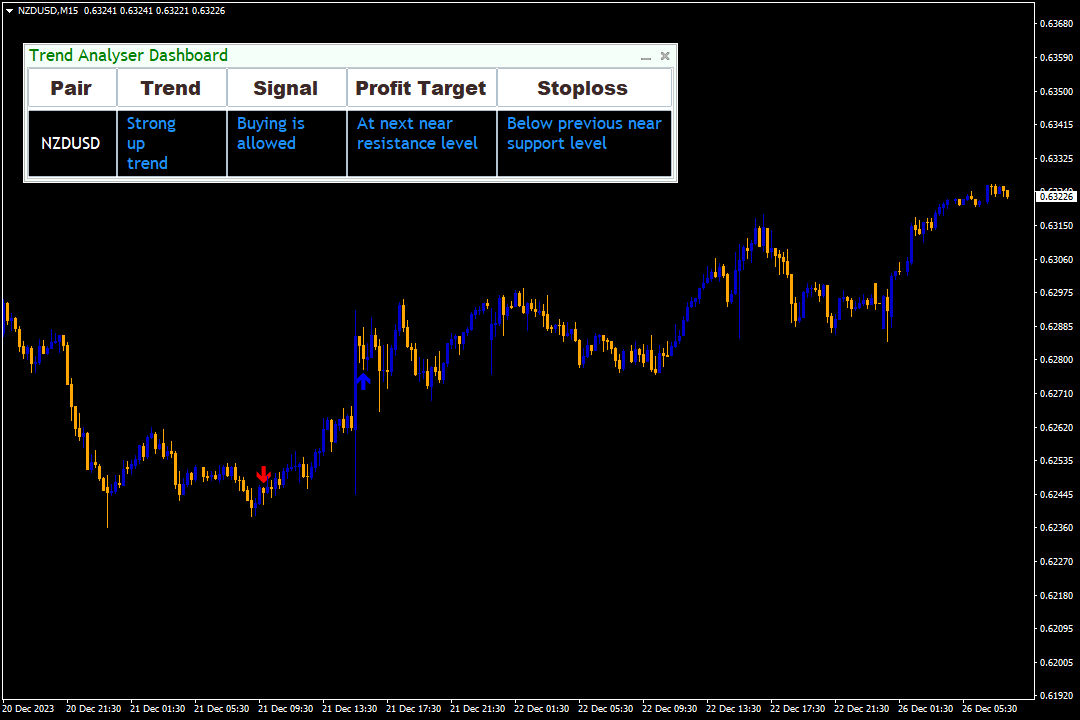
The dashboard can be dragged around the chart to have different angles of viewing the dashboard according to the user's needs.
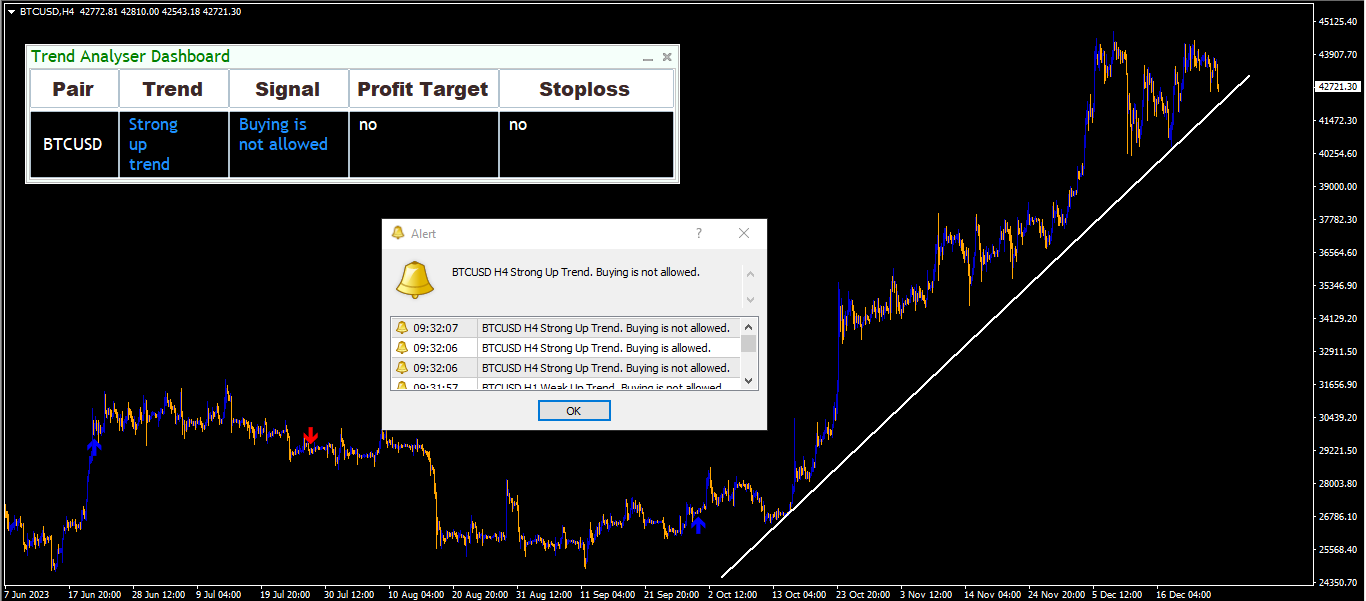
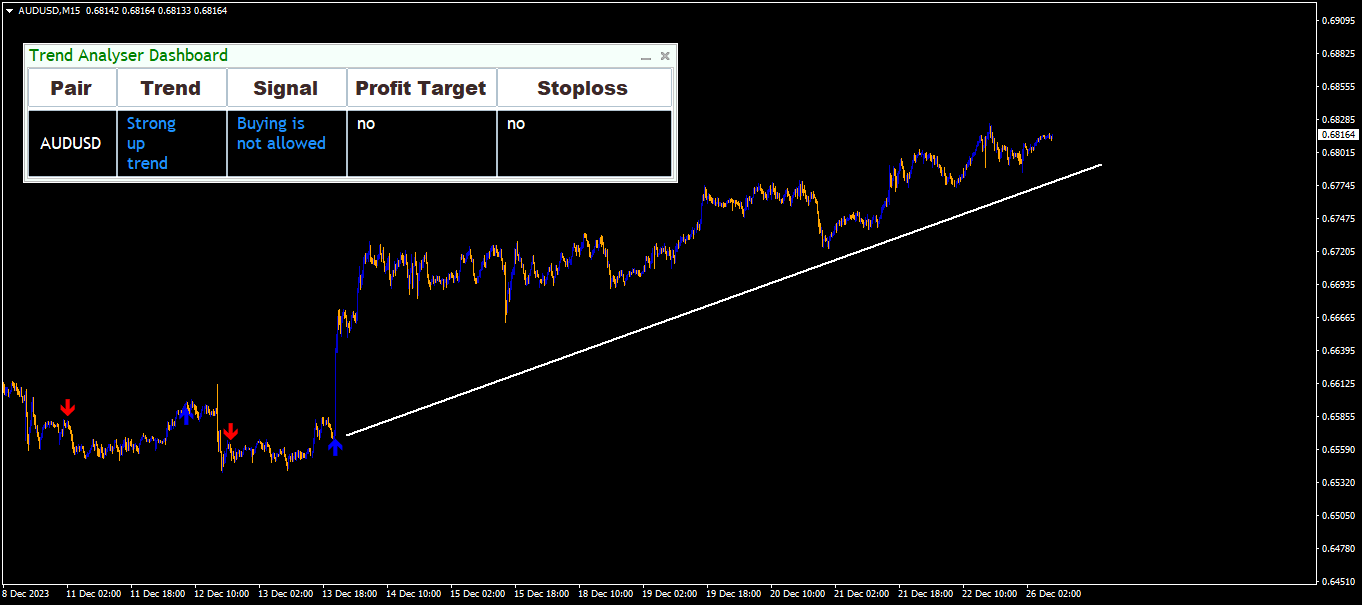
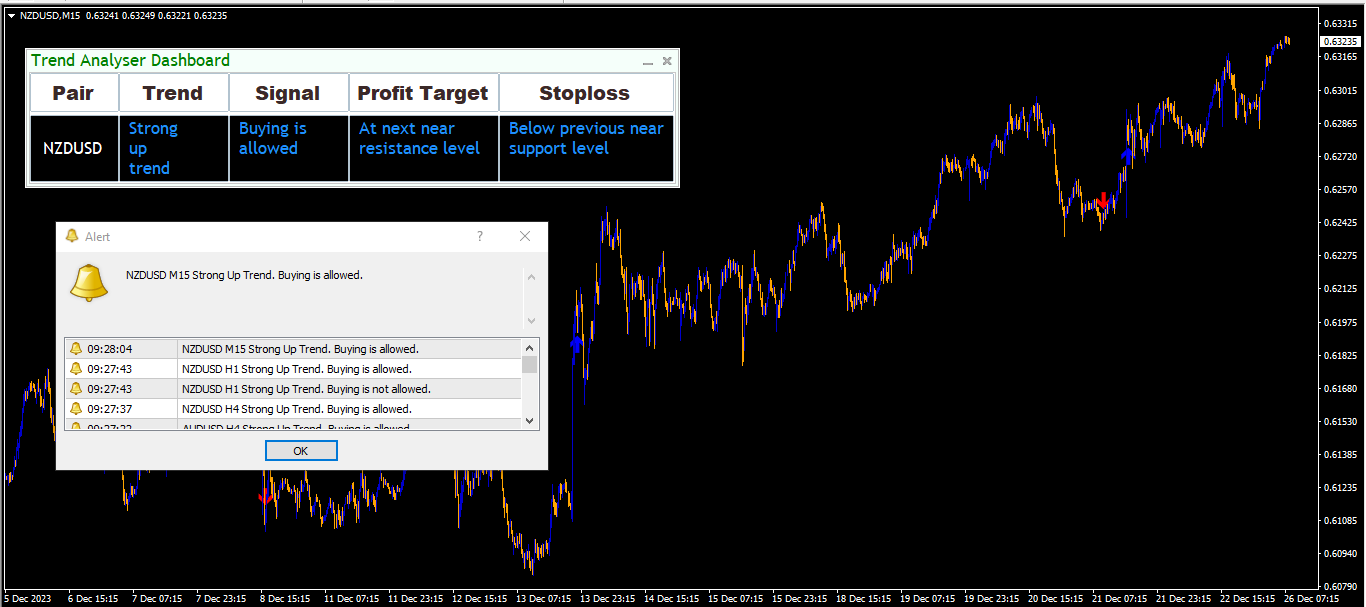
1. FOR UPTREND

  • For strong up trend the indicator will display the word "Strong uptrend" in a blue color.
  • For weak up trend the indicator will display the word "Weak uptrend" in a bright neon blue color.
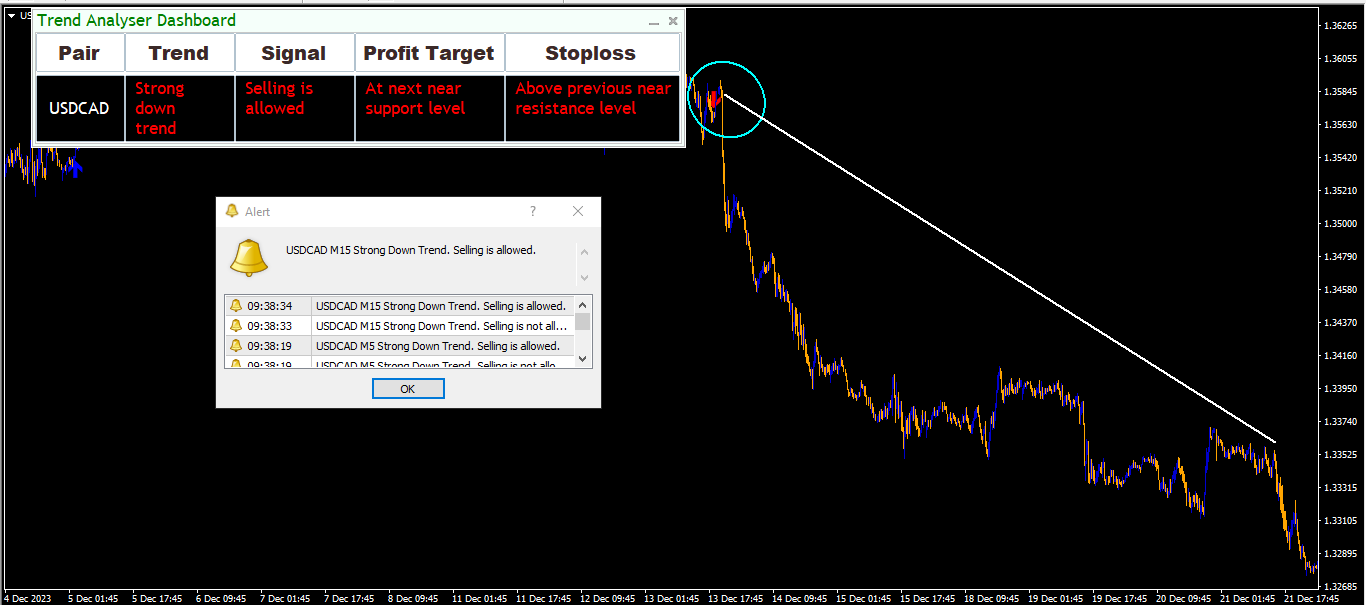
2. FOR DOWN TREND

  • For strong down trend the indicator will display the word "Strong down trend" in a red color.

  • For weak down trend the indicator will display the word "Weak down trend" in an orange color.

Note: The indicator will show you the signals for entering a trade by displaying texts as buying is not allowed or buying is allowed and vise-versa. 


Disclaimer: The main purpose of the indicator is to show you the direction of the major trend and the status of the trend therefore the decision to sell or to buy a pair is yours and the signals given by this indicator should not be considered final in making financial decision. If you have your strategy and use it wisely with this indicator it will be a great combination. Otherwise if you want your trading to completely rely on this single tool then you will need more time to learn how to trade with this indicator. The profit target or stop loss  indicated by this tool may be sometime be too small or too big to be take a trade. Therefore you should consider the issue of money management more before entering a trade.  Partial targets may be applied by the trader to maximize hitting the profit target. These partial targets could be going for half or the recommended profit level or quarter of the recommended level. 

I have attached screenshots so as you may have a look to what the dashboard looks like.


Thank you for considering my product.

レビュー 2
wuzzy66
1008
wuzzy66 2023.12.20 10:35 
 

Been trading for 4 years and would say this is the best trading tool so far after spending hundreds of $ trying to find the perfect tool this trend analyser dash board would be acting as your guardian angel because it directs you in the ride direction whether to take a trade or not or if a trend is weak or strong most traders see a good set up stones to buy or sell but stones you don’t know if that trend is strong or weak this indicator does the job you will see instant growth your profit taking

cam028
6488
cam028 2022.05.23 09:18 
 

Great product great customer service consistent profits

おすすめのプロダクト
ToolBox 360 is the swiss knife of all indicators. It is full packed with useful tools to help you with your trading. It can be used to find best entry and exit points and help you to decide if you should open a trade or not. It shows market trends, candlestick formations outside / inside bars and you can sett time based allerts. Main features: Time based Fibonacci lines Choose a start and end time and the indicator shows you Fibonacci lines within the selected time range including range high a
The Trend Professor is a moving average based indicator designed for the purpose of helping the community of traders to analyse the price trend. The indicator will be displayed in the main chart as it is indicated on the screenshot section. How it works The indicator has lines of moving averages and colored histograms to depict the direction of the trend. There will be a fast signal line colored blue/yellow/red at some points. The red/yellow colored lines stands for bearish trend/signal while th
Algo Trading Indicaor  With this indicator , you’ll have zones and trends that hight probability the price will reverse from it. so will gives you all the help that you need  Why should you join us !?  1-This indicator is logical since it’s working in previous days movement , to predict the future movements. 2-Algo trading indicator will help you to draw trends which is special and are too strong than the basics trend , trends will change with the frame time that you work on . 3-We can use
# Product Name: Gold ATR Pro – Daily Breakout System **Gold ATR Pro** is a specialized trend-following indicator designed exclusively for **XAUUSD (Gold)**. It eliminates market noise by identifying high-probability breakout zones based on the **Daily Opening Price** and **ATR (Average True Range)** volatility. Unlike standard indicators that repaint, **Gold ATR Pro** provides fixed, reliable signals based on confirmed candle closes, ensuring that what you see on historical charts is exactly w
Introduction to Fractal Pattern Scanner Fractal Indicator refers to the technical indicator that makes use of the fractal geometry found in the financial market. Fractal Pattern Scanner is the advanced Fractal Indicator that brings the latest trading technology after the extensive research and development work in the fractal geometry in the financial market. The most important feature in Fractal Pattern Scanner is the ability to measure the turning point probability as well as the trend probabi
Gann Box MT4
Frederic Jacques Collomb
5 (1)
Gann Box インジケーターは、トレーダーが市場の重要なレベルを特定し、活用するのを支援するために設計された強力で多機能なツールです。このインジケーターを使用すると、チャート上に長方形を描くことができ、それが自動的に 0, 0.25, 0.50, 0.75, 1 の戦略的レベルを持つ複数のゾーンに分割されます。価格がこれらのレベルのいずれかに達すると、アラートがトリガーされ、トレーディングの意思決定に貴重な支援を提供します。描いたゾーンに対する市場の動きを即座に把握できます。ゾーンをトレースするには、単純な長方形を描いて名前を GannBox に変更するだけです。 このインジケーターは、 サポートとレジスタンス の概念を使用するトレーダー、 サプライとデマンド 、 ICTテクニック 、または**公正価値ギャップ(FVG)**の専門家など、すべてのタイプのトレーダー向けに設計されています。 デイトレーダー、スイングトレーダー、またはポジショントレーダーであろうと、 Gann Box は市場の動きをより良く理解し予測する手助けをし、反応性とパフォーマンスを向上させます。 MT5バージョ
WPR by Profile, or WPR for Professionals Geo_WprPro is one of the well-known currency profile indicators. It simultaneously displays two WPR indicators with different parameters in the matrix form on all timeframes of multiple currency pairs forming the currency profile . As follows from the description, " WPR is a leading indicator that often goes ahead of the price chart. The oscillator frequently reaches extreme values before the price reversal as if anticipating that event: it almost always
「Binary Smart Eye」MT4インジケーターは、バイナリーオプションと外国為替市場の両方で取引シグナルを提供するために設計されており、M1からW1までの広範囲な時間枠で動作します。トレンドレベル、インテリジェントな移動平均、最適化された取引期間を組み合わせた独自の戦略を採用し、潜在的なエントリーポイントを特定します。 主な機能の内訳は以下のとおりです。 マルチタイムフレーム分析: インジケーターの多様性により、トレーダーはさまざまな時間枠で利用でき、M1でのスキャルピングからW1での長期トレンドフォローまで、さまざまな取引スタイルに対応します。 独自の戦略: 「Binary Smart Eye」の核となるのは、以下を利用する独自の戦略です。 トレンドレベル: これらのレベルは、優勢な市場トレンドと潜在的な反転ポイントを特定するのに役立ちます。 インテリジェントな移動平均: 市場のボラティリティに適応し、正確なトレンド方向を提供するカスタマイズされた移動平均です。 スマート取引期間: インジケーターは、特定の時間期間に基づいてシグナル生成を最適化し、最適な市場状況を捉えること
The Trend Champion indicator works on all timeframes and currency pairs. The indicator should be used as an auxiliary tool for technical analysis, it helps to determine the direction of the trend: either upward or downward price movement for a particular currency pair. Can be used along with oscillators as filters. Trend Champion is a trend indicator. Arrows indicate favorable moments and directions for entering the market. The indicator can be used both for pipsing on small periods and for lo
Super Signal – Skyblade Edition プロ仕様のノンリペイント / ノーラグ・トレンドシグナルシステム。卓越した勝率を実現 | MT4 / MT5 対応 主な特徴: Super Signal – Skyblade Edition は、トレンド取引に特化したスマートなシグナルシステムです。マルチレイヤーのフィルターロジックを用いて、明確な方向性と実際のモメンタムに支えられた強力なトレンドのみを検出します。 このシステムは 天井や底を予測するものではありません 。次の3つの条件がすべて満たされた場合にのみシグナルを発生させます: 明確なトレンド方向 モメンタムの増加 健全なボラティリティ構造 市場セッションに基づく流動性分析と組み合わせることで、シグナルの精度とタイミングがさらに向上します。 シグナルの特性: すべての矢印シグナルは 100% 非リペイント / 遅延なし 一度出現したシグナルは固定され、点滅・消失しません チャート上の矢印、情報パネル、ポップアップ通知、音声アラート、プッシュ通知に対応 EAとの統合が可能(バッファ出力対応)、自動売買やシグナル
**Binary Smart Systemのご紹介:究極のトレードパートナー** Binary Smart Systemは単なるインジケーターではありません。様々な市場で的確なシグナルを提供し、洗練されたアルゴリズムと豊富なテクニカルインジケーターの集合をベースにした、トレーダーを的確さとタイムリーなシグナルで装備するための厳選されたトレードツールです。 **インジケーターコンポーネント:** 1. **移動平均パーセンテージ(MAP):** このコンポーネントは複数の移動平均の加重平均を計算し、トレンドの特定の強力な基盤を形成します。MAPは市場の状況に動的に適応し、現在のトレンド方向に対する洞察を提供します。 2. **商品チャネル指数(CCI):** 平均価格からの偏差を分析することで、CCIは買われすぎと売られすぎの状態を評価します。Binary Smart SystemのCCI統合は、ポテンシャルな反転ポイントを特定する包括的なアプローチを保証します。 3. **移動平均収束拡散法(MACD):** シンプルなクロスオーバーを超えるMACDコンポーネント。MACD
Reliable Tool for the Financial Market This tool delivers high-performance results in trading on financial markets. Advantages: Fast and Accurate Signals: The arrow signals of this tool are easily and accurately analyzed, providing quality signals that you can rely on. No Repainting: This tool does not have any repainting, ensuring reliable trading signals. Quality Guarantee: If any signal repainting is detected, which we cannot correct, we will refund your money without commission. Recommendat
This is a professional Trend Sim indicator. The intelligent algorithm of the Trend Sim indicator accurately detects the trend, filters out market noise and generates input signals and exit levels. Functions with advanced statistical calculation rules improve the overall performance of this indicator. The indicator displays signals in a simple and accessible form in the form of arrows (when to buy and when to sell). Knowing the entry point of each of the currencies is very important for every f
Leave a review for this product, and receive another "Free" product that you choose. You can see my other products here: https://www.mql5.com/en/users/zakri/seller Harmonic Patterns Detector indicator draws harmonic patterns on chart. Harmonic patterns have a high hit-rate of around 80% and are excellent for trade entries. They are used as price reversal points. Some of them have a long history of usage and were created by famous traders like H. M. Gartley. Many harmonic patterns are included
Does your trading consist of Multiple EA's, Multiple time frames an no clear indication of how each individual strategy or time frame is performing, then this indicator will help. Assign the EA Magic number to this indicator and track it's performance on the chart by selecting on chart the period, today, week, month year or all history to view. Easy visual colour changing header to display the performance of the EA for the respective periods.    Minimize the panel to reduce chart clutter. Add yo
CSS " currency strength slope "  is a a multi currency strength indicator that use Forex major currencies, EUR, USD, CAD, AUD, NZD, JPY, CHF, GBP. it use 28 major pairs to calculate the power of every currency using a based moving averages algorithm : you will see volatility clearly between currencies. input: MA Fast & Slow. - MA Mode : simple, exponential, smoothed, linear weighted - Applied Price : close, open, high, low, median price, typical price, weighted price.
The YFX Symbol Selector indicator is used to easily change the chart symbol and period with a click of a button. This is done by using a selector GUI object that can be placed on any corner of the chart. The GUI selector contains the following information: Descriptive header for GUI selector panel Symbol information and controls for changing the chart symbol Period information and controls for changing the chart period Footer containing the current bid/ask quote for the currently selected symbol
XFlow shows an expanding price channel that helps determine the trend and the moments of its reversal. It is also used when accompanying transactions to set take profit/stop loss and averages. It has practically no parameters and is very easy to use - just specify an important moment in the history for you and the indicator will calculate the price channel. DISPLAYED LINES ROTATE - a thick solid line. The center of the general price rotation. The price makes wide cyclical movements around the
FFXMV Dashboard Plus
Opengates Success International
FFXMV Dashboard Plus This is a custom indicator created to give Traders a full view of what is going on in the market. It uses a real time data to access the market and display every bit of information needed to make successful trading. The PLUS there to produce the kind of RESULTS as you see in the SCREENSHOTS, I added a MultipleOrder Utility EA with it with instructions on how to use it with FFXMV Dashboard. INSTALLATION : Read the MANUALS that comes with the rest of the PACKAGE after you ha
Bank Executive Indicator Uses A Simple method of tracking price as it moves across the chart and signals when a potential long or short position is active and indicates this to the trader giving you the opportunity to take a position on the market. Or you can simply use this indicator to give yourself signals and determine if you want to take the trade or learn the strategy on your own.
Expert for trading with the BowTie strategy. Intelligent algorithm for scalper and intraday traders. Multi time frame and multi currency panel.   The benefits you get: Easy-to-use panel that alerts you to crossings of moving averages, like strategy, on each currency. Possibility to choose your favorite crosses. Possibility to choose to activate only the preferred time frames. Never redesigns, does not retreat, never recalculates. Works on forex and CFD, timeframe from M5 to D1. Integrated pop-up
Trend Oracle trend indicator, shows entry signals. Displays both entry points and the trend itself. Shows statistically calculated moments for entering the market with arrows. When using the indicator, it is possible to optimally distribute the risk coefficient. The indicator can be used for both short-term pipsing and long-term trading. Uses all one parameter for settings. Length - the number of bars to calculate the indicator. When choosing a parameter, it is necessary to visually similarize s
API TicksVolume mtf -  Volume Analysis for Trading The API TicksVolume mtf indicator is a tool for traders who want tick volume analysis to make trading decisions. Designed for MetaTrader 4 , this multi-timeframe (MTF) indicator provides  tick volume data with color-coded visual cues , helping traders assess volume strength and possible volume direction across different timeframes. Key Features: Multi-Timeframe Analysis: Monitor tick volume from different timeframes in real time for a broader
Proinsta78
Mikhail Bilan
3.5 (4)
各研究員のトレーダーな感置のデモ当ショールーム:イメージテスタです。 それは計画されていた。 あなたはダニの歴史と利益または損失は表示されません。 テスターはこの指標を取りません。 間違いない ポイントは強い動きの方向を示します。 動作しないにも関わらず、機械に必要なものは手動で開放の取引あります。利益のみにと思い、スクリーンショットを理解します。 私は150-200ポイントごとに閉じます。 インディケータへの登録は、売上予測として個別に指定できます。 Saプライベートメッセージは、連絡先に記載されます。 私はまた、許容株式およびその他の通貨でのみ取引します。 Vytorgまたは損失は、トーガがどのように適用されるかによって異なります。 今の家賃で始まります。デモでは、すべてが表示されません。 テスターには、インジケータが信号のみを与え、トレンドの強さを示すという報告はありません。2番目の青い円の出現後、2黄色のものの後に売り注文を購入または開くことができます。 画面はあまり良くありません。 あなたがコメントや個人的なSMSでより良い書き込みメールを見ることができる場所が必要です。
Platinum FX индикатор для скальпинга. идеально подходит для торговли бинарными опционами. работает на всех валютных парах мультитаймфреймовый. когда появляемся красная стрелка мы покупаем когда появляемся красная мы продаем. он должен был достичь успеха в трейдинге. Полное отсутствие перерисовки. Точность сигнала. точность данного инструмента можете увидеть в тестере Всем удачных торгов By Lilyyy
The indicator is a trading system for AUDUSD or NZDUSD currency pairs. The indicator was developed for time periods: M15, M30. At the same time, it is possible to use it on other tools and time periods after testing. "Kangaroo Forex" helps to determine the direction of the transaction, shows entry points and has an alert system. When the price moves in the direction of the transaction, the maximum length of the movement in points is displayed. The indicator does not redraw, all actions occur a
is a user-friendly MetaTrader 4 indicator that creates a centralized dashboard for traders to oversee several cryptocurrency pairs simultaneously across different timeframes, presenting price movements through simple dots or miniature candlestick charts, complemented by volume indicators to facilitate quick assessments of market trends and fluctuations. It automatically resizes grid cells according to the number of bars shown per timeframe for better use of screen space, features adjustable co
FREE
Market Structure Zig Zag
Lesedi Oliver Seilane
4.66 (29)
Free Market structure zig zag to assist in price action trading the screenshots describe how to use and how to spot patterns new version comes with alerts, email alert and  push notification alert can be used on all pairs  can be used on all timeframes  you can add additional confirmation indicators the indicator shows you your higher high and low highs as well as your lower lows and lower highs  the indication makes price action analysis easier to spot.
FREE
This indicator allows you to see the strength of the trend on all timeframes. It can be used for all currency pairs. The indicator can be displayed in the form of a column (from left to right): status buy / sell / strong buy / strong sell, strength of the trend in percentage, pips last candle, body candle now, remaining time, and the timeframe of M1 to MN. Information contained below (from left to right): total trend percent, sell percent, buy percent.
Introducing the "KFX Trade Manager" expert advisor for MetaTrader 4 (MT4), a comprehensive solution for advanced trade management and risk control. This powerful tool is designed to enhance your trading experience by automating various aspects of order handling, profit optimization, and alert notifications. With the "KFX Trade Manager," you can take your trading to the next level and streamline your operations for improved efficiency and better risk management. Key Features: Trade Management Set
このプロダクトを購入した人は以下も購入しています
Meravith
Ivan Stefanov
5 (1)
このインジケーターは、各ポイントのボリュームを分析し、そのボリュームに対する市場の疲労レベルを計算します。 インジケーターは3本のラインで構成されています: 強気のボリューム疲労ライン 弱気のボリューム疲労ライン 市場のトレンドを示すライン。このラインは、市場が強気か弱気かに応じて色が変わります。 任意の開始点から市場を分析できます。一度ボリューム疲労ラインに達したら、次の分析を開始するための新しいポイントを設定してください。 トレンドや修正を分析できます。良いアプローチは、トレンドラインに達したときや、トップやボトムがヒットしたときにインジケーターを移動させることです。 トレンドラインとボリューム疲労ラインの距離が大きいほど、その方向のボリュームは大きくなります。 トレンドラインはオーダーを開く場所として使用でき、疲労ラインは利益を取るために使用されます。 このシステムは非常にユニークですが、非常に直感的でもあります。 市場には同様の製品はありません。 使用に制限はありません。すべての市場およびすべての時間枠で適用できます。 重要:MetaTrader4のテスターで確認する際は、紫色
OrderFlow Absorption – MT4用プロフェッショナル・デルタ&アブソープションシグナルインジケーター OrderFlow Absorptionで本物のオーダーフロー分析の力を解き放ちましょう。MetaTrader 4向けの究極のデルタヒストグラム&アブソープションシグナルインジケーターです。あらゆる価格変動の裏側で何が起きているのかを知りたいトレーダーのために設計されており、市場を動かす隠れた買い/売り圧力や吸収イベントを明らかにします。 特徴 デルタヒストグラムの可視化:   買い圧力・売り圧力を色分けされたヒストグラムで即座に表示。 アブソープションシグナル検出:   高度なロジックで強気・弱気の吸収イベントを特定し、反転の兆しを早期に通知。 チャートマーカー:   吸収シグナルをチャート上に直接マークし、視覚的に分かりやすく表示。 ポップアップアラート:   新しい吸収シグナルが出現した際にリアルタイムで通知。 カスタマイズ可能な閾値:   弱いシグナルを除外し、高確率のセットアップに集中。 リソース管理:   大きなチャートでも高速に動作する効率的な計算。
「 Dynamic Scalper System 」インジケーターは、トレンド波の中でスキャルピング取引を行う手法のために設計されています。 主要通貨ペアと金でテスト済みで、他の取引商品との互換性があります。 トレンドに沿った短期的なポジションオープンのシグナルを提供し、追加の価格変動サポートも提供します。 インジケーターの原理 大きな矢印はトレンドの方向を決定します。 トレンド波の中では、小さな矢印の形でスキャルピングシグナルを生成するアルゴリズムが機能します。 赤い矢印は強気方向、青い矢印は弱気方向です。 トレンドの方向には敏感な価格変動ラインが描かれ、小さな矢印のシグナルと連動します。 シグナルは次のように機能します。適切なタイミングでラインが現れるとエントリーシグナルが形成され、ラインが開いている間はポジションが保持され、完了すると取引が終了します。 推奨される動作時間枠はM1~H4です。 矢印は現在のローソク足に形成され、次のローソク足が開いている場合は、前のローソク足の矢印は再描画されません。 入力パラメータ Trend Wave Period - トレンド方向
The Nihilist 5.0 Indicator includes Forexalien and Nihilist Easy Trend trading strategies and systems. It is composed of an MTF Dashboard where you can analyze the different input possibilities of each strategy at a glance. It has an alert system with different types of configurable filters. You can also configure which TF you want to be notified on your Metatrader 4 platform and Mobile application The indicator has the option to view how could be a TP and SL by using ATR or fixed points, even w
Product Description Rtc ML Ai Predictor — Futuristic Intelligence for Real-Time Market Decisions Bring robotic precision to your trading.   Rtc ML Ai Predictor   fuses   Machine Learning   with   SMA-shift dynamics   to forecast short-term momentum and trend inflection points with clarity. The model evaluates multi-factor market structure, assigns a   confidence score   to each signal, and lets you act only when conditions align with your rules. Why traders choose Rtc ML Ai Predictor AI-guided e
BinaryUniversal is a signal indicator for binary options and Forex. In its work, the indicator uses a complex algorithm for generating signals. Before forming a signal, the indicator analyzes volatility, candlestick patterns, important support and resistance levels. The indicator has the ability to adjust the accuracy of the signals, which makes it possible to apply this indicator for both aggressive and conservative trading. The indicator is set in the usual way, it works on any time period and
"Dragon's Tail" is an integrated trading system, not just an indicator. This system analyzes each candle on a minute-by-minute basis, which is particularly effective in high market volatility conditions. The "Dragon's Tail" system identifies key market moments referred to as "bull and bear battles". Based on these "battles", the system gives trade direction recommendations. In the case of an arrow appearing on the chart, this signals the possibility of opening two trades in the indicated directi
ヒット率トップボトムシグナル ヒット率トップボトムシグナル ヒット率トップボトムシグナル は、完全に革新的なアプローチを提供します。 特定のTP-SLとPAIRS/TFで最も優れたパフォーマンスを発揮する方法を事前に評価したい方に理想的です。 ヒット率トップボトムシグナル 戦略は、 すべてのトレーダーとトレードスタイル にとって基本的なツールです。これは、 リペイントしない精度の高いシグナル を提供し、どのタイミングでどの方向に取引するかを明確に示すだけでなく、各通貨ペアとTFの ヒット率を詳細に記録 し、あらかじめ設定されたテイクプロフィット(TP)とストップロス(SL)を提供するためです。 これにより、シグナルの有効性の比率を事前に知ることができ 、リスク管理と正確な取引に非常に重要です。 この戦略の特徴は、全体的な動きではなく、インパルス内のリバーサルポイントの検出に焦点を当てている点で、従来のトップボトムよりも頻繁にシグナルが発生し、 市場の重要な各変動のキーとなる瞬間に焦点を当てています。 このシグナルの歴史的な効果を%で表示する SL/TP比率との組み合わせ により、こ
Gold Channel is a volatility-based indicator, developed with a specific timing algorithm for the XAUUSD pair, which consists of finding possible corrections in the market. This indicator shows two outer lines, an inner line (retracement line) and an arrow sign, where the theory of the channel is to help identify overbought and oversold conditions in the market. The market price will generally fall between the boundaries of the channel. If prices touch or move outside the channel it is a tradi
This indicator is a multifunctional technical analysis tool based on the combination of an adaptive exponential moving average and volatility filters calculated through the Average True Range (ATR). It is designed to accurately identify the current price direction, highlight key trend reversal areas, and visualize potential turning zones. The algorithm is built upon the dynamic construction of a trend ribbon using two levels of volatility — outer and inner ranges. The outer boundaries serve as i
#EasyWayTradePanel indicator for #MetaTrader4 , is trade assistants for manual trading in any #currency in #FOREX , #CRYPTOCURRENCY as #Bitcoin , #Ethereum , #Lightcoin and more. Also is EasyWay to use for #COMMODITY as #Gold , #Silver , #Oil , #Gas ...... and #CFDs . When installed on the chart in your chosen time frame and trading tool, the indicator automatically draws the following custom indicators used in the EasyWayTradePanel trading strategy. 1) Zigzag_Extreme_Indicator, 2) Regression_C
This is a mini One pair version of Advanced Detector of Trend Reversal and Continuance known as TrueTrendStarM(TTSm25). It is a sensitive and Predictive indicator of Price Trends for Professional traders.  ( ATTENTION BUYERS:-Now the indicator is available for UNLIMITED TIME ONE TIME buy of just $500 ). Avail the Opportunity.    It detects high odds changes in Price Trend direction long before other indicator detects it. I have been working on it since 2019.    This is possible due to fractal
Indicator Description GOLD TITAN KING SIGNAL INDICATOR High-Precision Gold Scalping Buy/Sell Signals – Manual Trading Assistant Overview The Gold Titan King Signal Indicator is a manual trading assistant tool designed for high-frequency scalping on Gold (XAUUSD) and other major pairs. It generates clear BUY/SELL signals with precise entry levels, along with adjustable Stop Loss and Take Profit levels displayed directly on the chart. ️ This tool is NOT an EA. It does not execute trades
How to use Pair Trading Station Pair Trading Station is recommended for H1 time frame and you can use it for any currency pairs. To generate buy and sell signal, follow few steps below to apply Pair Trading Station to your MetaTrader terminal. When you load Pair Trading Station on your chart, Pair Trading station will assess available historical data in your MetaTrader platforms for each currency pair. On your chart, the amount of historical data available will be displayed for each currency pai
指標の目的: Oracle Flowは、テクニカル指標とフィルターの組み合わせを用いて、買い/売りの市場エントリーポイントを特定するために設計されています。この指標はチャート上に矢印を表示し、トレンドの反転または継続の可能性を示します。 主な使用要素: 指数平滑移動平均線(EMA) – 2つの期間を使用:速いEMAと遅いEMA。これらは動きの強さを確認するクロスオーバーを特定するために使用されます。 RSI(相対力指数): – トレンドの強さを評価します。50レベルをクロスした際にシグナルが発生し、強気/弱気の優位性の変化を示します。 ブルパワーとベアパワー: – 買い圧力と売り圧力の不均衡を測定し、シグナルのフィルタリングを強化します。 ボリンジャーバンド: – 価格がチャネル外に動いたかどうかを確認します。 ボラティリティフィルタリング: 指標はローソク足の平均値幅(高値–安値)を計算し、エントリーポイントを精緻化します。 シグナル形成条件: 買いシグナル(青色下向き矢印): EMA(速い)が
Dual Momentum is a modern arrow indicator for MetaTrader 4, created specifically for the accurate detection of market reversals and strong impulse movements. The indicator is based on a combination of two powerful oscillators – Williams %R and RSI, which allows you to filter noise and generate more reliable signals. Thanks to this, Dual Momentum indicates only key entry points when the probability of a successful trade is highest. Key advantages: No redrawing – signals remain on the cha
FFx Engulfing Setup Alerter gives trade suggestions with Entry, Target 1, Target 2 and StopLoss. Below are the different options available: Entry suggestion - pips to be added over the break for the entry 3 different options to calculate the SL - by pips, by ATR multiplier or at the pattern High/Low 3 different options to calculate the 2 TPs - by pips, by ATR multiplier or at Risk/Reward Offset the dashboard - any place on the chart Remove the suggestion once the price reached the SL line Lines
FFx InsideBar Setup Alerter gives trade suggestions with Entry, Target 1, Target 2 and StopLoss. Below are the different options available: Entry suggestion - pips to be added over the break for the entry Minimum candle size - to avoid too close buy/sell entry suggestions 3 different options to calculate the SL - by pips, by ATR multiplier or at the pattern High/Low 3 different options to calculate the 2 TPs - by pips, by ATR multiplier or at Risk/Reward Offset the dashboard - any place on the c
FFx OutsideBar Setup Alerter gives trade suggestions with Entry, Target 1, Target 2 and StopLoss. Below are the different options available: Entry suggestion - pips to be added over the break for the entry. 3 different options to calculate the SL - by pips, by ATR multiplier or at the pattern High/Low. 3 different options to calculate the 2 TPs - by pips, by ATR multiplier or at Risk/Reward. Offset the dashboard - any place on the chart. Remove the suggestion once the price reached the SL line.
FFx PinBar Setup Alerter gives trade suggestions with Entry, Target 1, Target 2 and StopLoss. Below are the different options available: Entry suggestion - pips to be added over the break for the entry Minimum candle size - to avoid too small candles 3 different options to calculate the SL - by pips, by ATR multiplier or at the pattern High/Low 3 different options to calculate the 2 TPs - by pips, by ATR multiplier or at Risk/Reward Offset the dashboard - any place on the chart Remove the sugges
Automatic, live & interactive picture of all trendlines. Assign push, email and sound alerts to the lines of your choice and be informed about price rollback, breakout, rollback after breakout, number of rollbacks, line expiration by double breakout. Correct, drag or delete the lines and interactively tune the line system. https://youtu.be/EJUo9pYiHFA . Chart examples https: //www.mql5.com/en/users/efficientforex Price Interaction Events All events are effective immediately and only after one
Stochastic Oscillator is one of the most popular and accurate oscillators widely used by traders to capture overbought and oversold areas of price action. Although the Stochastic indicator works fine for an interval of the market, it fails to generate profitable signals when the market conditions change, and hence it produces wrong signals resulting in big losses. Have you ever thought about an adaptive Stochastic indicator that adapts its period of calculation based on the market conditions? Th
The purpose of this new version of the MT4 standard indicator provided in your platform is to display in a sub-window multiple timeframes of the same indicator with its divergences. See the example shown in the picture below. But the display isn't like a simple MTF indicator. This is the real display of the indicator on its timeframe. Here's the options available in the FFx divergences indicator: Select the timeframes to be displayed (M1 to Monthly) Define the width (number of bars) for each tim
The purpose of this new version of the MT4 standard indicator provided in your platform is to display in a sub-window multiple timeframes of the same indicator with its divergences. See the example shown in the picture below. But the display isn't like a simple MTF indicator. This is the real display of the indicator on its timeframe. Here's the options available in the FFx divergences indicator: Select the timeframes to be displayed (M1 to Monthly). Define the width (number of bars) for each ti
The FFx Dashboard MTF alerter will show you on a single chart all the timeframes (M1 to Monthly) with their own status for the indicator. 2 Alert Options: Single timeframe: each selected timeframe alert separately when a signal occurs Multi timeframes: all selected timeframes must agree for an alert to be triggered Both options have an input to select the timeframes to be used for the alert(s). How to Understand the Status: Green/Red square: histogram above/below 0 line Green square + Red bord
The FFx Dashboard MTF alerter will show you on a single chart all the timeframes (M1 to Monthly) with their own status for the indicator. 2 Alert Options: Single timeframe: each selected timeframe alert separately when a signal occurs Multi timeframes: all selected timeframes must agree for an alert to be triggered Both options have an input to select the timeframes to be used for the alert(s). How to understand the status: Green/Red square: RSI above/below 50 line Green square + Red border: R
The FFx Dashboard MTF alerter will show you on a single chart all the timeframes (M1 to Monthly) with their own status for the indicator. 2 Alert Options: Single timeframe: each selected timeframe alert separately when a signal occurs Multi timeframes: all selected timeframes must agree for an alert to be triggered Both options have an input to select the timeframes to be used for the alert(s). How to understand the status: Green/Red square: Stoch above/below 50 line Green square + Red border:
作者のその他のプロダクト
King of Forex trend indicator is a trend following indicator based on moving averages. This indicator doesn't repaint. The major function of this indicator is to show the major direction of the trend, the beginning and the end of the current trend. A bullish trend is when the indicator turns blue A bearish trend is when the indicator turns pink. This indicator is great for swing trading and day trading It works best on H1, H4, D and Weekly time-frames. It works on all pairs but it works best on
The King of Forex Trend Cloud Indicator is a trend following indicator based on moving averages. The Indicator is meant to Capture both the beginning and the end of a trend. This indicator can be used to predict both short and long terms market trends.  The king of Forex Trend Cloud if paired together with the King of Forex Trend Indicator can give a broad picture in market analysis and forecasts. I have attached images for both the  The king of Forex Trend Cloud on its own and  The king of Fore
Dear traders, here is my other tool called the "Market Makers Trend Index".   The Market Makers Trend Index is created for the purpose of helping majority of traders to analyse the market direction in an easy way. This indicator is for serious traders who are eager to add edging tools to their trading arsenal. What are you waiting for just grab your copy today and amake a difference.  WHY THIS TOOL This indicator help traders analyse the trend direction and trading signals with precision and eff
The Trend Monster is a trend following non repainting indicator based on moving averages. As traders we want to be careful not to trade against the trend. Therefore when you look at the chart as a trader you will have to ask yourself these kind of questions Is this market trending? Is this market ranging/trading sideways? Is this market bullish or bearish? What should I look for before I take a trade? Those are some critical questions that every trader should ask him/herself before taking any tr
NOTE-After the first 10 people to rent this product for 1 month then I will remove the 1 month renting option and leave the unlimited price only. Therefore don't rent it too late. Thanks for those who have rented yet. Don't miss out this offer! Few  people remaining. Special offer from 2500usd to 200usd 24 hours offer! Introduction Super bands Trend Indicator is an indicator designed to reveal the direction of the market Trend. The Indicator is based on moving averages, ichimoku, alligators, a
The Forex Scalpers Index (FSI) is a trend following Indicator based on moving averages.  The purpose of this indicator is to be used for scalping all kinds of markets without limitations. The indicator can be used for any kind of currency pair. For those Scalpers who are looking for the indicator that can make their trading activities easy we recommend using this indicator because it provides many entry and exit opportunities. This indicator can be used on all timeframes. How it works. Colored
Disclaimer: There is no guaranteed profitability! Invest wisely. The Perfect Trend Scanner is a trend following indicator which is designed to show you the direction of the current trend. The aim is to assist you not to trade against the trend. How it works. The indicator doesn't repaint. The indicator works on all time-frames. The pink histograms indicate a bearish trend while the blue histograms indicates a bullish trend /signals. You can us this indicator in the top down market analysis appro
The Mane Flow Index is designed to help youu know where the market orders are flowing to. The indicator is based on moving averages. In other words it will show you where the investors capital is flowing to. In our trading activities we want to know where the capital is going so that we capitalize on the direction of the capital invested in the market. We want to trade with the trend! Not to go against it! How it works It is non repaint. It is suitable for all kind of markets It is suitable for
Septermber OFFER 85% OFF next price for unlimited version will be 2500$. This is the only time you can get this institutional and professional indicator at this price for unlimited version. Don't dare to miss this. The tool I am about to introduce to you you can't compare it with other tools due to its strategy and accuracy level in predicting the next price directional movement. This tool is designed for serious traders who have decided to make a difference through trading. Be the next person t
The Trend Professor is a moving average based indicator designed for the purpose of helping the community of traders to analyse the price trend. The indicator will be displayed in the main chart as it is indicated on the screenshot section. How it works The indicator has lines of moving averages and colored histograms to depict the direction of the trend. There will be a fast signal line colored blue/yellow/red at some points. The red/yellow colored lines stands for bearish trend/signal while th
Maximum Directional Index (MDI) is designed for two purposes. 1. To show the direction of the trend (The blue yellow trend line) 2. To show the Overbought (Resistance) and Oversold (Support) zones for a trader to know whether the trend is about to reverse or not. It shows the maximum direction of the price trend. How it works 1. The indicator works on all time-frames but for clarity I recommend you use it on 5minutes, 15miutes, 30minutes, 1 hour and 4 hours time-frame charts. 2. The indicator c
Information about this tool Generally: The Smart Trend Indicator STI is designed for the purpose of showing you the direction of the trend.   How it works It is based on moving averages. The indicator works on all types of markets. The indicator works on all timeframes. The indicator works on all currency pairs. This indicator doesn't repaint. The light green histograms are for bullish trend. The green histograms are for fast buy signals. The light red histograms are for bearish trend. The dee
The Omega Trend Oscillator is a trend indicator based on Moving averages and Bollinger bands. I made it simple for you to have easy and soft market analysis approach. The indicator can be used for the following purpose. 1. For trend analysis 2. For determining the overbought and oversold market condition 3. For discovering market selling and buying opportunities.  Meaning of colors on the indicator FOR BULLISH MARKET (Buy) 1. Lime color is for bullish market/trend 2. Blue color is for very st
OFFER! OFFER! From 450usd to 370usd this offer may end at any time from now! Don't miss this. Hi traders, I have created this EA and called it "The Account Flipper EA". This trading EA is for both newbies and professional traders. The first goal with this EA is to protect your capital first and the second is to grow your account. Therefore no risky strategies like grid, marti-angle, hedging, or any greedy trading strategies. We use a fixed lot size in every trade, SL, TP and break even all these
Hi traders, I'm glad to bring to you the market analysis tool called "Infinity Trend Indicator". The main goal of this indicator is to help you figure-out  the beginning of a new trend and the end of the trend current trend.  NOTE:  THIS INDICATOR DOESN'T REPAINT!! How to use this Indicator 1. Based on the Infinity trend indicator only We look to buy when the yellow line is pointing or curving up after a strong bearish move We look to sell when the yellow line is pointing or curving downward aft
Note: The price is subject to increase at any time from now!  Hi Traders, I would like to introduce to you my new indicator called the Infinity Oscillator Indicator. This indicator is designed for both newbies and professional traders. Parameters The inputs that can be changed by the user are colors of the lines only so as to not disturb the original trading strategy this indicator uses. The indicator will not provide buy and sell arrow signals but will help traders in market analysis approach
Reminder: After purchasing the unlimited version of this indicator send me the proof and I will add you to my private group so that you join the community and continue to learn more about this tool and grow together with other traders. You will also learn the strategy that will change your trading story! Dear Traders I am so glad to introduce my forex trading product called "Day Traders Master Board". This tool is designed for serious traders of any trading strategy.  My goal is to help trader b
NOTE: NEXT PRICE WILL BE 550$ Dear Trader I hope you have been eagerly waiting and looking for a tool to improve your trading. I am so glad to introduce my other product to you called Trend Shooter Index. The main goal of this tool is to help traders shoot the trend (target the trend) from the bottom or from the top of the trend for maximum profitability. How is the Indicator designed This tool is designed to show the following Red arrows pointing down for sell signals. Blue arrows pointing up f
Note: The PRICE IS SUBJECT TO INCREASE AT ANY TIME FROM NOW!! DON'T MISS THIS BEST OFFER. Dear traders once again I am very glad to introduce to you my another trading tool called "Trend Hunter Indicator". This indicator is designed to help traders capture the trend from the beginning or the end of it. It is one of the indicator that if used wisely may  help you improve in your trading decisions. Timeframe   The indicator is for all timeframes Pairs The Indicator is for all pairs. Market Thi
OFFER! OFFER! NEXT Price Will be 650$ and the rental option will be removed after this. Don't miss the current price offer before it is too late. Dear Traders I am so glad to introduce my Super Powers Indicator.  The purpose of this trading tool is to help serious traders who want to make trading one of their main source of income.  I know trading is not an easy task but if you have the right tools, knowledge and motivation to trade then you are ready to go in this industry. My role is to help y
NOTE: PRICE WILL RISE VERY SOON. DON'T SKIP THIS OFFER! Dear traders I am glad to introduce the " Market Swing Scanner Board" indicator to you. This indicator was made mainly to be used in combination with the Market Swing Index Indicator. You use the  "Market Swing Scanner Board"  indicator to scan for trading opportunities on the  Market Swing Index Indicator . This tool is designed for serious traders who have decided to make a difference through trading. Be the next person to witness this st
WARNING!! THIS SWORD IS TOO SHARP!    ONLY 10 COPIES LEFT FOR THE NEXT PRICE TO BE 8,000$ FOR UNLIMITED PLAN. Dear traders I am very glad once again to introduce to you my other tool called "Forex Sword Indicator". In short this tool is meant to give you an edge over the market that you have been waiting for  so long. Now, here it is. It is a very very simple tool but yet a dangerous sword. I call it a  Holy grail indicator!. I will not talk a lot about this tool. Just let the tool speak by itse
Dear Traders this is my another tool called " Swing Master Indicator ". As the name above the indicator is designed to help you in swing trading by capturing the low and highs of the price. You may us this tool with any trading strategy and style from scalping to position trading. It is made for level of traders including newbies and advanced traders even prop-firms, hedge funds and banks to help them make sold market analysis. I create tools for serious traders who want to make a difference in
Dear Trader It is my pleasure to introduce to you my tool called the " Forex Sniper Indicator" . The major aim of this tool is to help serious traders and investors in all type of Financial Markets to catch price next movement right at the moment the price direction is about to change. This tool can be used to snipe the price direction in both down trend, uptrend and ranging markets. This tool can be used as the stand alone tool though it may be combined with other tools as well. My goal is to h
WARNING: PRICE IS SUBJECT TO RISE AT ANY TIME. GET YOUR COPY TODAY TO AVOID MORE COST! Dear Traders I am so glad to introduce to you my other tool called the Forex Sniper Entries Indicator. This tool is designed to help serious traders and investors capture big moves in the currency price movements. The philosophy behind this tool is all about winning big and riding the price movement from its beginning until the maximum point. We want to capture those big moves in both down and up markets as mu
OFFER!   OFFER ! After 3 weeks the unlimited price will be 500$ and in the future you will regret why you didn't make a purchase at this lowest price. Dear Traders, the atomic power Entries Indicator is one of the indicators that if used wisely and correctly can help you to find an edge over the market.  The indicator will work for all forex pairs, all markets and all timeframes. Still it is your duty to find the most effective timeframe for you. When the sell or buy arrow appears you will get a
OFFER! OFFER!    ONLY 5 COPIES REMAINING FOR THE NEXT PRICE TO BE 360$ Dear traders I am very glad to introduce the Sweet Arrows Indicator to you. The Sweet Arrows indicator is well designed to help serious investors to trade with confidence. In short I can say that this is one of the valuable tool to add in your trading tool kit. INSTANT, FAST AND NON LAGGING SIGNAL This is an instant signal meaning that you get the signal as soon as the bar opens. The signals don't lag meaning that it doe
Urgent reminder> Only 13 copies remaining for the price to double on all renting options. Get your copy Today! Introduction Dear Traders, I am always working to come up with tools that may help you to become a better trader and investor. Due to my experience in trading and market analysis and trading software design and development, I am glad to introduce to you my other tool called " Amazing Entries Indicator ". The Indicator is designed in a way that it combines different strategy to provide
URGENT REMINDER> Only 5 remaining Copies for next unlimited price to be 360$ (THIS IS A SPECIAL OFFER TOOL) If you are looking for FAST , RELIABLE and PROFITABLE indicator to help you take easy trades then this is the tool to go with. Trading is very tricky, frustrating, confusing, embarrassing and even can make you go broke if you approach the market with gambling mindset, poor entry and exit strategies, unreliable indicators or signals, poor money management skills and lack of knowledge. Many
Dear traders I am happy to introduce to you my new tool called "Brilliant Oscillator" Indicator. This is one of the indicators that can be used as a stand alone indicator. WHAT I LIKE ABOUT THIS TOOL IS Fast and reliable signals Purpose The purpose of this tool is to assist both newbie and Advanced traders to analyze the market with high level of accuracy in both bearish and bullish market trends. The inputs In the input section you will be able to change colors of the indicator only. Currency p
フィルタ:
wuzzy66
1008
wuzzy66 2023.12.20 10:35 
 

Been trading for 4 years and would say this is the best trading tool so far after spending hundreds of $ trying to find the perfect tool this trend analyser dash board would be acting as your guardian angel because it directs you in the ride direction whether to take a trade or not or if a trend is weak or strong most traders see a good set up stones to buy or sell but stones you don’t know if that trend is strong or weak this indicator does the job you will see instant growth your profit taking

Elias Mtwenge
3900
開発者からの返信 Elias Mtwenge 2023.12.20 11:07
Thank you very much for your review and recommendations as well. I will continue working on this tool to make it even more better. I wish you all the best in your trading journey.
cam028
6488
cam028 2022.05.23 09:18 
 

Great product great customer service consistent profits

Elias Mtwenge
3900
開発者からの返信 Elias Mtwenge 2022.05.23 15:11
Thank you cam028, my happiness is to see traders succeed. I wish you all the best.
レビューに返信