TMA Currency Meter
- インディケータ
- バージョン: 2.2
- アップデート済み: 22 7月 2019
- アクティベーション: 10

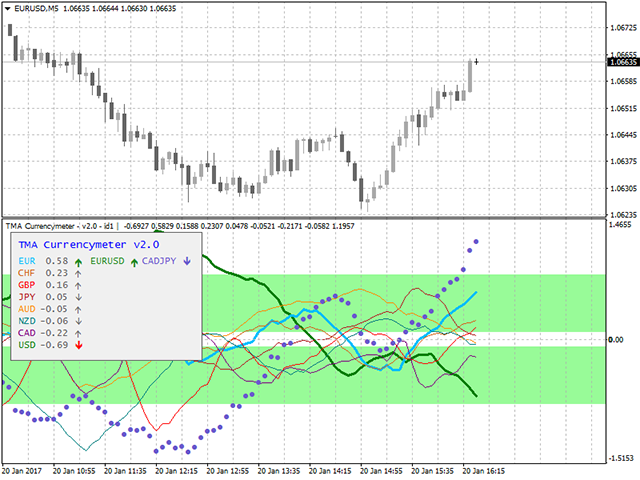
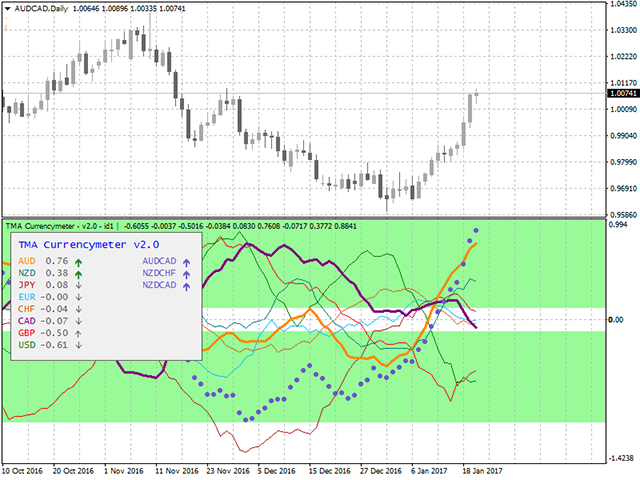
TMA Currency Meter is the ultimate currency meter. Based on the Triangular Moving Average of all available symbols, this indicator shows which currencies are strong, strengthening, weak or weakening. Experienced as well as novice traders will see the strong and weak currencies in the blink of an eye, and know which trade possibilities to explore further.
TMA Currency Meter is a true Multi Timeframe indicator. It is easy to show the currency strengths for a higher timeframe than the chart timeframe.
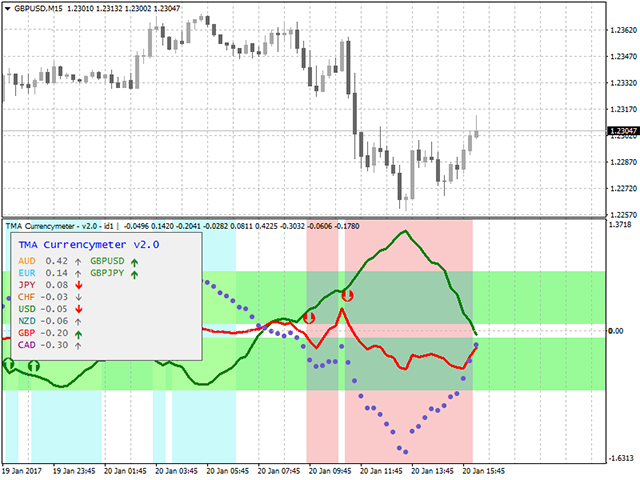
The real power of this indicator shows when it is set to display only the currencies of the chart the indicator is attached to. It will show buy and sell signals, as well as the up or down trend.
The currency strengths are processed by a discretionary system to produce signals of strong moving currency pairs. All symbols with a signal are shown.
Besides the currency strenghts TMA Currency Meter shows the TMA Slope of the current symbol. This means extra confirmation signals are shown.
What can you use TMA Currency Meter for:
- Find strong and weak currencies
- Find signals for symbols with strong moving currencies
- Find signals for the TMA Slope of the all symbols
- Use any timeframe
- Use any higher timeframe than the chart timeframe
- Show buy and sell signals
- Show up and down trends
- Show currency crosses
- Show strong, weak or normal crosses
Settings
The settings of TMA Currency Meter can be intimidating. Keep experimenting, there is nothing to break.
- Use major symbols from Market Watch window? - set to true to calculate all the symbols in your Market Watch window.
- Symbols to use: - comma delimited list of symbols if preceding setting is false.
- Show chart symbol only? - set to true if you want to unlock signals for the current symbol.
- Timeframe to use: - select the timeframe to calculate the values to, must be the current timeframe or higher.
- Show CSS value & signals table? - set to true to show a table with currency values and all signals.
- Difference threshold - set to the difference between the two strengths of the currencies of the current symbol to show the up or down trend.
- Signal zone badwidth - set the bandwith of the green background bands, these are the bands in which signals are found.
- Alerts - Set to true to enable alerts, 'Do Alerts?' is a master switch for all alerts.
- Currency names - set individual currencies to true if you want to show them.
- Color palette - set to Light or Dark according to your preferred background color.
- Colo(u)rs - you know what to do.
If in doubt, start with the default options. Next option to try is 'Show chart symbol only?'
Table
The information table on the left hand side shows the following information:
- Currency name and color
- Currency value
- Value direction - shown in bold and color if the movement is strong
- Movement signals - symbols for which the currencies move strong within the bandwidth
- TMA Slope signals - symbols for which the TMA Slope moves outside their currency values, use for confirmation.
Loose Ends
If you run in any problems, try to load some history for all your symbols before dropping TMA Currency Meter on your chart.


Great. If you want Real to be a trader, this is right indicator. I try many currency Strength indicators and i can Say: "this is the best".