Swing Indicator Pro
- インディケータ
- バージョン: 1.10
- アップデート済み: 13 9月 2018
- アクティベーション: 5

The indicator is intended for swing trading. The indicator is able to determine the trend and important trend peaks (swing), which will be important support / resistance levels.
Features
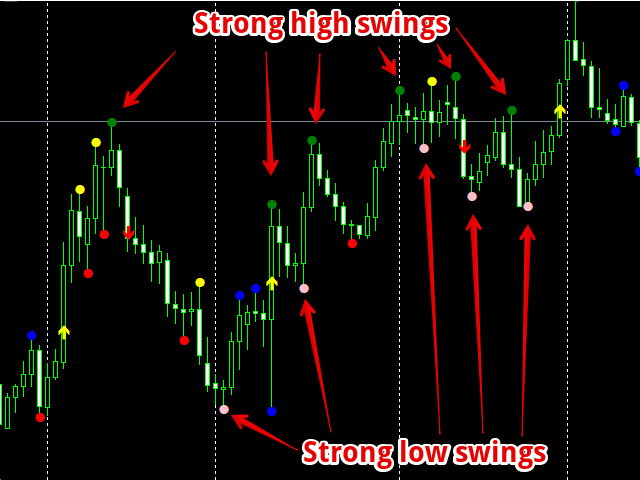
- Simple visual displaying of 3 types of swings:
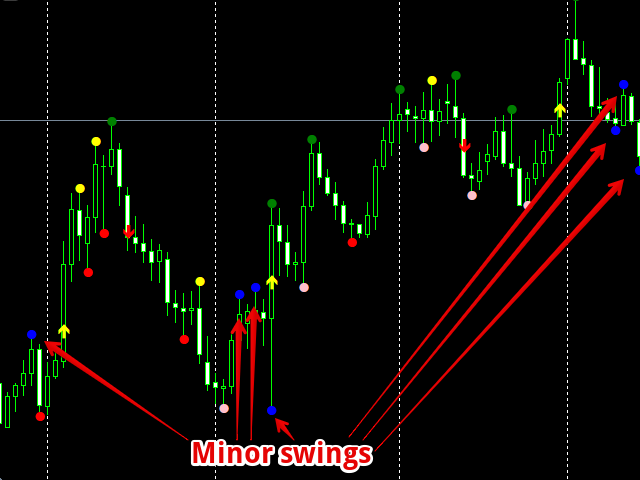
- Minor swings - do not affect the trend, but only on the movement within the trend
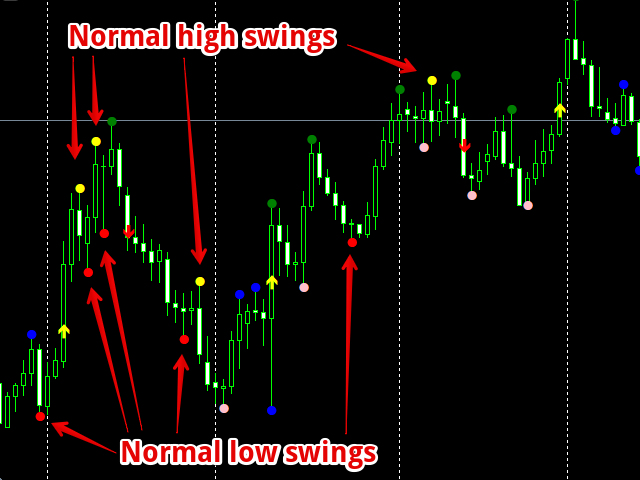
- Normal swings - can change the direction of the trend
- Strong swings - have a double confirmation of the importance of the level
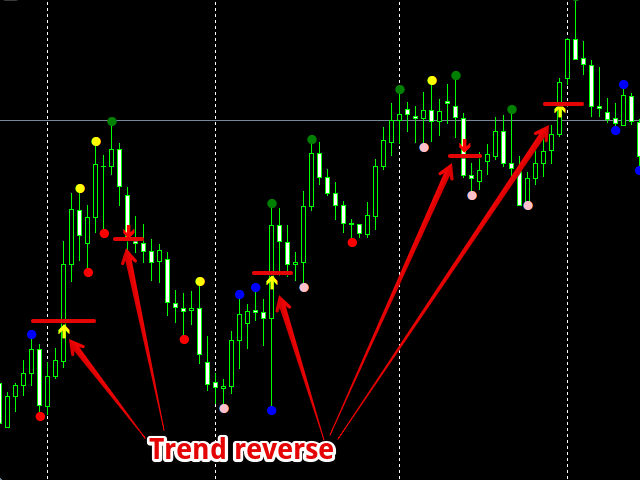
- Visual displaying of the trend reversal
- Minimum of settings, everything works fully automatically
- Works with any timeframes and currency pairs, including crypto-currencies, stocks, etc.
- There is an optimization for using the indicator in EAs
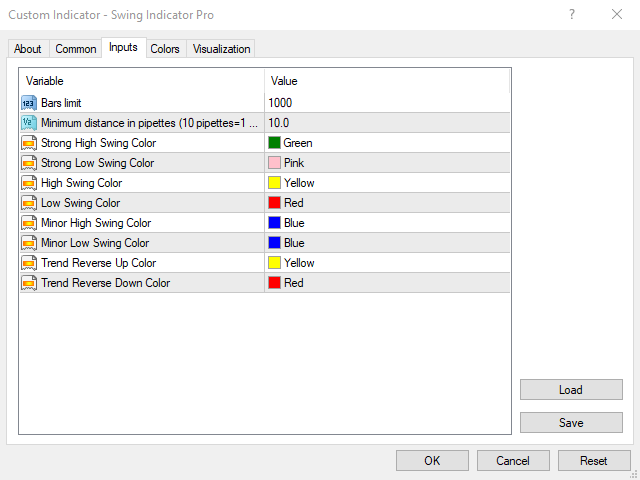
Inputs
- Bars limit - by default 1000. This is the maximum number of bars to displaying the indicator, if you use the indicator in Expert Advisors, you can limit this value to increase performance. For example - 500.
- Minimum distance in pipettes (10 pipettes=1 pips) between neighboring candles - by default 10 pipettes = 1 pips. This is the minimum distance between highs and lows between neighboring candles for swing calculations.
- Strong High Swing Color - by default Green. Color of the strong high swing.
- Strong Low Swing Color - by default Pink. Color of the strong low swing.
- High Swing Color - by default Yellow. Color of the normal high swing.
- Low Swing Color - by default Red. Color of the normal low swing.
- Minor High Swing Color - by default Blue. Color of the high minor swing.
- Minor Low Swing Color - by default Blue. Color of the low minor swing.
- Trend Reverse Up Color - by default Yellow. Color of the trend reverse up.
- Trend Reverse Down Color - by default Red. Color of the trend reverse down.