TemplateSwitcher

5

The TemplateSwitcher utility allows automatically switching the set of indicators and objects used on the chart depending on the current timeframe and/or symbol.

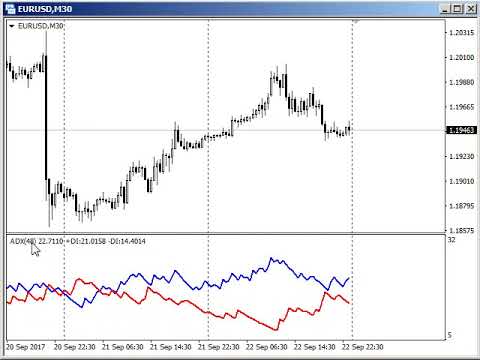
It often happens that an indicator with a certain period is used on a chart of a higher timeframe, while the same indicator with an increased calculation period is required for a smaller timeframe. Of course, it is possible to open two charts of different timeframes with the required indicator periods. But what if duplication of charts of the same symbol cannot be afforded? In this case, it remains only to switch between the two timeframes, constantly reconfiguring the chart template.

However, if you attach TemplateSwitcher to the chart, it will be sufficient to create all the required templates for any chart timeframes and symbols once, and then forget about the reconfiguration of the chart appearance whenever its timeframe is switched.

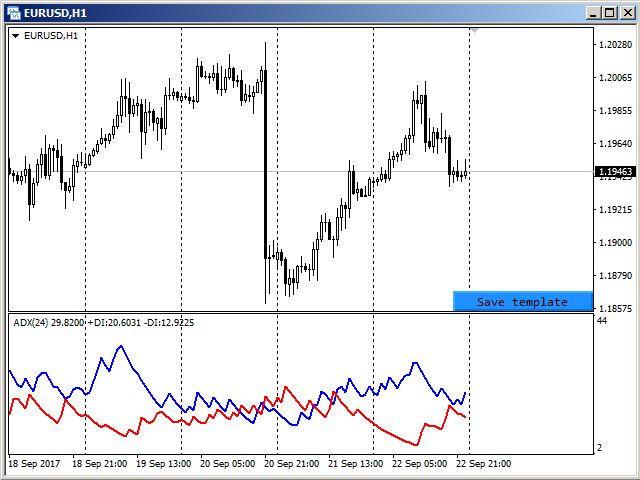
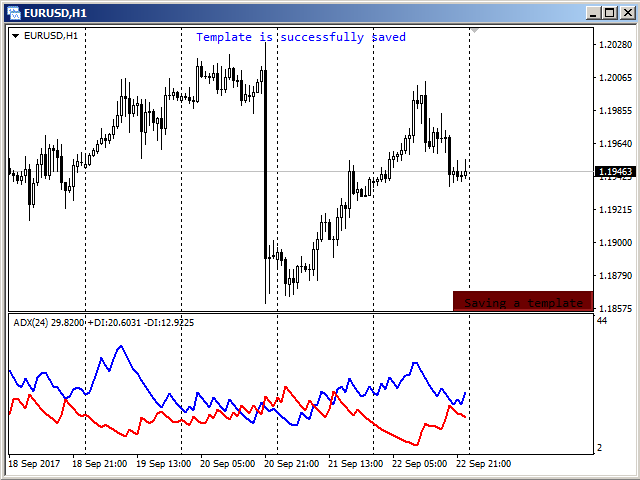
The chart template can be created by pressing the button, which appears in the bottom right corner of the chart when hovered by mouse (se screenshot 1). Pressing the button saves the template (see screenshot 2). The template will be automatically loaded when switching to the EURUSD H1 chart.


Parameters

The utility can be used for creating templates, which depend on the symbols and timeframes, or depend solely on timeframes. To do this, simply select the required option to separate templates in the "Templates difference" parameter.

If the "By symbol and timeframe" option is selected, then each symbol will have individual templates for all timeframes used. In other words, the EURUSD H1 template will not be used for any other symbol, i. e. opening a GBPUSD H1 chart will not give the chart appearance configured for EURUSD H1.

In case the "By timeframe only" option is selected, the loaded and saved templates will be the same for all symbols used. For example, after creating a template on the EURUSD H1 chart and later attaching the utility to the GBPUSD H1 chart, the chart will look the same as previously configured for EURUSD H1.

The "Templates name suffix" parameter allows you to create different templates for the same symbol. For example, you can install the utility on two GBPUSD charts, but on each of them use a different suffix for the template name. In this case, different templates will be used for each chart. If, within the same symbol, the difference in patterns is not required, then the parameter must be left blank, as by default.

The "Hide save button" parameter allows you to control the visibility of the button to save the template. By default, the button appears only when you hover over the lower right corner of the chart. For cases where other indicators / experts do not provide the ability to track the mouse cursor, this parameter should be set to "No". Then the button will always be visible on the chart.

レビュー 2
Trader mql5
1314
Trader mql5 2019.09.12 04:34 
 

Wow. What magic! Ihor makes GREAT products. Pity he stopped developing lately. Have all except the Fractal Div EA, will test soon.

fxcommentary
1929
fxcommentary 2017.11.11 09:58 
 

Very usefull tool, simplifies monitoring the markets.

おすすめのプロダクト
This indicator help to mark the high and low of the session Asian,London,Newyork , with custom hour setting This indicator is set to count from minute candle so it will move with the current market and stop at the designated hour and create a accurate line for the day. below is the customization that you can adjust : Input Descriptions EnableAsian Enables or disables the display of Asian session high and low levels. EnableLondon Enables or disables the display of London session high and
FREE
Introduction Take your forex trading to the next level with our vibrant, color-coded session indicator! Designed for MT4/MT5, this tool visually separates the Asian (Purple) , London (Yellow) , and NYC (Pink) trading sessions for optimal trading strategy. Key Features Color-Coded Precision : Asian (Purple), London (Yellow), NYC (Pink) sessions marked directly on your chart. Perfect for Session Traders : Focus on the overlaps and high-volatility periods. Compatibility : Works seamlessly with MT4
This panel is a part of the SupDem-Pro trading system and is used to search for the best opportunities for any available instruments. Which can be selected manually in the Market Watch (open it with CTRL + M). Using this trading panel in combination with ShvedSupDem-Pro_Zone allows to analyze multiple currency pairs with a single click. The panel allows to load any instruments from the Market Watch, from 6 major currency pairs up to all instruments (480). The indicator parameters Button Width -
プロフェッショナルな累積デルタ&ボリューム中央値インジケーター この強力なボリューム分析ツールを使用して、 実際の売買圧力 を追跡します。 ボリューム比較インジケーター (Volume Compare Indicator) は、 累積デルタ (Cumulative Delta) と ボリューム中央値 (Volume Medians) を組み合わせて、 機関投資家の活動、 不均衡、 および潜在的な反転を特定するのに役立ちます。  主な特徴:  累積デルタヒストグラム – リアルタイムで純粋な買いボリュームと売りボリュームを視覚化します。  売買ボリューム中央値 – 平均的な買いボリュームと売りボリュームのレベルを示す水平線。  スマートなボリューム分類 – 以下を区別します: 強い買い(緑) – 強気(ブル)の圧力。 強い売り(赤) – 弱気(ベア)の圧力。 買いボリューム中央値(青線) – 標準的な買いボリュームの基準。 売りボリューム中央値(オレンジ線) – 標準的な売りボリュームの基準。  カスタマイズ可能なパラメーター – 感度に合わせて CDIPeriod と CDIRang
The Pipsurfer Trade Manager Is A high level software that will automatically analysis each trading asset and calculate its optimal take profit and stop loss levels for Each trade it is managing. Complete with an easy to use management panel that allows you to manage your risk parameters for each individual trade that you place on each pair. You will have access to trailing stops, break even, partial take profits and account risk percentage features as well
The Best One Scalping Trade Panel functional manual trade panel with risk reward, auto SL by candle ( original solution), lot size calculation, one-click trading, scale in and out of trades (partial close),  Works with all symbols not just currency pairs, perfect works on DAX, NASDAQ, GOLD, ...... I earn every day during live stream on ZakopiecFX - join Me Risk by lot Risk by percent SL by points SL by Candle, Renko, RangeBar ( original solution) TP by point TP by Risk/Reward Auto Trailing by P
Program Overview: This program is a trading tool designed to monitor and analyze the 7 major currency pairs. It is a variant of a similar program used for tracking stock indices, but this version focuses on the seven major currency pairs. The program helps in identifying and calculating significant price movements (gaps) between the high and low prices of these currency pairs over a specified time frame. It then provides insights through comments and alerts based on the calculated gaps. Major Cu
VN Trade Panel II
Vyacheslav Nekipelov
4 (1)
The new version of the trading panel, which now has the ability to separately close Buy and Sell orders, display targets for all orders on the chart, as well as the ability to use the panel to trade with brokers working on the FIFO rule. Also, the new version adds option buttons for separate management of open orders. It has a convenient visualized interface and intuitive control without a lot of additional tabs to which traders have to be distracted and switch their attention. Thanks to this,
Easy Trade Indicator – Your Path to Profitable Trades! Work any Time Frame! Maximize your profits with precise and assertive trades! ️ Trade with comfort – the indicator does the analysis and you only open the order in the direction in which the indicator shows you!  Exclusive panel with past trade counter and accuracy tracking! Simplify your analysis, boost your performance, and trade with confidence! Get it now and take your trading to the next level
Was: $249  Now: $99   Market Profile defines a number of day types that can help the trader to determine market behaviour. A key feature is the Value Area, representing the range of price action where 70% of trading took place. Understanding the Value Area can give traders valuable insight into market direction and establish the higher odds trade. It is an excellent addition to any system you may be using. Blahtech Limited presents their Market Profile indicator for the MetaTrader community. Ins
The MarketView utility is designed to display the market changes in percents as a table over the specified time interval. Every column element can be disabled. The color scheme can be easily and quickly customized for your needs. The number of symbols in columns can be adjusted ( PerColumn ). The MarketView also allows to open chart of any symbol by simply clicking its name. It can automatically apply any customized template to the newly opened chart. Attention! In order to remove any symbol fro
設定した時差で時間ラインを表示します。(30分単位の時差には対応していません。) また、100.000、.100、.200のようにキリの良い価格で価格ラインを表示します。 標準ではMT4による時間と価格でグリッドラインが表示されていますが、ブローカーの時間となり価格とともに中途半端な位置で表示されるので、非常に分かりにくいものとなっています。 それを非表示にし ユーザーが設定した時差と価格の分かりやすい位置でグリッドラインを表示します 。他のEAや裁量取引に負荷をかけないよう、軽快に動作するよう実装しております。 時間ラインは未来の時間も表示 します。事前に節目となる時間の把握ができます。(土日の時間軸は表示されません。) アジア、EU、USの時間帯を色付きで表示できます。 マーケットの開始時刻や、イベントの時間など特定の時間をSpecial Timeとしてラインを表示することができます。 パラメーター説明 ・Time offset:  MT4上の時間に対する時差を設定します。 ・Bars time range:  時間ラインを表示する範囲をバーの本数で設定します。 ・Price
インディケータは現在のクオートを作成し、これを過去のものと比較して、これに基づいて価格変動予測を行います。インジケータには、目的の日付にすばやく移動するためのテキスト フィールドがあります。 オプション: シンボル - インジケーターが表示するシンボルの選択; SymbolPeriod - 指標がデータを取る期間の選択; IndicatorColor - インジケータの色; HorisontalShift - 指定されたバー数だけインディケータによって描画されたクオートのシフト; Inverse - true は引用符を逆にします。false - 元のビュー。 ChartVerticalShiftStep - チャートを垂直方向にシフトします (キーボードの上下矢印)。 次は日付を入力できるテキストフィールドの設定で、「Enter」を押すとすぐにジャンプできます。
デモ口座向け無料版   |   MT5   バージョン SmartLot   MT4  は、チャートから直接ロットを素早く計算し、ペンディングオーダーやマーケットオーダーを発注するための、インタラクティブでシンプルなパネルです。 ストラテジーテスターでは動作しません 。ユーティリティをテストするには、デモ口座用の無料版をダウンロードしてください。説明文の冒頭に手順とファイルがあります。 機能: グラフィカルインターフェース: 利益と損失の領域を色分けした、インタラクティブなエントリー、SL、TPライン。 リアルタイム計算: SL/TPレベルを変更すると、パネルが自動的にリスク/利益値(通貨 / ピップス / %)を再計算します。 執行: グラフィックライン上のボタンをクリックして注文を実行します。主要な注文タイプをサポート。 リスク管理: 動的ロット(預入金の割合)または固定ボリュームで作業するための組み込みモジュール。 個別マジックナンバー: 各注文ごとに個別にマジックナンバーを指定可能。
Description: Please tick "Show object descriptions" in chart properties to enable hrays views That utility converts a trendline into a horizontal ray known as tool for drawing supply and demand zones. Simply create a trendline on a chart and once selected, it will get converted. Ray remains horizontal while dragging.  Quick ray plot: press "R" key to create horizontal ray. It will be snapped to the nearest OHLC value Further versions will be improved. For feature request please post new comm
This indicator will mirror the assets in use in another metatrader, being able to choose the timeframe and a template. This is the Metatrader 4 Client, it needs the Metatrader 4 or 5 Server versions: Metatrader 4 Mirror Chart Server: https://www.mql5.com/en/market/product/88644 Metatrader 5 Mirror Chart Server:   https://www.mql5.com/en/market/product/88652 Details of how it works in the video.
FREE
An indicator of patterns #24, #25, #26 and #27 ("Head and Shoulders", "Complex Head and Shoulders") from Encyclopedia of Chart Patterns by Thomas N. Bulkowski. Parameters: Alerts - show alert when an arrow appears   Push - send a push notification when an arrow appears (requires configuration in the terminal) PeriodBars - indicator period K - an additional parameter that influences the accuracy of pattern shape recognition. The smaller the value is, the smoother the row of peaks/valleys should
The PatternMMB trading indicator finds the most common candlestick analysis patterns and provides trading recommendations based on them. The PatternMMB trading indicator is designed to search for candlestick patterns on the price chart and issue trading recommendations depending on the nature of the found candlestick pattern. It is also possible to send sound notifications when all or any of the selected patterns appear, with an explanation of the pattern and its interpretation. In addition, th
You can change the time period of the chart at the touch of a button. You can also change multiple charts at the touch of a button. You can also change multiple charts at the touch of a button, saving you the trouble of changing time periods. We are live-streaming the actual operation of the system. https://www.youtube.com/@ganesha_forex We do not guarantee your investment results. Investments should be made at your own risk. We sharll not be liable for any disadvantage or damage caused by th
これは、キャンドルの終値を予測する指標です。 このインジケータは、主にD1チャートでの使用を目的としていますが. この指標は、従来の外国為替取引とバイナリオプション取引の両方に適しています。 インジケーターは、スタンドアロンのトレーディングシステムとして使用することも、既存のトレーディングシステムへの追加として機能させることもできます。 このインジケーターは、現在のキャンドルを分析し、キャンドル自体の内部の特定の強度係数と、前のキャンドルのパラメーターを計算します。 したがって、この指標は、市場の動きのさらなる方向性と現在のキャンドルの終値を予測します。 この方法のおかげで、この指標は、短期の日中取引だけでなく、中期および長期の取引にも適しています。 インジケーターを使用すると、市場の状況の分析中にインジケーターが生成する潜在的な信号の数を設定できます。 インジケーターの設定には、このための特別なパラメーターがあります。 また、インジケーターは、チャート上のメッセージの形式で、電子メールで、およびPUSH通知の形式で、新しい信号について通知することができます。 購入後は必ず私に書いて
This indicator is a conventional analytical tool for tick volumes changes. It calculates tick volumes for buys and sells separately, and their delta on every bar, and displays volumes by price clusters (cells) within a specified bar (usually the latest one). The algorithm used internally is the same as in the indicator VolumeDelta , but results are shown as cumulative volume delta bars (candlesticks). Analogous indicator for MetaTrader 5 exists - VolumeDeltaBars . This is a limited substitution
「Auto FIBO Pro」Crypto_Forex インジケーターは、取引の補助ツールとして最適です。 - インジケーターは、フィボナッチ レベルとローカル トレンド ライン (赤色) を自動的に計算してチャート上に配置します。 - フィボナッチ レベルは、価格が反転する可能性のある重要な領域を示します。 - 最も重要なレベルは、23.6%、38.2%、50%、61.8% です。 - リバーサル スキャルピングやゾーン グリッド取引に使用できます。 - Auto FIBO Pro インジケーターを使用して、現在のシステムを改善する機会も多数あります。 - Info Spread Swap Display があり、接続されている外国為替ペアの現在のスプレッドとスワップを表示します。 - ディスプレイには、アカウントの残高、エクイティ、マージンも表示されます。 - Info Spread Swap Display は、チャートのどのコーナーにも配置できます。 0 - 左上コーナー、1 - 右上、2 - 左下、3 - 右下。 高品質のトレーディングロボットとインジケーターをご覧にな
Phase Analytics Pro: Advanced Cyclic Market Analyzer Phase Analytics Pro is a sophisticated technical tool designed for traders who prioritize mathematical precision over lag-heavy traditional indicators. Based on the principles of digital signal processing, this indicator decomposes price action into phase and quadrature components to identify the dominant market cycle. How it works: The algorithm calculates the instantaneous phase of the market, allowing it to distinguish between trending and
This indicator displays the histogram and arrows on chart. When Simple The Best Pro are placed on a chart, they identify the trend.  The color of may be blue or red. The blue color stands for upside moves and the red color stands for downside trends. The indicator offers to set Stop Loss (SL) and  Take Profit (TP)  setting. The default value is ATR. Indicator has automatic optimization. The STB is a unique indicator that shows the tendency (button Bars) of a particular signals. The STB tells us
Session Shade (MT4) – Non-Trading Hours Background Shading Overview Session Shade is a lightweight MT4 chart utility indicator that visually highlights non-trading hours by shading the chart background. It is designed to help you confirm your daily time-filter window at a glance. This is a visualization tool only. It does not generate trading signals and it does not place, modify, or close any orders. Key features Shades non-trading hours (NG) on the chart background Keeps trading hours (OK) cl
FREE
Smart Backtest
Mr Chaiyaporn Boonsamorn
For those who are still not confident in their system or are testing new techniques to make it easier without wasting time to change the charts one by one, we recommend EA Smart Backtest to help you backtest your system efficiently. -The EA is intended to Backtest your system.   -Able to open buy or sell in visual mode and can modify values ​​for LOT, SL, TP.   -The chart also shows the Balance Equity Profit status. -Can choose to close, Buy, Close, Sell
This utility is designed to help you with your Manual Trading. It allows different ways of closing trades. It can display total number of BUY and SELL orders individually and also their individual profits. It can enter trades without stopl loss and take profits. However upon selecting UseStopLossTakeProfit from the settings it can use best possible stop loss and take profits based on the market conditions. Upon selecting the CloseOppositeTrades  from the settings it can close opposite trades. Fo
Market Profile Shows where the price has spent more time, highlighting important levels that can be used in trading. It is a powerful tool which is designed to take the fundamental components which comprise every market; price/volume/time, and visually display their relationship in real-time as the market develops for a pre-determined time period. Very powerful tool!
We present you the indicator "Candle closing counter", which will become your indispensable assistant in the world of trading. That’s why knowing when the candle will close can help: If you like to trade using candle patterns, you will know when the candle will be closed. This indicator will allow you to check if a known pattern has formed and if there is a possibility of trading. The indicator will help you to prepare for market opening and market closure. You can set a timer to create a pre
The indicator shows the potential trend direction by cyclical-wave dependence. Thus, all the rays of the intersection will be optimal rays, in the direction of which the price is expected to move, taking into account the indicator period. Rays can be used as a direction for potential market movement. But we must not forget that the approach must be comprehensive, the indicator signals require additional information to enter the market.
このプロダクトを購入した人は以下も購入しています
Trade Assistant MT4
Evgeniy Kravchenko
4.42 (193)
取引 ごとのリスクの 計算、新規注文 の 簡単 な 設置、部分的 な 決済機能 を 持 つ 注文管理、 7 種類 のトレーリングストップなど 、便利 な 機能 を 備 えています 。 追加の資料と説明書 インストール手順 - アプリケーションの手順 - デモアカウント用アプリケーションの試用版 ライン機能 チャート上にオープニングライン、ストップロス、テイクプロフィットを表示します。この機能により、新規注文を簡単に設定することができ、注文を出す前にその特徴を確認することができます。   リスク計算 リスク計算機能は、設定されたリスクとストップロス注文のサイズを考慮して、新規注文のボリュームを計算します。ストップロスの大きさを自由に設定できると同時に、設定したリスクを守ることができます。 Lot calc ボタン - リスク 計算 を 有効 / 無効 にします 。 Risk フィールドでは 、必要 なリスクの 値 を 0 から 100 までのパーセンテージまたは 預金通貨 で 設定 します 。 設定」 タブで 、 リスク 計算 の 種類 を 選択 します :「 $ 通貨」、「 % 残
Trade Manager EAへようこそ。これは、取引をより直感的、正確、そして効率的にするために設計された究極の リスク管理ツール です。これは単なるオーダー実行ツールではなく、包括的な取引計画、ポジション管理、リスク管理のためのソリューションです。初心者から上級者、迅速な実行を必要とするスキャルパーまで、Trade Manager EAはあらゆるニーズに対応し、為替、指数、商品、暗号通貨などさまざまな市場で柔軟に対応します。 Trade Manager EAを使用すると、複雑な計算が過去のものになります。市場を分析し、エントリーポイント、ストップロス、テイクプロフィットのレベルをチャート上のラインでマークし、リスクを設定するだけで、Trade Managerが最適なポジションサイズを即座に計算し、SLとTPをピップ、ポイント、口座通貨でリアルタイムに表示します。すべての取引が簡単かつ効果的に管理されます。 主な機能: ポジションサイズ計算機 :定義されたリスクに基づいて取引サイズを瞬時に決定します。 簡単な取引計画 :エントリー、ストップロス、テイクプロフィットを設定するためのド
Local Trade Copier EA MT4
Juvenille Emperor Limited
4.96 (107)
Local Trade Copier EA MT4 による、驚くほど高速な取引コピーを体験してください。1分で簡単にセットアップできるこの取引コピー機は、同じWindowsコンピュータまたはWindows VPS上の複数のMetaTrader端末間で取引をコピーすることができ、0.5秒未満の高速コピースピードを実現します。 初心者であろうとプロのトレーダーであろうと、 Local Trade Copier EA MT4 には、あなたの特定のニーズに合わせてカスタマイズするための幅広いオプションが用意されています。これは、利益の可能性を高めたい人にとって究極のソリューションです。 今すぐ試してみて、これが市場で最も速くて簡単なトレードコピー機である理由を理解してください。 ヒント: デモアカウントで Local Trade Copier EA MT4 デモバージョンをダウンロードして試すことができます: ここ ダウンロードした無料のデモ ファイルを MT4 >> ファイル >> データ フォルダを開く >> MQL4 >> Experts フォルダに貼り付けて、ターミナルを再起動しま
Copy Cat More Trade Copier MT4 (コピー猫MT4) は単なるローカル取引コピーツールではなく、現代の取引課題に対応するために設計された完全なリスク管理と実行フレームワークです。Propファームのチャレンジから個人の資産管理まで、強力な実行力、資金保護、柔軟な設定、高度な取引処理を組み合わせ、あらゆる状況に適応します。 このコピーツールは Master(送信側) と Slave(受信側) の両モードで動作し、成行注文や指値注文のリアルタイム同期、取引修正、部分決済、Close By 操作をサポートします。デモ口座・リアル口座の両方に対応し、取引用パスワードまたは投資家パスワードでも利用可能です。Persistent Trade Memory 技術により、EA・ターミナル・VPS が再起動しても復元可能です。複数の Master と Slave を同時に管理でき、ブローカー間の違いはプレフィックス/サフィックスの自動調整やシンボルマッピングで処理されます。 マニュアル/設定: Copy Cat Trading Copier マニュアル Copy Cat Mo
The product will copy all telegram signal to MT4   ( which you are member  ) , also it can work as remote copier.  Easy to set up, copy order instant, can work with almost signal formats, image signal, s upport to translate other language to English Work with all type of channel or group, even channel have "Restrict Saving Content", work with  multi channel, multi MT5 Work as remote copier: with signal have ticket number, it will copy exactly via ticket number. Support to backtest signal. How to
Trade copier MT4
Alfiya Fazylova
4.58 (33)
Trade Copierは、取引口座間の取引をコピーして同期するように設計された専門的なユーティリティです。 コピーは、同じコンピューターまたはvps にインストールされている、サプライヤーのアカウント/端末から受信者のアカウント/端末に行われます。 購入する前に、デモ アカウントでデモ バージョンをテストできます。 デモ版 こちら 。 詳細な説明は こちら 。 主な機能と利点: MT5ネッティングアカウントを含む、MT4> MT4、MT4> MT5、MT5> MT4のコピーをサポートします。 高いコピー速度(0.5秒未満)。 ベンダーモードと受信者モードは同じ製品内に実装されています。 チャートから直接リアルタイムでコピーを制御できる、簡単で直感的なインターフェイス。 接続が切断されたり、端末が再起動されたりしても、設定と位置が失われることはありません。 コピーするシンボルを選択できます。また、受信者のシンボルを置き換えることもできます(例:EURUSD> USDJPY)。 バックコピーをサポートします。 特定の注文のみのコピーを有効にする機能。 取引開始価格の最大差と最大遅延時間を
Exp COPYLOT CLIENT for MT4
Vladislav Andruschenko
4.69 (65)
MetaTrader4のコピー機を取引します。     それは任意の口座からの外国為替取引、ポジション、注文をコピーします。 それは最高の貿易コピー機の1つです     MT4 - MT4、MT5 - MT4     のために     COPYLOT MT4     バージョン(または     MT4 - MT5  MT5 - MT5     のために     COPYLOT MT5     バージョン)。 MT5のバージョン 完全な説明   +DEMO +PDF 購入する方法 インストールする方法     ログファイルの取得方法     テストと最適化の方法     Expforex のすべての製品 のコピー機 バージョン       MetaTrader 5 ターミナル(   МТ5 - МТ5、МТ4 - МТ5   )-   コピーロットクライアントMT5 独自のコピーアルゴリズムにより、すべての取引がマスターアカウントからクライアントアカウントに正確にコピーされます。 また、動作速度が速いことでも知られています。タフなエラー処理。 強力な機能セット。 プログラムは、複数
Tired of complex order placement and manual calculations? Trade Dashboard is your solution. With its user-friendly interface, placing orders becomes effortless, by a single click, you can open trades, set stop loss and take profit levels, manage trade lot size, and calculate risk to reward ratios, allowing you to only focus on your strategy. Say goodbye to manual calculations and streamline your trading experience with Trade Dashboard. Download  Demo Version  right now. You can find  Details of
MT4 to Telegram Signal Provider は使いやすく、完全にカスタマイズ可能なツールで、Telegramに信号を送信し、あなたのアカウントを信号提供者に変えることができます。 メッセージのフォーマットは 完全にカスタマイズ可能です! しかし、簡単な使用のために、あらかじめ定義されたテンプレートを選択し、メッセージの特定の部分を有効または無効にすることもできます。 [ デモ ]   [ マニュアル ] [ MT5バージョン ] [ Discordバージョン ] [ Telegramチャンネル ]  New: [ Telegram To MT5 ] セットアップ ステップバイステップの ユーザーガイド が利用可能です。 Telegram APIの知識は必要ありません。開発者が必要なものをすべて提供します。 主要機能 購読者に送信される注文の詳細をカスタマイズする機能 例えばブロンズ、シルバー、ゴールドなど、階層型のサブスクリプションモデルを作成できます。ゴールドサブスクリプションでは、すべての信号が得られますなど。 ID、シンボル、またはコメントによる注文のフ
これは視覚的な取引パネルであり、取引を簡単に配置および管理し、人為的エラーを回避し、取引活動を強化するのに役立ちます。使いやすい視覚的なインターフェースと、健全なリスクおよび位置管理アプローチを組み合わせています。 [ インストールガイド | 更新ガイド | トラブルシューティング | よくある質問 | すべての製品 ] 驚くほど使いやすい チャートから簡単に取引 正確なリスク管理との取引、手間のかからない 資本の保存が最優先事項です 気をつけずに利益を上げましょう できるだけ早くリスクのない取引をお楽しみください 開かれているすべての取引の自動トレーリングストップ 最初のストップロスは、取引が行われるとすぐに配置されます EAは、取引を行った後に次のタスクを実行します。 最初のストップロス/テイクプロフィットは自動的に配置されます できるだけ早くフリーライドにロックします(オプション) ストップロスを初めて損益分岐点に移動します(オプション) 停止するまで、希望の方法を使用してストップロスを追跡します その他のクールな機能は次のとおりです。 優れたターミナルアクティビティレポート
MT4 to Discord Signal Provider は、Discord へ直接トレーディングシグナルを送信するために設計された、使いやすく完全にカスタマイズ可能なユーティリティです。このツールは、あなたのトレーディングアカウントを効率的なシグナルプロバイダーに変えます。 スタイルに合わせてメッセージフォーマットをカスタマイズ!利便性を考え、事前にデザインされたテンプレートから選択し、メッセージのどの要素を含めるか除外するかを選択できます。 [ デモ ] [ マニュアル ] [ MT5 バージョン ] [ Telegram バージョン ]  New: [ Telegram To MT5 ] セットアップ 簡単なセットアップのために、私たちの詳細な ユーザーガイド に従ってください。 Discord API の事前知識は必要ありません。必要なツールはすべて提供されます。 主な特徴 購読者の更新のための注文詳細をカスタマイズ。 ブロンズ、シルバー、ゴールドなど、各レベルで異なるシグナルアクセスを提供する階層的サブスクリプションモデルを実装。 注文が実行されたチャートのスクリーン
Riskless Pyramid
Snapdragon Systems Ltd
5 (1)
Introduction This powerful MT4 trade mangement EA offers a way potentially to aggressively multiply trade profits in a riskfree manner. Once a trade has been entered with a defined stoploss and take profit target then the EA will add three pyramid add-on trades in order to increase the overall level of profit. The user sets the total combined profit target to be gained if everything works out. This can be specified either as a multiple of the original trade profit or as a total dollar amount. Fo
Trade Manager は、リスクを自動的に計算しながら、取引を迅速に開始および終了するのに役立ちます。 過剰取引、復讐取引、感情的な取引を防止する機能が含まれています。 取引は自動的に管理され、アカウントのパフォーマンス指標はグラフで視覚化できます。 これらの機能により、このパネルはすべてのマニュアル トレーダーにとって理想的なものとなり、MetaTrader 4 プラットフォームの強化に役立ちます。多言語サポート。 MT5バージョン  |  ユーザーガイド + デモ Trade Manager はストラテジー テスターでは機能しません。 デモについてはユーザーガイドをご覧ください。 危機管理 % または $ に基づくリスクの自動調整 固定ロットサイズを使用するか、ボリュームとピップに基づいた自動ロットサイズ計算を使用するオプション RR、Pips、または価格を使用した損益分岐点ストップロス設定 トレーリングストップロス設定 目標に達したときにすべての取引を自動的に終了するための 1 日あたりの最大損失 (%)。 過度のドローダウンからアカウントを保護し、オーバートレードを防ぎま
Seconds Chart — MetaTrader 4で秒足チャートを作成するユニークなツールです。 Seconds Chart を使用すると、秒単位のタイムフレームでチャートを構築でき、標準的な分足や時間足チャートでは得られない柔軟性と分析精度を実現します。例えば、 S15 は15秒足を表します。あらゆるインジケーター、エキスパートアドバイザー、スクリプトを利用可能で、標準的なチャートと同様に便利に操作できます。 標準的なツールとは異なり、 Seconds Chart は超短期のタイムフレームでも高い精度と遅延なく作業できるように設計されています。 Seconds Chartの利点 1秒から900秒 までのタイムフレームをサポート。 瞬時の読み込み MT5ターミナルからのティックデータベースのインポートにより、過去データを即時利用可能。 MT5ターミナルで「 Tick Database 」ユーティリティを最初に起動する必要があります。 リアルタイムでデータが更新され、 遅延やラグなし 。 複数の秒足チャートを同時に作成可能。 Seconds Chartが最適な用途 スキャルピング
Trading History - A program for trading and money management on the history of quotes in stratagy tester. It can work with pending and immediate orders, and is equipped with trailing stop, breakeven and take profit functions. Very good for training and testing different strategies. Manual (Be sure to read before purchasing) Advantages 1. Allows you to test any trading strategy in the shortest possible time 2. An excellent simulator for trading training. You can gain months of trading experience
MetaQuant PRO is a professional account analytics dashboard for MetaTrader 4, built to give traders a clear, visual, and data-driven view of their trading performance directly inside MT4. It converts your account history into clean metrics, charts, and insights without relying on external websites or spreadsheets. Main features • Overview (full account) • Daily (today only) • Monthly (current month) • All-Time (entire history) Visual performance analysis • Smooth equity curve from real closed t
News Filter EA: Advanced Algo Trading Assistant News Filter EA is an advanced algo trading assistant designed to enhance your trading experience. By using the   News Filter EA , you can integrate a Forex economic news filter into your existing expert advisor, even if you do not have access to its source code. In addition to the news filter, you can also specify   trading days   and   hours   for your expert. The News Filter EA also includes   risk management   and   equity protection   features
TelegramからMT4へ: 究極のシグナルコピーソリューション Telegram to MT4 は、DLLを必要とせず、TelegramのチャンネルやチャットからMetaTrader 4プラットフォームに取引シグナルを直接コピーできる最先端のユーティリティです。この堅牢なソリューションは、比類のない精度とカスタマイズオプションにより、シグナルのシームレスな実行を保証し、時間を節約し、効率性を向上させます。 [ Instructions and DEMO ] 主な特徴 直接的なTelegram API統合 電話番号とセキュアコードで認証します。 ユーザーフレンドリーな EXE ブリッジを使用して、チャット ID を簡単に取得および管理します。 複数のチャネル/チャットを追加、削除、更新して、同時に信号をコピーします。 高度なフィルターによる信号解析 カスタム例外語 (例: 「レポート」、「概要」) を含む不要な信号をスキップします。 柔軟な SL および TP 形式 (価格、ピップ、ポイント) をサポートします。 シグナルが価格ではなくポイントを指定する場合、エントリ ポイントを自動
このユーティリティを使用すると、マスター設定のある端末からスレーブ設定の他の端末にトランザクションをコピーできます 同時に、コピーするペアを選択し、いくつかのパラメータに従ってコピーされた順序のサイズを設定することができます。 ドローダウン損失制限を設定するか、収益性の高い取引のみをコピーします あなたは、他のブローカーのMT4またはMT5にMT4またはMT5から取引をコピーすることができます これで、MT4で作業している専門家の信号をMT5端末にコピーするか、またはバックすることは難しくありません コピーマスターを使用して、他のシグナル、Expert Advisors、手動取引から任意の取引をコピーします。  設定を使用して、ロットサイズ、取引方向を変更し、収益性の高い取引のみをコピーし、預金を保存するための値を設定することができます  コピーマスターは、一つのアカウント上の異なるサブスクリプションシグナルのいくつかの戦略を組み合わせることができます 取引をMT4にコピーするには、コピーマスター MT5バージョンが必要です。 https://www.mql5.com
Risk/Reward Toolは、MetaTrader 4でのトレード計画、可視化、執行の方法を革新するために設計されたプロフェッショナルグレードのエキスパートアドバイザーです。精密なリスク管理を重視する裁量トレーダーでも、トレード設定を視覚的にテストする必要のある戦略開発者でも、このツールはエレガントで直感的なインターフェースで必要なすべてを提供します。 基本的なポジション計算機とは異なり、Risk/Reward Toolは視覚的なトレード計画を即時執行機能、リアルタイムの損益モニタリング、包括的なトレード管理機能と組み合わせています。このツールはMT4ストラテジーテスターと完全に互換性があり、実際の資金をリスクにさらすことなくトレード戦略を練習し、アプローチを改善することができます。 ツールの完全なマニュアルはこちら: https://www.mql5.com/en/blogs/post/766244 MT5 version:  https://www.mql5.com/en/market/product/158601 主な機能 視覚的なトレード計画 ドラッグ&ドロップ操作可能
手動取引を改善: Trade Manager Assistant による正確で高速な自動リスク管理 提供されている無料のデモ バージョンを使用して、完全なセットアップ手順を入手し、Trade Manager Assistant の機能を調べてください。より詳しい情報は https://www.mql5.com/blogs/post/758625 をご覧ください。       。 手動取引では、慎重な分析と迅速な意思決定が必要ですが、実行エラー、矛盾、取引パラメータの混乱のリスクにより、利益が損なわれ、不必要なストレスがかかる可能性があります。 Trading Manager Assistant のご紹介: 手動取引プロセスを効率化するように設計された必須アシスタントで、チャートに精度、制御、自動化された効率をもたらします。 実行の遅さや計算ミスによる取引損失とはお別れです。アシスタント ビジネス マネージャーは、プロフェッショナルのスピードと正確さで業務を遂行できるようサポートし、重要な管理タスクを処理している間、ビジネス チャンスの発見に集中できるようにします。これは単なるウィザー
TradePanel MT4
Alfiya Fazylova
4.85 (92)
Trade Panel は、多機能の取引アシスタントです。このアプリケーションには手動取引用の 50 を超える取引機能が含まれており、ほとんどの取引操作を自動化できます。 注意、アプリケーションはストラテジー テスターでは動作しません。購入する前に、デモアカウントでデモ版をテストできます。デモ版 ここ 。 完全な手順 こちら 。 取引。 ワンクリックで取引操作を実行できます: 自動リスク計算を使用して未決の注文とポジションをオープンします。 ワンクリックで複数の注文とポジションをオープンします。 注文グリッドを開きます。 未決の注文とポジションをグループごとにクローズします。 ポジション反転 (買いを閉じて売りを開く、または売りを閉じて買いを開く)。 ポジションをロックします(買いポジションと売りポジションの量を均等にする追加のポジションをオープンします)。 ワンクリックですべてのポジションを部分的にクローズします。 すべてのポジションのテイクプロフィットとストップロスを同じ価格レベルに設定します。 すべてのポジションのストップロスをポジションの損益分岐点レベルに設定します。 注文とポ
Comprehensive on chart trade panel with the unique ability to be controllable from mobile as well. Plus has a library of downloadable configuration, e.g. exit rules, extra panel buttons, pending order setup and more. Please see our product video. Works with all symbols not just currency pairs. Features On chart panel plus controllable from free app for Windows, iPhone and Android Built-in script engine with library of downloadable configuration, e.g. add 'Close All Trades in Profit' button, exit
News Loader Pro is a tool that automatically updates every economic news in real time with detailed information from several online data sources. It uses the unique technology to load data with full details from popular Forex websites. An alert will be sent to your mobile/email before an upcoming news release. Moreover, it also marks the news release points on the chart for further review and research. In Forex trading, news is one of the important factors that move the market. Sticking with new
EchoTrade Telegram to MT5 Copier Seamless, Instant, and Reliable Signal Copying - Direct from Telegram to MetaTrader 4! The product does not run in the strategy tester but you can get free trial version   here  for testing before purchase. Tired of manually executing trades from Telegram signals? EchoTrade automates the process, instantly copying trades from any Telegram channel or group directly into your MT5 account—accurately, efficiently, and without delay. Key Features: Universal Compatib
EASY Insight AIO – スマートで手間いらずな取引のオールインワンソリューション 概要 数秒で市場全体——FX、ゴールド、暗号資産、指数、さらには株式まで——を、手作業のチャート確認や複雑なセットアップ・インジケーター導入なしにスキャンできたらどうでしょうか? EASY Insight AIO はAIトレードのための究極のプラグ&プレイ型エクスポートツールです。市場全体のスナップショットを、クリーンなCSVファイルで一括出力。ChatGPT、Claude、Gemini、Perplexityなど、さまざまなAIプラットフォームで即座に解析できます。 ウィンドウの切り替えやグラフのごちゃごちゃしたオーバーレイはもう不要。自動エクスポートされる純粋で構造化されたインサイトだけで、無駄なチャート監視に悩まされず、スマートなデータ主導の判断に集中できます。 なぜEASY Insight AIOなのか? 本当のオールインワン • セットアップ不要、インジケーターのインストール不要、チャートへのオーバーレイ不要。インストールして起動し、エクスポートするだけです。 マルチアセット対
--------------Welcome to use [MQL5 Signal Analyze Master]------------------  Function: Draw order tracks of MQL5 MT4 and MT5 signal on MT4 chart. [Using guide] 1.Use it as Experts. 2.Download history record from MQL5 signal(MT4 signal or MT5 signal).  3.Paste history record file below "MQL4/Files/" 4.Load [Signal Analyze Master] on the symbol chart what you want to analyze. 5.Paste the history record file name to parameter 'FileName' 6.Select  SignalType  match the history you download on MT4
This tool for linking charts in Metatrader 4. Thanks to this tool you have to change symbol only in the main window and all other change automatically. Add this tool to all charts that you want to be linked with each other. Set one chart as a main. Change symbol in the main window and linked windows change automatically to the new symbol. Input parameter isMainChart - set true only for the main chart window. Set false for all other linked windows.
Easy Virtual Trader
Anoop Sivasankaran
4.89 (9)
Easy Virtual Traderのセットアップ>ルールの入力>モバイル、別のEA、またはどこからでも取引する準備ができました。...ロボットが取引を管理できるようにします。     この強力なEAは、事前設定のルールと設定に基づいて、すべてまたは特定の取引を自動的に管理するのに役立ちます     セットアップして実行すると、注文を監視する必要がなくなります。ソフトウェアは定義済みのルールで注文を監視および制御します     デスクトップMT4またはモバイルアプリケーションから取引するか、別のEAの取引を管理できます。     マルチプロテクションとトレーリング戦略をサポートするように設計されています。損益分岐点による保護、パーセンテージによる保護、ピップによる保護、アカウント値による保護、距離によるトレーリング、インジケーターによるトレーリングなど。 Easy Virtual Traderは、自動バージョンの多くのリクエストにより、すでに人気のあるEasy Tradeマネージャーを拡張したものです: https://www.mql5.com/en/market/produ
EA Hedger
Sergej Chukhista
4 (4)
トレーディングアドバイザーを購入したり、シグナルをサブスクライブしたり、手動でトレードしたりしましたか?!リスク管理を忘れないでください。 EA Hedger は、ヘッジを使用してリスクを管理できるようにする多くの設定を備えたプロのトレーディングユーティリティです。 ヘッジは、すでに開いているポジションとは反対のポジションを開くことを含む取引手法です。ヘッジの助けを借りて、ポジションを完全にまたは部分的にブロック(ロック)することができます。 この製品を購入することが有益なのはなぜですか。 信頼性 -アドバイザーは徹底的にチェックされ、テストされています 有用性 -Expert Advisorは実際の取引で使用され、その作業に効果的です パフォ ーマンス-ヘッジを使用した取引の結果は、ヘッジなしの取引の結果よりも大幅に優れています 可用性 -アドバイザーのコストは1か月あたりわずか4.91ドルまたは1日あたり0.17ドルです-これは1〜2スプレッドです サポート –ディスカッションでは、販売者に質問したり、アドバイスを受けたりすることができます 開発 -製品への希望を書くことができ、
作者のその他のプロダクト
Фрактальная дивергенция - это   скрытая дивергенция, построенная на фракталах Билла Вильямса. Бычья фрактальная дивергенция представляет собой комбинацию из двух нижних фракталов, последний из которых расположен ниже предыдущего, и при этом две свечи справа от минимума последнего фрактала имеют минимумы выше уровня предыдущего фрактала (см. скриншот 1). Медвежья фрактальная дивергенция - это комбинация из двух соседних верхних фракталов, последний из которых расположен выше, чем предыдущий верхн
FREE
A fractal divergence is a hidden divergence , based on Bill Williams' fractals. A bullish fractal divergence is a combination of two lower fractals, the last of which is located below the previous one, and, at the same time, two candles to the right of the Low of the last fractal have Lows higher than the previous fractal level (see screenshot 1). A bearish fractal divergence is a combination of two adjacent upper fractals, the last of which is located above the previous one, but, at the same ti
FREE
Канал фрактальной дивергенции базируется на   паттернах фрактальной дивергенции , представляя их в виде канала, границы которого изменяются в момент появления очередного паттерна. Верхняя граница канала соответствует верхней части последнего найденного медвежьего паттерна фрактальной дивергенции. Нижняя граница канала - это нижняя часть последнего найденного бычьего паттерна (см. скриншот 1). По отношению к индикатору   FractalDivergence_Patterns , канальная версия обладает теми же параметрами,
FREE
The indicator shows the number and ratio of ticks with the price growth and fall for each candle of the chart. The upper part of the histogram in the form of thin lines shows the number of price growth ticks (bullish strength), while the lower part shows the amount of price fall ticks (bearish strength). The thicker histogram bars is the difference between the strength of bulls and bears. A positive difference is displayed in green, and the negative one is red. The strength of bulls increases wh
FREE
Fractal Divergence Channel is based on the fractal divergence patterns , representing them in the form of a channel with the borders changing the moment the next pattern appears. The upper border of the channel corresponds to the upper part of the last found bearish fractal divergence pattern. The lower border of the channel is the lower part of the last found bullish pattern (see screenshot 1). Compared to the FractalDivergence_Patterns indicator, the channel version has the same parameters wit
FREE
The "Chart synchronization" utility (the SynchronizeCharts indicator) can help traders in simultaneous trading on multiple financial instruments, as it automatically scrolls all or selected charts of the terminal according to the position of the master chart.  Four charts are shown in the screenshot 1. The EURUSD chart is the master chart, as the SynchronizeCharts indicator is attached to it. As a result, the other three charts are displayed on the timeline starting from 2017.02.17 23:15. Any fu
The Expert Advisor generates trading signals based on the values of the FractalDivergence_Patterns indicator. A Buy signal is generated when the indicator detects a support level, and a Sell signal is generated when the resistance level is found (see Fig. 1: blue arrows show buying, red arrows show selling). The Expert Advisor does not require the indicator to be additionally used, and can display the appropriate support and resistance levels. Parameters The "Fractal divergence parameters" bloc
General information The indicator determines the areas of flat and trending market states by comparing the average and current volatilities. Flat areas are rectangles of a user-defined color. It is easy to determine the maximum and minimum of the flat area, as well as its height in points. The beginning of each trend area is marked with an arrow indicating the direction of the trend. Tuning parameters 1. Averaging period - period for calculating average volatility 2. Color of flat region -
The indicator identifies ordered trend structures. Each structure consists of at least three waves: the formation of the primary movement, a rollback, and a breakout of the primary movement. One wave in the structure is considered to be the market movement between opposite price extremes, which corresponded to different positions of the points of the classic Parabolic Support And Reverse (PSAR) indicator relative to the closing prices of the candles: a point below the price - searching for a m
Утилита TemplateSwitcher позволяет автоматически переключать набор используемых на графике индикаторов и объектов в зависимости от текущего таймфрейма графика и/или символа. Часто бывает так, что на графике старшего таймфрейма используется индикатор с одним периодом расчета, а для младшего таймфрейма этот же индикатор необходим с увеличенным периодом расчета. Можно, конечно же, открыть два графика разных таймфреймов с нужными периодами индикатора. Но что, если мы не можем позволить себе дублиров
フィルタ:
Trader mql5
1314
Trader mql5 2019.09.12 04:34 
 

Wow. What magic! Ihor makes GREAT products. Pity he stopped developing lately. Have all except the Fractal Div EA, will test soon.

fxcommentary
1929
fxcommentary 2017.11.11 09:58 
 

Very usefull tool, simplifies monitoring the markets.

レビューに返信