• 概要
  • レビュー
  • コメント
  • 最新情報

MarketView

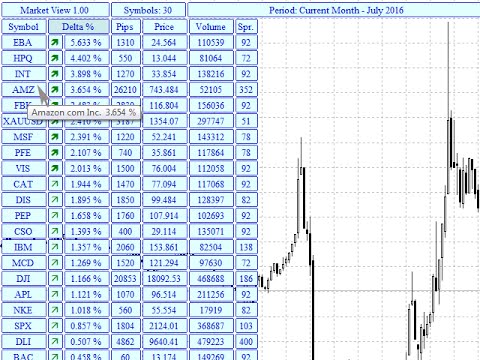
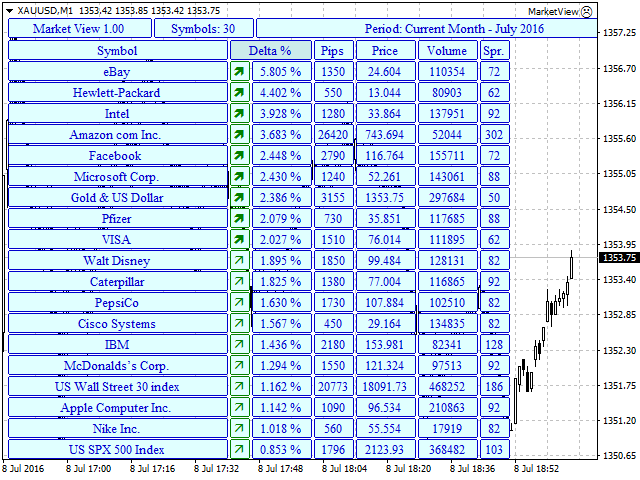
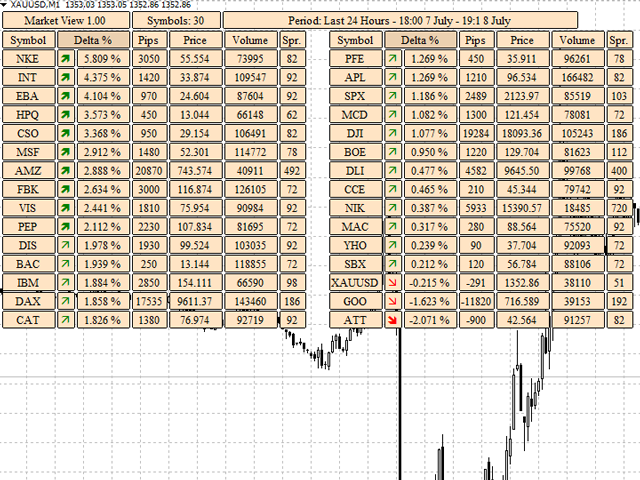
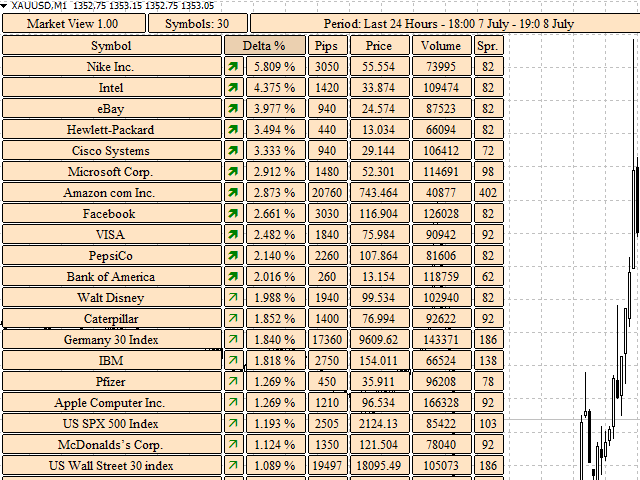
The MarketView utility is designed to display the market changes in percents as a table over the specified time interval. Every column element can be disabled. The color scheme can be easily and quickly customized for your needs. The number of symbols in columns can be adjusted (PerColumn). The MarketView also allows to open chart of any symbol by simply clicking its name. It can automatically apply any customized template to the newly opened chart.

Attention! In order to remove any symbol from the table, it is necessary to remove the utility from the symbol chart and to close the charts of the symbol (that needs to be excluded). After that, in the symbols list of the terminal hide all the unnecessary symbols and reattach the utility to the chart. Otherwise, the terminal will not allow to disable the symbols.

In order to enable/add required symbols, there is no need to remove the utility. Simply go to the symbol settings and enable the required symbols, they will be automatically added to the table. Sometimes it takes a while to download the quotes.

It can display different data, which can be enabled and disabled in the settings. It is possible to output data on different time intervals. The detailed description is available here.

The table can be directly and inversely sorted by: symbol name (Symbol), price change in % (Delta %), price change in points (Pips), volume (Volume). To sort the table simply click the column label (Symbol/Delta %/Pips/Volume).


Settings

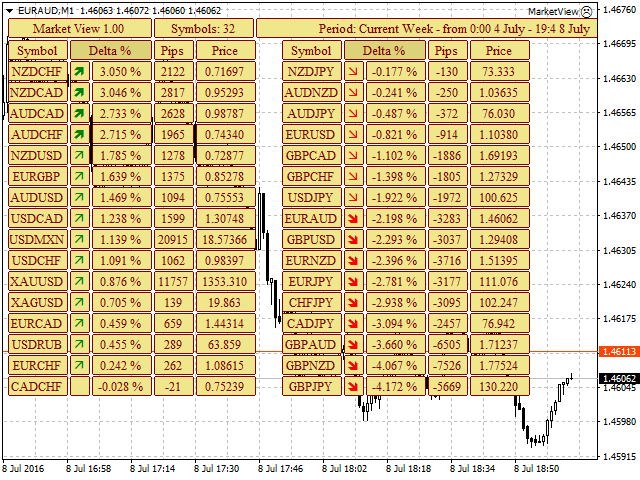
  • MinPercent - minimum price change threshold in percents (%) to display the symbol arrow. If you set MinPercent =0, then the arrows will be draws for all symbol except the ones with distinct 0.
  • MaxPercent - maximum price change threshold in percents (%) to highlight the symbol arrow with bold - significant change.
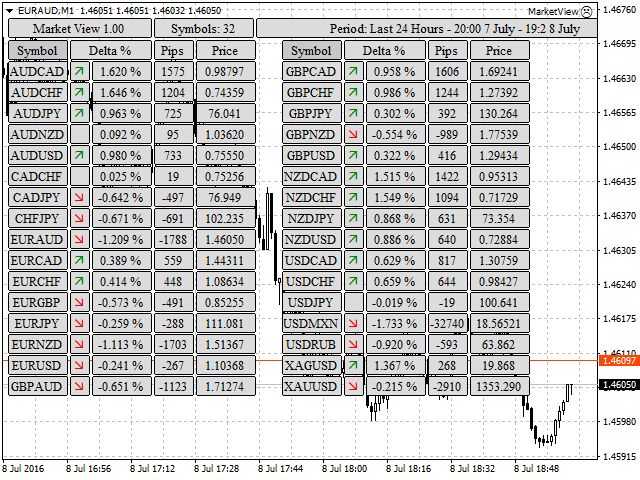
  • Symbols per column - the number of symbols in a column.
  • Show price Bid - show symbol price.
  • Short or Long name of Symbols - short or long name of the symbol (true = short).
  • Show change in % - show price changes as percentages (%).
  • Show change in pips - show price changed in points.
  • Show Volume - show volumes.
  • Show spread - show spread.
  • Display Period - select period for calculation.
  • ClickToChart - thus option allows to open a new windows for the symbol when its name is clicked (true - opening enabled, false - will not open anything).
  • TemplateName - name of the template to be applied to a newly opened chart. If ClickToChart = false, this parameter will be ignored. Example:White.tpl
  • Text color - text color.
  • Background color - Table background color.

Information in the MarketView is updated every 2 seconds.

If something should be added or modified - write in the comments.

おすすめのプロダクト
Owl smart levels
Sergey Ermolov
4.34 (35)
MT5版  |   FAQ Owl Smart Levels Indicator   は、 Bill Williams   の高度なフラクタル、市場の正しい波構造を構築する Valable ZigZag、エントリの正確なレベルをマークする Fibonacci レベルなどの一般的な市場分析ツールを含む 1 つのインジケーター内の完全な取引システムです。 利益を得るために市場と場所に。 戦略の詳細な説明 インジケータを操作するための指示 顧問-取引助手 プライベートユーザーチャット ->購入後に私に書いて、私はプライベートチャットにあなたを追加し、あなたはそこにすべてのボーナスをダウンロードすることができます 力はシンプルさにあります! Owl Smart Levels   取引システムは非常に使いやすいので、専門家にも、市場を勉強し始めて自分で取引戦略を選択し始めたばかりの人にも適しています。 戦略と指標に秘密の数式や計算方法が隠されているわけではなく、すべての戦略指標は公開されています。 Owl Smart Levels を使用すると、取引を開始するためのシグナルをすばやく確認し、
This panel is a part of the SupDem-Pro trading system and is used to search for the best opportunities for any available instruments. Which can be selected manually in the Market Watch (open it with CTRL + M). Using this trading panel in combination with ShvedSupDem-Pro_Zone allows to analyze multiple currency pairs with a single click. The panel allows to load any instruments from the Market Watch, from 6 major currency pairs up to all instruments (480). The indicator parameters Button Width
MT4 用 Forex インジケーター HTF 一目均衡表 一目均衡表は、最も強力なトレンド インジケーターの 1 つです。HTF は、Higher Time Frame を意味します。このインジケーターは、トレンド トレーダーや、プライス アクション エントリとの組み合わせに最適です。 HTF 一目均衡表を使用すると、Higher Time Frame の 一目均衡表を現在のチャートに添付できます。 上昇トレンド - 赤い線が青い線より上(両方の線が雲より上)/ 下降トレンド - 赤い線が青い線より下(両方の線が雲より下) 価格が一目均衡表の雲の上限を突破した場合にのみ買い注文をオープンします 価格が一目均衡表の雲の下限を突破した場合にのみ売り注文をオープンします HTF 一目均衡表インジケーターは大きなトレンドを捉える機会を提供します // より優れたエキスパートアドバイザーとインジケーターは、こちらで入手できます: https://www.mql5.com/en/users/def1380/seller これは、この MQL5 ウェブサイトでのみ提供されるオリジナル製品
The Best One Scalping Trade Panel functional manual trade panel with risk reward, auto SL by candle ( original solution), lot size calculation, one-click trading, scale in and out of trades (partial close),  Works with all symbols not just currency pairs, perfect works on DAX, NASDAQ, GOLD, ...... I earn every day during live stream on ZakopiecFX - join Me Risk by lot Risk by percent SL by points SL by Candle, Renko, RangeBar ( original solution) TP by point TP by Risk/Reward Auto Trailing b
Stock Indices Candle Gap Volatility Tool Designed for traders who demand precise and comprehensive analysis of candle gaps across major global stock indices. this tool provides the critical data needed for informed decision-making. Key Features: Candle Gap Analysis: Automatically display the high-low (Hi-Lo) gaps on your chart for any selected timeframe, giving you a clear view of market volatility. Wide Range of Timeframes: Analyze candle gaps (Current Candles) over multiple timeframes, providi
The indicator shows the potential trend direction by cyclical-wave dependence. Thus, all the rays of the intersection will be optimal rays, in the direction of which the price is expected to move, taking into account the indicator period. Rays can be used as a direction for potential market movement. But we must not forget that the approach must be comprehensive, the indicator signals require additional information to enter the market.
The indicator detects and displays М. Gartley's Butterfly pattern. The pattern is plotted by the extreme values of the ZigZag indicator (included in the resources, no need to install). After detecting the pattern, the indicator notifies of that by the pop-up window, a mobile notification and an email. The pattern and wave parameters are displayed on the screenshots. The default parameters are used for demonstration purposes only in order to increase the amount of detected patterns. Parameters
Market Viewer This utility seeks to assist the trader in identifying potential areas of interest on the price chart. Different components integral to decision making have been automated, allowing the user to engage with perfectly calculated levels. Some components include the weeks initial balance, session Min and Max areas and a round number indicator altogether forming templates providing confidence to the trader. Have a look at the screenshots for a sneak peak into the components. The utility
VR Cub
Vladimir Pastushak
VR Cub は、質の高いエントリーポイントを獲得するためのインジケーターです。このインジケーターは、数学的計算を容易にし、ポジションへのエントリーポイントの検索を簡素化するために開発されました。このインジケーターが作成されたトレーディング戦略は、長年にわたってその有効性が証明されてきました。取引戦略のシンプルさはその大きな利点であり、初心者のトレーダーでもうまく取引することができます。 VR Cub はポジション開始ポイントとテイクプロフィットとストップロスのターゲットレベルを計算し、効率と使いやすさを大幅に向上させます。取引の簡単なルールを理解するには、以下の戦略を使用した取引のスクリーンショットを見てください。 設定、設定ファイル、デモ版、説明書、問題解決方法は、以下から入手できます。 [ブログ] レビューを読んだり書いたりすることができます。 [リンク] のバージョン [MetaTrader 5] エントリーポイントの計算ルール ポジションをオープンする エントリーポイントを計算するには、VR Cub ツールを最後の高値から最後の安値までストレッチする必要があります。
Real-time spread tracking and monitoring software Displays spread values in form of histograms on current timeframe of chart Convenient for analyzing spread changes, as well as for comparing trading conditions of different brokers By placing on desired chart, the spread changes at different trading times are displayed Additionally Fully customizable Works on any instrument Works with any broker
FREE
The indicator displays the data of the Stochastic oscillator from a higher timeframe on the chart. The main and signal lines are displayed in a separate window. The stepped response is not smoothed. The indicator is useful for practicing "manual" forex trading strategies, which use the data from several screens with different timeframes of a single symbol. The indicator uses the settings that are identical to the standard ones, and a drop-down list for selecting the timeframe. Indicator Parame
Smart Backtest
Mr Chaiyaporn Boonsamorn
For those who are still not confident in their system or are testing new techniques to make it easier without wasting time to change the charts one by one, we recommend EA Smart Backtest to help you backtest your system efficiently. -The EA is intended to Backtest your system.   -Able to open buy or sell in visual mode and can modify values ​​for LOT, SL, TP.   -The chart also shows the Balance Equity Profit status. -Can choose to close, Buy, Close, Sell
価格アクショントレードパネルMT4は、指定された(デフォルトでは8)過去のろうそくの純粋な価格アクションデータに基づいて、任意のシンボル/楽器の売買力レベルのバランスを計算します。これにより、インジケーターのパネルで利用可能な32のシンボル/商品の価格アクションを監視することにより、可能な限り最も近い市場センチメントが得られます。 60%を超える売買力レベルは、特定のシンボルを売買するための非常に堅実なレベルを提供します(デフォルト設定を使用)。価格アクショントレードパネルMT4には、価格アクションへの標準、高速、または低速の近接に使用できる3つの計算モードがあり、リアルタイムの動きにシャープまたはスムーズに適応するために調整可能な数の価格アクションキャンドルも提供します。 価格アクショントレードパネルMT4は、MT4で見つけることができる最も簡単で使いやすいトレードパネルでもあります。追加のウィンドウやパネルを開く必要なしに、すべてのオプションと機能が1つのサーフェスにあります。これは、注文管理、リスク計算、部分閉鎖、アカウント保護ユーティリティのすべてを1つにまとめたもので、
Description: Please tick "Show object descriptions" in chart properties to enable hrays views That utility converts a trendline into a horizontal ray known as tool for drawing supply and demand zones. Simply create a trendline on a chart and once selected, it will get converted. Ray remains horizontal while dragging.  Quick ray plot: press "R" key to create horizontal ray. It will be snapped to the nearest OHLC value Further versions will be improved. For feature request please post new c
Easy Backtest 2 Pro try the demo version now! Easy Backtest 2 Pro   is a great alternative for all those expensive testing software that exist on the market!. You can    test your new strategy in   Strategy Tester   in your   MT4 , using all available historical data. Beyond the basic functions such as: BUY, SELL PENDING ORDERS STOP LOSE, TAKE PROFIT AUTO RISK MANAGMANT AUTO LOT SIZE  You can modify  each of them at any time, exactly like in live trading. Advanced features PRO such as: P
FREE
The indicator detects and displays 3 Drives harmonic pattern (see the screenshot). The pattern is plotted by the extreme values of the ZigZag indicator (included in the resources, no need to install). After detecting the pattern, the indicator notifies of that by a pop-up window, a mobile notification and an email. The indicator highlights the process of the pattern formation and not just the complete pattern. In the former case, it is displayed in the contour triangles. After the pattern is com
Safety
Sergey Ermolov
5 (2)
私は誰もが"安全"のようなお金の管理のルールを知っていると思います。 気づいていない人のために、金庫は取引の利益がストップの大きさに等しい後にポジションの半分を閉じることを前提としています。 したがって、価格が逆転してストップをキャッチしたとしても、ポジションの一部を以前に閉じたときにまったく同じ量の利益が得られたため、お金を失うことはありません。 Safety Expert Advisorには、決算ロットという設定が1つしかありません。 ポジション0のままにすると、アドバイザーはトランザクションのちょうど半分を閉じます。 Expert Advisorをインストールすると、expert Advisorによって利益の一部が固定される場所のグラフに赤い破線が表示されます。 アドバイザーがトランザクションの一部を別のレベルで閉じるようにする場合は、この行を別の場所に安全に移動できます。 同じ通貨ペアで複数の取引を開いている場合は、マウスカーソルでEAをチャートにドラッグし、安全に閉じたい注文開始レベルの近くにeaをドロップする必要があります。 Expert Advisorは注文
FREE
The Candle Countdown Timer for MetaTrader 4 (also available for MT5) is a vital indicator designed to help you manage your trading time effectively. It keeps you updated about market open and close times by displaying the remaining time before the current candle closes and a new one forms. This powerful tool enables you to make well-informed trading decisions. Key Features: Asia Range: Comes with an option to extend the range. Broker Time, New York, London Time: Displays the current broker time
FREE
FFx Watcher PRO
Eric Venturi-Bloxs
5 (2)
The FFx Watcher PRO is a dashboard displaying on a single chart the current direction of up to 15 standard indicators and up to 9 timeframes. It has 2 different modes: 1. Watcher mode: Multi Indicators User is able to select up to 15 indicators to be displayed User is able to select up to 9 timeframes to be displayed 2. Watcher mode: Multi Pairs User is able to select any number of pairs/symbols User is able to select up to 9 timeframes to be displayed This mode uses one of the standard indica
The Pipsurfer Trade Manager Is A high level software that will automatically analysis each trading asset and calculate its optimal take profit and stop loss levels for Each trade it is managing. Complete with an easy to use management panel that allows you to manage your risk parameters for each individual trade that you place on each pair. You will have access to trailing stops, break even, partial take profits and account risk percentage features as well
MT4用NAS100 Auto SL and TP Makerをご紹介します: MetaTrader4でナスダック100市場をナビゲートするトレーダーにとって不可欠なアシスタントであるNAS100オートSLおよびTPメーカーで、ストップロスおよびテイクプロフィットの設定をもう見逃すことはありません。このツールは、ストップロスとテイクプロフィットのレベル管理を自動化するシームレスなソリューションを求める方々のために設計されています。 主な特徴 簡単な自動化: ストップロスやテイクプロフィットのないナスダック100取引を自動的に監視します。 ユーザーが構成した設定に基づいてレベルを動的に調整します。 注文タイプの多様性: Nasdaq100の成行注文と未決済注文の両方に対応。 MetaTrader 4で利用可能な様々な注文タイプをサポートします。 カスタマイズされた設定: ユーザーフレンドリーなパラメータ設定により、トラッキング設定とストップロス/テイクプロフィットレベルのカスタマイズが可能です。 柔軟な範囲: 特定のNAS100商品、または取引されているすべての商品に対してストップ
FREE
"The trend is your friend" is one of the best known sayings in investing, because capturing large trendy price movements can be extremely profitable. However, trading with the trend is often easier said than done, because many indicators are based on price reversals not trends. These aren't very effective at identifying trendy periods, or predicting whether trends will continue. We developed the Trendiness Index to help address this problem by indicating the strength and direction of price trend
The indicator detects and displays Shark harmonic pattern (see the screenshot). The pattern is plotted by the extreme values of the ZigZag indicator (included in the resources, no need to install). After detecting the pattern, the indicator notifies of that by a pop-up window, a mobile notification and an email. The indicator highlights the process of the pattern formation and not just the complete pattern. In the former case, it is displayed in the contour triangles. After the pattern is comple
HMA Trend
Pavel Zamoshnikov
4.6 (67)
A trend indicator based on the Hull Moving Average (HMA) with two periods. The Hull Moving Average is an improved variant of the moving average, which shows the moment of trend reversal quite accurately. It is often used as a signal filter. Combination of two types of Hull Moving Averages makes a better use of these advantages: HMA with a slow period identifies the trend, while HMA with a fast period determines the short-term movements and signals in the trend direction. Features The movement
FREE
Trend Scanner
Vladimir Kalendzhyan
4.33 (6)
By purchasing this indicator, you have the right to receive a free copy of one of   my other indicator's or advisor’s!  (All future updates are included. No limits) . To get it , please contact me by  mql5 message ! The Trend Scanner trend line indicator displays the trend direction and its changes. The indicator works on all currency pairs and  timeframes. The indicator simultaneously displays multiple readings on the price chart: the support and resistance lines of the currency pair, the exist
Constructor is a convenient tool for creating, (building strategies) testing and applying trading strategies and ideas, as well as testing and using separate indicators and their groups. Constructor includes opening, closing, deal tracking, averaging and recovery modules, as well as various trading options with and without averaging and martingale. You are able to connect up to 10 different external indicators. Find the detailed instructions in the attached pdf file. Trading settings averag
FREE
VN Trade Panel II
Vyacheslav Nekipelov
4 (1)
The new version of the trading panel, which now has the ability to separately close Buy and Sell orders, display targets for all orders on the chart, as well as the ability to use the panel to trade with brokers working on the FIFO rule. Also, the new version adds option buttons for separate management of open orders. It has a convenient visualized interface and intuitive control without a lot of additional tabs to which traders have to be distracted and switch their attention. Thanks to this
VolumeDeltaM1
Stanislav Korotky
3.25 (4)
This indicator provides tick volume delta analysis on M1 timeframe. It monitors up and down ticks and sums them up as separate volumes for buys and sells, as well as their delta volumes, and volume clusters on price scale within a specified number of bars. This indicator complements VolumeDelta , which uses similar algorithms but does not process ticks and therefore cannot work on M1. VolumeDelta can show its signals on entire history because it reads M1 volumes for calculations on higher timefr
TrendPlus
Sivakumar Subbaiya
4.08 (12)
Trend Plus   Trendplus  Indicator   Time Frame: Suitable for any time frame.  Purpose: Trend Prediction. Blue and red candle indicate the buy and sell call respectively. Buy: When the blue candle is formed buy call is initiated. close the buy trades when the next red candle will formed.   Sell: When the Red candle is formed Sell call is initiated. close the Sell trades when the next blue candle will formed.   Happy trade!!
FREE
Wave WOLD MT4外国為替インジケータは、Wolf waveを検索し、取引端末の現在のウィンドウに表示するように設計されています。 取引でオオカミの波を使用するトレーダーのための優れた指標。 取引戦略への適用は、効率と収益性を大幅に向上させます。 指標に関する情報 他のWolf wave指標とは異なり、Wave WOLD MT4外国為替指標は、その有効性を大幅に高める多くの機能を備えています: 最初のものは開いているWindows5Pointパラメータ(真の値)情報サポートを提供します。つまり、Wolf waveが登場したチャートのウィンドウを展開します。 たとえば、EURUSD、AUDUSD、GBPUSDチャートが開いていて、それぞれにWave WOLD MT4インジケーターがインストールされている場合、ユーロモデルが検出されると、対応するチャートが自動的に他のチャートの上に前景に表示され、多数の商品を取引するときに非常に便利になります。  2番目の機能は、ユーザーが自分で選択できるパラメータ(デフォルト設定(12,26,9))であるmacd上の組み込みの発散分析で
このプロダクトを購入した人は以下も購入しています
Trade Assistant MT4
Evgeniy Kravchenko
4.43 (180)
取引 ごとのリスクの 計算、新規注文 の 簡単 な 設置、部分的 な 決済機能 を 持 つ 注文管理、 7 種類 のトレーリングストップなど 、便利 な 機能 を 備 えています 。 注意、アプリケーションはストラテジーテスターでは機能しません。 Manual, Description, Download demo ライン機能 チャート上にオープニングライン、ストップロス、テイクプロフィットを表示します。この機能により、新規注文を簡単に設定することができ、注文を出す前にその特徴を確認することができます。   リスク計算 リスク計算機能は、設定されたリスクとストップロス注文のサイズを考慮して、新規注文のボリュームを計算します。ストップロスの大きさを自由に設定できると同時に、設定したリスクを守ることができます。 Lot calc ボタン - リスク 計算 を 有効 / 無効 にします 。 Risk フィールドでは 、必要 なリスクの 値 を 0 から 100 までのパーセンテージまたは 預金通貨 で 設定 します 。 設定」 タブで 、 リスク 計算 の 種類 を 選択 します :
Local Trade Copier EA MT4
Juvenille Emperor Limited
5 (79)
Local Trade Copier EA MT4 による、驚くほど高速な取引コピーを体験してください。1分で簡単にセットアップできるこの取引コピー機は、同じWindowsコンピュータまたはWindows VPS上の複数のMetaTrader端末間で取引をコピーすることができ、0.5秒未満の高速コピースピードを実現します。 初心者であろうとプロのトレーダーであろうと、 Local Trade Copier EA MT4 には、あなたの特定のニーズに合わせてカスタマイズするための幅広いオプションが用意されています。これは、利益の可能性を高めたい人にとって究極のソリューションです。 今すぐ試してみて、これが市場で最も速くて簡単なトレードコピー機である理由を理解してください。 ヒント: デモアカウントで Local Trade Copier EA MT4 デモバージョンをダウンロードして試すことができます: ここ ダウンロードした無料のデモ ファイルを MT4 >> ファイル >> データ フォルダを開く >> MQL4 >> Experts フォルダに貼り付けて、ターミナルを再起動し
価格が一瞬で変わる可能性のある市場では、注文はできるだけ簡単にすべきだと思いますか? Metatraderでは、注文を開くたびに、開始価格を入力し、損失を止めて利益を得るウィンドウと、取引サイズを開く必要があります。金融市場の取引では、初期預金を維持し、それを増やすために資本管理が不可欠です。それで、あなたが注文をしたいとき、あなたはおそらくあなたがどれくらいの大きさの取引を開くべきか疑問に思いますか?この単一の取引であなたの預金の何パーセントを危険にさらすべきですか?この取引からどれだけの利益を得ることができますか?また、リスクに対する利益の比率はどのくらいですか?トレードサイズを設定する前に、トレードサイズがどうあるべきかという質問に対する答えを得るために必要な計算を行います。 これらすべてを自動的に行うツールがあると想像してみてください。チャートを開き、市場分析を行い、エントリーポイント、ディフェンスポイント(ストップロス)、ターゲット(テイクプロフィット)を水平線でマークし、最後にリスクのレベルを定義します。利用可能な資本の%として、このトランザクションで負担することができ、こ
The product will copy all telegram signal to MT4   ( which you are member  ) , also it can work as remote copier.  Easy to set up, copy order instant, can work with almost signal formats, image signal, s upport to translate other language to English Work with all type of channel or group, even channel have "Restrict Saving Content", work with  multi channel, multi MT5 Work as remote copier: with signal have ticket number, it will copy exactly via ticket number. Support to backtest signal. How to
Tired of complex order placement and manual calculations? Trade Dashboard is your solution. With its user-friendly interface, placing orders becomes effortless, by a single click, you can open trades, set stop loss and take profit levels, manage trade lot size, and calculate risk to reward ratios, allowing you to only focus on your strategy. Say goodbye to manual calculations and streamline your trading experience with Trade Dashboard. Download  Demo Version  right now. You can find  Details
MT4 to Telegram Signal Provider は使いやすく、完全にカスタマイズ可能なツールで、Telegramに信号を送信し、あなたのアカウントを信号提供者に変えることができます。 メッセージのフォーマットは 完全にカスタマイズ可能です! しかし、簡単な使用のために、あらかじめ定義されたテンプレートを選択し、メッセージの特定の部分を有効または無効にすることもできます。 [ デモ ]   [ マニュアル ] [ MT5バージョン ] [ Discordバージョン ] [ Telegramチャンネル ] セットアップ ステップバイステップの ユーザーガイド が利用可能です。 Telegram APIの知識は必要ありません。開発者が必要なものをすべて提供します。 主要機能 購読者に送信される注文の詳細をカスタマイズする機能 例えばブロンズ、シルバー、ゴールドなど、階層型のサブスクリプションモデルを作成できます。ゴールドサブスクリプションでは、すべての信号が得られますなど。 ID、シンボル、またはコメントによる注文のフィルタリング 注文が実行されたチャート
Grid Manual MT4
Alfiya Fazylova
4.72 (18)
「Grid Manual」は、注文のグリッドを操作するための取引パネルです。 ユーティリティはユニバーサルで、柔軟な設定と直感的なインターフェイスを備えています。 それは、損失を平均化する方向だけでなく、利益を増やす方向でも注文のグリッドで機能します。 トレーダーは注文のグリッドを作成して維持する必要はありません。 すべてが「Grid Manual」によって行われます。 注文を開くだけで十分であり、「Grid Manual」は注文のグリッドを自動的に作成し、非常に閉じるまでそれに付随します。 完全な説明とデモバージョン ここ。 ユーティリティの主な機能と機能 ユーティリティは、モバイル端末から開かれた注文を含め、あらゆる方法で開かれた注文を処理します。 「制限」と「停止」の2種類のグリッドで機能します。 グリッド間隔の計算には、固定と動的(ATRインジケーターに基づく)の2つの方法で機能します。 オープンオーダーグリッドの設定を変更できます。 チャート上の各注文グリッドの損益分岐点を表示します。 各注文グリッドの利益率を表示します。 ワンクリックでグリッドから収益性の高い注文を閉じるこ
Exp COPYLOT CLIENT for MT4
Vladislav Andruschenko
4.7 (61)
MetaTrader4のコピー機を取引します。     それは任意の口座からの外国為替取引、ポジション、注文をコピーします。 それは最高の貿易コピー機の1つです     MT4 - MT4、MT5 - MT4     のために     COPYLOT MT4     バージョン(または     MT4 - MT5  MT5 - MT5     のために     COPYLOT MT5     バージョン)。 MT5のバージョン 完全な説明   +DEMO +PDF 購入する方法 インストールする方法     ログファイルの取得方法     テストと最適化の方法     Expforex のすべての製品 のコピー機 バージョン       MetaTrader 5 ターミナル(   МТ5 - МТ5、МТ4 - МТ5   )-   コピーロットクライアントMT5 独自のコピーアルゴリズムにより、すべての取引がマスターアカウントからクライアントアカウントに正確にコピーされます。 また、動作速度が速いことでも知られています。タフなエラー処理。 強力な機能セット。 プログ
あなたの外国為替ポートフォリオを管理してください。あなたが立っている場所、何が働いているのか、そして何があなたに痛みを引き起こしているのかを即座に見てください! ここで利用可能なMT5バージョン:https:// www.mql5.com/en/market/product/58658 Trade Managerダッシュボードは、外国為替市場での現在の各ポジションが一目でわかるように設計されており、リスク管理と通貨へのエクスポージャーを理解しやすくします。 複数のポジションで徐々に市場に参入するトレーダー、またはそれらのトレーディンググリッドとバスケット戦略にとって、これは重要な情報です。ターミナル内の複数の位置を監視することは、管理が難しいことがよくあります。 不十分なリスクの活用と使用:報酬は、新しいトレーダーや一部の経験豊富なトレーダーが直面する主要な問題です。トレードマネージャーは、各通貨へのエクスポージャーを個別に示し、一度に両方向に取引しないようにします。 特徴: オープントレード-通貨ペアでソートされた現在のオープントレードをすべて表示します。ペアだけでなく
Trade copier MT4
Alfiya Fazylova
4.52 (29)
Trade Copierは、取引口座間の取引をコピーして同期するように設計された専門的なユーティリティです。 コピーは、同じコンピューターまたはvps にインストールされている、サプライヤーのアカウント/端末から受信者のアカウント/端末に行われます。 購入する前に、デモ アカウントでデモ バージョンをテストできます。 デモ版 こちら 。 詳細な説明は こちら 。 主な機能と利点: MT5ネッティングアカウントを含む、MT4> MT4、MT4> MT5、MT5> MT4のコピーをサポートします。 高いコピー速度(0.5秒未満)。 ベンダーモードと受信者モードは同じ製品内に実装されています。 チャートから直接リアルタイムでコピーを制御できる、簡単で直感的なインターフェイス。 接続が切断されたり、端末が再起動されたりしても、設定と位置が失われることはありません。 コピーするシンボルを選択できます。また、受信者のシンボルを置き換えることもできます(例:EURUSD> USDJPY)。 バックコピーをサポートします。 特定の注文のみのコピーを有効にする機能。 取引開始価格の最大差と最大遅延時間を
Summer 50% discount ($199 -> $99) Advanced trading tool: One click smart orders that execute under your conditions Developed by trader for trading community:  position size calculator (lot size), open position after price action, strategy builder, set and forget trading, mobile notifications... Risk Management -  Risk percentage position size calculator, gain percentage, target risk reward ratio, spread and commissions are included in calculations 7 Advanced order types   - Set and forget tra
あなたがメンバーである任意のチャンネル(プライベートおよび制限されたチャンネルを含む)からのシグナルを、直接あなたのMT4にコピーします。 このツールは、ユーザーを念頭に置いて設計されており、取引を管理および監視するために必要な多くの機能を提供しています。 この製品は、使いやすく視覚的に魅力的なグラフィカルインターフェースで提供されています。設定をカスタマイズして、数分で製品を使用開始できます! ユーザーガイド + デモ  | MT5版 | Discord版 デモを試したい場合は、ユーザーガイドを参照してください。 Telegram To MT5レシーバーは、ストラテジーテスターでは機能しません! Telegram To MT4の特長 一度に複数のチャンネルからシグナルをコピー プライベートおよび制限されたチャンネルからシグナルをコピー BotトークンやチャットIDは不要です(必要な場合は引き続き使用できます) リスク%または固定ロットを使用して取引 特定のシンボルを除外 すべてのシグナルをコピーするか、コピーするシグナルをカスタマイズするかを選択 すべてのシグナルを認識する
MT4のエキスパートアドバイザーリスクマネージャーは非常に重要であり、私の意見ではすべてのトレーダーにとって必要なプログラムです。 このエキスパートアドバイザーを使用すると、取引口座のリスクを管理することができます。リスクと利益の管理は、金銭的およびパーセンテージの両方で実行できます。 エキスパートアドバイザーが機能するには、それを通貨ペアチャートに添付し、許容可能なリスク値を預金通貨または現在の残高の%で設定するだけです。 PROMO BUY 1 GET 2 FREE -   https://www.mql5.com/en/blogs/post/754725 アドバイザ機能 このリスクマネージャーは、リスクの管理を支援します。 -取引のために -1日あたり - 1週間 - ひと月ほど 制御することもできます 1)取引時の最大許容ロット 2)1日あたりの最大注文数 3)1日あたりの最大利益 4)エクイティを引き受ける利益を設定する それだけではありません。設定で自動設定を指定した場合、アドバイザーはデフォルトのSLとTPを設定することもできます。
50% off. Original price: $375 Reward Multiplier is a semi-automatic trade manager based on pyramid trading that opens additional orders with the running profit of your trades to maximize return exponentially without increasing the risk. Unlike other similar EAs, this tool shows potential profit/loss and reward to risk ratio before even entering the first trade! Download Demo here  (starting lot is fixed at 0.01) Guide + tips here MT5 version   here You only open the first order. When your
TradePanel MT4
Alfiya Fazylova
4.91 (85)
Trade Panel は、多機能の取引アシスタントです。 このアプリケーションには手動取引用の 50 以上の機能が含まれており、ほとんどの取引アクションを自動化できます。 購入する前に、デモ アカウントでデモ バージョンをテストできます。 デモは こちら から。 詳しい手順は こちら をご覧ください。 取引。 ワンクリックで基本的な取引操作を実行できます。 未決の注文とポジションをオープンする 注文のグリッドを開く 未決の注文とポジションを決済する ポジションの反転(買いを閉じて売りをオープンする、または売りを閉じて買いをオープンする) ポジションをロックする(反対のポジションをオープンすることで、売りポジションと買いポジションの量を等しくします) すべてのポジションを部分的に決済します。 すべてのポジションのテイクプロフィットやストップロスを共通のレベルに設定します。 すべてのポジションのストップロスを損益分岐点レベルに設定します。 注文とポジションをオープンする際に、次のことが可能になります。 確立されたリスクに応じて取引量の自動計算を使用します。 ワンクリックで複数の注文を開き
DrawDown Limiter MT4
Haidar, Lionel Haj Ali
5 (8)
Drawdown Limiter EA You are in the right place if you were searching for Drawdown control, Drawdown limiter, Balance protection, Equity Protection or Daily Drawdown Limit related to Prop Firm, FTMO, or Funded account trading, or if you want to protect your trading account. Have you suffered from controlling your drawdown when trading funded accounts? This EA is meant for you. Prop firms usually set a rule called “Trader Daily Drawdown”, and if it is not respected, you are disqualified.  I am an
Manual Trade Panel EA MT4
Juvenille Emperor Limited
5 (4)
手動トレードパネルEAMT4 は、MT4で見つけることができる最も簡単で使いやすいトレードパネルです。追加のウィンドウやパネルを開く必要なしに、すべてのオプションと機能が1つのサーフェスにあります。これは、注文管理、リスク計算、部分閉鎖、アカウント保護ユーティリティのすべてを1つにまとめた、非常に便利なインターフェースです。 Manual Trade Panel EA MT4 を使用することで、従来の手動取引方法よりも何倍も速く正確に取引することができ、取引の決定に集中するためのより多くの時間と明確な心を得ることができます。 アカウントの保存は私たちの最優先事項であるため、 手動取引パネルEA MT4 は、アカウントが利益を得るか停止した後、すべての未決済の取引を閉じ、すべての保留中の注文を削除し、EAが添付されているすべてのターミナルチャートを閉じることができる優れたアカウント保護ユーティリティでもあります損失の公平性に達しました。これは、利益条件で非常に便利であり、エクイティが希望のストップロスレベルを下回ったときに、取引口座をさらなる損失から救うことができます。 ヒント
テストモード (テスター内) では、パネル機能はアクティブではありません。パネル自体の視覚的表現のみを提供しました。 指定されたストップロスレベルに基づいてポジションサイズやリスクを即座に計算できるツールは、プロのトレーダーと初心者の両方にとって重要です。 TRADE PRO 取引ユーティリティは、高速かつ正確な計算を提供し、限られた時間と増大する市場のボラティリティの状況での意思決定を支援します。 手順 -   https://www.mql5.com/ru/blogs/post/758419 主な機能: オリジナル。ただ。効果的。 メイン取引パネルのオリジナルで便利な開口部: チャートの右側にマウスを置き、適切な方向にクリックして今後の注文を出します。 成行注文の迅速な設定 TRADE PROを使用して残高または資本のリスクの割合レベルを設定するか、特定のリスク量を指定します。チャート上のストップロスレベルを視覚的に決定し、ツールが各通貨ペアの最適なポジションサイズを自動的に計算できるようにします。このツールは、指定されたリスクリワード比率に基づいて利益目標 (利食い) を自動
Trade Manager は、リスクを自動的に計算しながら、取引を迅速に開始および終了するのに役立ちます。 過剰取引、復讐取引、感情的な取引を防止する機能が含まれています。 取引は自動的に管理され、アカウントのパフォーマンス指標はグラフで視覚化できます。 これらの機能により、このパネルはすべてのマニュアル トレーダーにとって理想的なものとなり、MetaTrader 4 プラットフォームの強化に役立ちます。多言語サポート。 MT5バージョン  |  ユーザーガイド + デモ Trade Manager はストラテジー テスターでは機能しません。 デモについてはユーザーガイドをご覧ください。 危機管理 % または $ に基づくリスクの自動調整 固定ロットサイズを使用するか、ボリュームとピップに基づいた自動ロットサイズ計算を使用するオプション RR、Pips、または価格を使用した損益分岐点ストップロス設定 トレーリングストップロス設定 目標に達したときにすべての取引を自動的に終了するための 1 日あたりの最大損失 (%)。 過度のドローダウンからアカウントを保護し、オーバートレードを防ぎま
BBMA Oma Ally Signals Scanner (BBMA Oma Ally Analyzer Dashboard EA) This is a multi-pair and multi scanner dashboard to find the key signal of BBMA Oma Ally Strategy BBMA consists of the use of 2 indicators: Moving Averages Bollinger Bands BBMA consists of many types of entries: Reentry Extreme Rejection EMA50 GAP (EMA50 to Upper/Lower BB) MHV Full Setup (CSE>TPW>MHV>Direction>Reentry) There are many multi timeframe signals based on this strategy. RRE (Reentry - Reentry - Extreme) REE (Reentry
多機能ツール 搭載機能: ロット計算機、プライスアクション、リスク/リワードレシオ、トレードマネージャー、需要供給ゾーンなどをはじめ65以上の機能。 バージョ:デモ版   |   ユーザーマニュアル   |    MT5版 このユーティリティはストラテジー テスターでは機能しません。 ここからデモ バージョンをダウンロードして製品をテストできます。 ご不明な点や改善提案、バグの発見などございましたら、 連絡してください 。 取引プロセスを簡素化、高速化、自動化します。このダッシュボードで標準端末機能を拡張します 1. 新しい取引を開始します : ロット / リスク / RR の計算 1. Lot計算機(リスクサイズに基づく取引量計算 2. リスク計算機(ロットサイズに基づくリスク量) 3. リスク/リワードレシオ (R/R) 4. 注文のアクティベーション トリガー + Buy StopLimit / Sell StopLimit: MT4でも可  5. 仮想 SL / TP レベル (隠しSL、TP: ブローカーには見えない) 6.  Smart SL / エントリー レ
The product will copy all  Discord  signal   to MT4   ( which you are member  ) , also it can work as remote copier.  Easy to set up. Work with almost signal formats, support to translate other language to English Work with multi channel, multi MT4. Work with Image signal. Copy order instant, auto detect symbol. Work as remote copier: with signal have ticket number, it will copy exactly via ticket number. How to setup and guide: Let read all details about setup and download Discord To MetaTrade
News Trapper EA
Noha Mohamed Fathy Younes Badr
4.85 (13)
Hi, all.  News trapper EA It is an expert for trading news very safe expert  Automated Trading on the news of the economic calendar. It shows stable trading during last 10  years. EA doesn't use dangerous technologies like martingale, grid. The Expert is very simple to use. how to install it     and set files     read the blog         after purchase contact me to add you to   VIP   channel  The program contains flexible settings for trading on the news of the economic calendar. It cannot be ch
この製品は、ニュースタイム中にすべてのエキスパートアドバイザーと手動チャートをフィルタリングするため、急激な価格変動によるマニュアルトレードのセットアップの破壊や他のエキスパートアドバイザーによって入力された取引について心配する必要はありません。この製品には、ニュースのリリース前にオープンポジションとペンディングオーダーを処理できる完全な注文管理システムも付属しています。 The News Filter  を購入すると、将来のエキスパートアドバイザーのためにビルトインのニュースフィルターに頼る必要はなく、今後はすべてのエキスパートアドバイザーをここからフィルタリングできます。 ニュース選択 ニュースソースは、Forex Factoryの経済カレンダーから取得されます。 USD、EUR、GBP、JPY、AUD、CAD、CHF、NZD、CNYなど、任意の通貨数に基づいて選択できます。 Non-Farm(NFP)、FOMC、CPIなどのキーワード識別に基づいて選択することもできます。 影響レベルによってフィルタリングするニュースを選択することができ、低、中、高の影響範囲から選択できます
このエキスパートアドバイザーは、コストのかかるドローダウンを防止したり、取引ルールを遵守したりするために、取引口座のエクイティを常に監視しています。特定のルールセットに違反すると、EAは警告を発し、すべての取引を終了し、場合によっては、保留中のすべての注文を削除します。オプションで、すべてのチャートを閉じて、アカウントで動作しているすべてのEAを削除することもできます。このEAは、FTMOチャレンジやPZチャレンジなどの自己勘定取引チャレンジに特に役立ちます。 [ インストールガイド | アップデートガイド | トラブルシューティング | FAQ | すべての製品 ] 次の機能が実装されており、自由に有効または無効にできます。 エクイティ最大損失、別名トレーリングエクイティドローダウン 毎日のエクイティ最大損失 エクイティ利益目標 エクイティトレーリングストップ その他の利点は次のとおりです。 使いやすいデッド 自己勘定取引会社やトレーダーに便利 あらゆる種類のアラートを実装します ターミナルに報告する 技術的な案内: それはそれ自身で最大エクイティとデイリーエクイ
Summer 40% discount ($149 -> $88) Everything for chart Technical Analysis indicator mt4 in one tool Draw your supply demand zone with rectangle and support resistance with trendline and get alerts to mobile phone or email alert -  Risk reward indicator Video tutorials, manuals, DEMO download   here .  Find contacts on my   profile . 1.   Extended rectangles and trendlines Object will be extended to the right edge of the chart when price will draw new candles on chart. This is rectangle extend
The most advanced news filter and drawdown limiter on MQL market NEW: Take a Break can be backtested against your account history! Check the " What's new " tab for details. Take a Break has evolved from a once simple news filter to a full-fledged account protection tool. It pauses any other EA during potentially unfavorable market conditions and will continue trading when the noise is over. Typical use cases: Stop trading during news/high volatility (+ close my trades before). Stop trading when
利益追跡機能で総利益/損失に達したときにMetaTrader4のポジションをクローズします。 仮想停止(個別注文)を 有効にできます。 買いと売りのポジションを別々に 計算して閉じる(別々の買い売り)、 すべてのシンボルまたは現在のシンボルのみ(すべてのシンボル)を 閉じて計算します。 利益のためにトレーリングを有効にする( トレーリング 利益) 預金通貨、ポイント、残高の%の総損益を閉じます。 このアプリケーションは、他のEAと一緒に、または手動取引と組み合わせて、任意のアカウントで使用するように設計されています。 MT5 のバージョン 完全な説明   +DEMO +PDF 購入する方法 インストールする方法     ログファイルの取得方法     テストと最適化の方法     Expforex のすべての製品 一部またはすべてのペアの貿易収支の合計が設定で指定された値以上になるとすぐに、すべてのポジションがクローズされ、注文が削除されます。 このバージョンは、指定された利益レベルでポジションを閉じることができるだけでなく、より良い結果を得るために利益を追跡することもで
If you need an advisor on any arrow indicator signals - this utility will definitely help you.  You will be able, with the help of this utility to form an unlimited number of EAs on YOUR signals , with your set of settings, with your copyright and complete source code . You will be able to use the resulting EAs unlimitedly , including adding them to the Market and other resources. Generated Martingale EA with the help of this script - here Free simple version of the generation script to help yo
Простая в управлении Торговая панель обеспечит безопасную торговлю. Вычислит объём сделки от заданного уровня Stop Loss и величины убытка. Поможет рассчитать сейф, и в ноль закрыть неверную сделку. Интуитивно понятный интерфейс делает панель удобной в управлении, освобождая внимание трейдера для принятия решения о входе в сделку. Программа сделает все расчёты за вас. Поэтому работа с помощью панели Снайпер - оптимальное решение для торговли с соблюдением Мани-менеджмента. А это главный ключ к по
作者のその他のプロダクト
This indicator has been created for finding the probable reversal points of the symbol price. A small candlestick reversal pattern is used it its operation in conjunction with a filter of extremums. The indicator is not redrawn! If the extremum filter is disabled, the indicator shows all points that have a pattern. If the extremum filter is enabled, the condition works – if the history Previous bars 1 candles back contains higher candles and they are farther than the Previous bars 2 candle, such
FREE
First RSI level indicator analyzes and displays the level, at which the first crossing of the standard RSI maximum or minimum value took place for the subsequent definition of strong trends. The indicator allows you to track the beginning of a trend that does not follow the signals of the standard RSI trading strategy, for example, when the price rushes downwards after reaching an oversold level instead of reversing. In this case, we have to conclude that a strong trend is underway and the next
FREE
The indicator is designed for displaying the following price levels on the chart: Previous day's high and low. Previous week's high and low. Previous month's high and low. Each of the level types is customizable. In the indicator settings, you set line style, line color, enable or disable separate levels. Configurations ----Day------------------------------------------------- DayLevels   - enable/disable previous day's levels. WidthDayLines   - line width of daily levels. ColorDayLines   - lin
FREE
Addition to the standard Relative Strength Index (RSI) indicator, which allows to configure various notifications about the events related with the indicator. For those who don't know what this indicator is useful for, read here . This version is for MetaTrader 5, MetaTrader 4 version - here . Currently implemented events: Crossing from top to bottom - of the upper signal level (default - 70) - sell signal. Crossing from bottom to top - of the upper signal level (default - 70) - sell signal. Cro
If you use the MFI (Money Flow Index) indicator, the waiting time till the next signal can be long enough. Now you can avoid sitting in front of the monitor by using MFI Alerts. This is an addition or a replacement to the standard MFI oscillator . Once there appears an MFI signal on the required level, the indicator will notify you with a sound or push, so you will never miss a signal. This is especially significant if you follow the indicator in different timeframes and currency pairs, which ca
This semaphore indicator is based in the standard RSI, which is applied over the Envelopes indicator that shows an envelope or envelope fluctuation borders. This is a version of RSI vs Envelopes Graph drawn in a separate window . A sell signal emerges when the upper envelope/border is broken by the RSI indicator from top to bottom. A buy signal emerges when the lower envelope/border is broken by the RSI indicator from bottom upwards. The indicator can draw arrows on the indicator, draw vertical
FREE
This semaphore indicator is based in the standard RSI, which is applied over the Envelopes indicator that shows an envelope or envelope fluctuation borders. This is a version of RSI vs Envelopes drawn in the symbol window . A sell signal emerges when the upper envelope/border is broken by the RSI indicator from top to bottom. A buy signal emerges when the lower envelope/border is broken by the RSI indicator from bottom upwards. The indicator can draw arrows on the indicator, draw vertical lines
FREE
Time Levels
Yurij Izyumov
4.38 (8)
The indicator is designed for displaying the following price levels on the chart: Previous day's high and low. Previous week's high and low. Previous month's high and low. Each of the level types is customizable. In the indicator settings, you set line style, line color, enable or disable separate levels. The version of the exact same indicator but only with sound alerts there - Time Levels with Alerts . Configurations ----Day------------------------------------------------- DayLevels - enable
FREE
RSI 7TF
Yurij Izyumov
2.75 (4)
This is a multitimeframe RSI indicator defining trends, oversold/overbought zones, as well as all intersections of signal lines from different timeframes on a single chart using arrows and audio alerts. When working with standard RSI, we often need to examine data from all necessary timeframes simultaneously. RSI 7TF solves this issue. If you are only interested in audio signals when signal lines are crossed, then have a look at RSI Alerts . Attention! The indicator uses seven timeframes - M5, M
FREE
The indicator is based on a single Moving Average of a user-defined period. By analyzing the price movement of the price relative to this MA, and also by tracking all updates of the price Highs and Lows over the same period as the MA period, the indicator draws its own picture of the trend, avoiding the ever-breaking MA lines. Therefore, if the trend goes up, the line will also point upwards and will not change its direction even on small retracements, allowing to capture almost the entire trend
FREE
If you execute or test an Expert Advisor on a laptop, personal computer or a VPS, you may face the situation when Internet connection is lost and the EA stops. Of course, this utility ( Disconnect Alerts ) will not help you restore the Internet connection, but it will gather the information and will send an alert to you about when and how long your terminal was without access to the Internet and did not actually work. After receiving such a notification, you can check your trades or think about
FREE
This indicator MA Alerts with Arrows gives you the opportunity to receive signals about the intersection of two moving averages (Moving Average), as well as signals about the price rollback to MA - to enter the transaction. Alert options: Sound and text alerts (alert). Push notification to the mobile terminal. Email notification (message to your e-mail).  Visual alert (arrows on the chart). The indicator has the following features: To display or hide the moving averages and arrows themselves.  T
As the proper trading using CCI indicators requires the trader to monitor multiple timeframes and CCI indicators with different periods. For example - monitor the trend using CCI with the period of 100 or 200 ( slow CCI period ) on the H4 timeframe, and make entries based on the CCI with the period of 13 ( fast CCI period ) on the H1 timeframe. To facilitate this task, the Delta CCi MTF7 indicator was created, which implements monitoring the changes of the price movement trends as well as marks
Addition to the standard Relative Strength Index (RSI) indicator, which allows to configure various notifications about the events related with the indicator. For those who don't know what this indicator is useful for, read here . This version is for Metatrader 4, version for Metatrader 5 is here . Currently implemented events: Crossing from top to bottom - of the upper signal level (default - 70) - sell signal. Crossing from bottom to top - of the upper signal level (default - 70) - sell signal
The Extremum catcher indicator analyzes the price action after breaking the local Highs and Lows, generates price reversal signals with the ability to plot the Price Channel. If you need the version for MetaTrader 5, see Extremum catcher MT5 . The indicator takes the High and Low of the price over the specified period - 24 bars by default (can be changed). Then, if on the previous candle the price broke the High or Low level and the new candle opened higher than the extremums, then a signal will
You can avoid constant monitoring of computer screen waiting for the DeMarker signal while receiving push notifications to a mobile terminal or a sound alert on the screen about all required events, by using this indicator - DeMarker Alerts. In fact, it is the replacement of the standard indicator with which you will never miss the oscillator signals. If you don't know the benefits of DeMarker or how to use it, please read here . If you need signals of a more popular RSI indicator, use RSI Alert
If you use the MFI (Money Flow Index) indicator, the waiting time till the next signal can be long enough. Now you can avoid sitting in front of the monitor by using MFI Alerts. This is an addition or a replacement to the standard MFI oscillator . Once there appears an MFI signal on the required level, the indicator will notify you with a sound or push, so you will never miss a signal. This is especially significant if you follow the indicator in different timeframes and currency pairs, which ca
When using CCI (Commodity Channel Index) oscillator, the waiting time till the next signal can be long enough depending on a timeframe. CCI Alerts indicator prevents you from missing the indicator signals. It is a good alternative for the standard CCI indicator. Once there appears a CCI signal on the required level, the indicator will notify you with a sound or push, so you will never miss an entry. This is especially significant if you follow the indicator in different timeframes and currency p
The RSI Panel MTF indicator has been created in order to have the ability to monitor the values of the standard RSI indicator from a multitude of timeframes and symbols on a single chart, as well as to receive timely notifications about the trading opportunities using an audio signal or a notification. The indicator can output both the indicator values, and only the indicator signals (confirmed and expected). A user-friendly feature for selecting the required symbol has been implemented - simply
The indicator trades during horizontal channel breakthroughs. It searches for prices exceeding extreme points and defines targets using Fibo levels. The indicator allows you to create a horizontal channel between the necessary extreme points in visual mode quickly and easily. It automatically applies Fibo levels to these extreme points (if the appropriate option is enabled in the settings). Besides, when one of the extreme points and/or Fibo levels (50%) is exceeded, the indicator activates a so
This is an expanded version of the Time Levels indicator provided with sound alerts notifying of level intersection. The indicator is designed for displaying the following price levels on the chart: Previous day's high and low. Previous week's high and low. Previous month's high and low. Each of the level types is customizable. In the indicator settings, you set line style, line color, enable or disable separate levels. This version is provided with an option for alerting using an audio signal a
The indicator trades during horizontal channel breakthroughs. It searches for prices exceeding extreme points or bouncing back, monitors night flat and defines targets using customizable Fibo levels with a sound alert, which can be disabled if necessary. The indicator allows you to create a horizontal channel between the necessary extreme points in visual mode quickly and easily. It automatically applies your selected Fibo levels to these extreme points (if the appropriate option is enabled in t
This is а modified oscillator CCI (Commodity Channel Index) with all sorts of signals, alerts and arrows. The indicator is designed so that any signal of crossing any specified level does not escape you. This is a supplemented version of the CCI Alerts Indicator, which does not draw the CCI indicator window, but only draws the result of its work as arrows on the symbol graph. This version of CCI Alerts with Arrows is for MetaTrader 4. If you need signals from another popular RSI indicator, then
The indicator is a modification of RSI Alerts . However, it does not have a separate RSI indicator window. Instead, it uses signal arrows on the price chart. This saves space on the symbol chart, without affecting the quality of received signals and alerts. Similar to RSI Alerts, the indicator can generate sound alert, send push notifications and email messages, as well as draw signal arrows. The display of arrow can be disabled. If the arrows are enabled, they only display the signals chosen in
The indicator trades during horizontal channel breakthroughs. It searches for prices exceeding extreme points or bouncing back and defines targets using customizable Fibo levels with a sound alert, which can be disabled if necessary. The indicator allows you to create a horizontal channel between the necessary extreme points in visual mode quickly and easily. It automatically applies your selected Fibo levels to these extreme points (if the appropriate option is enabled in the settings). Besides
When using CCI (Commodity Channel Index) oscillator, the waiting time till the next signal can be long enough depending on a timeframe. CCI Alerts indicator prevents you from missing the indicator signals. It is a good alternative for the standard CCI indicator. Once there appears a CCI signal on the required level, the indicator will notify you with a sound or push, so you will never miss an entry. This is especially significant if you follow the indicator in different timeframes and currency p
The Extremum catcher MT5 indicator analyzes the price action after breaking the local Highs and Lows and generates price reversal signals with the ability to plot the Price Channel. If you need the version for MetaTrader 4, see Extremum catcher . The indicator takes the High and Low of the price over the specified period - 24 bars by default (can be changed). Then, if on the previous candle, the price broke the High or Low level and the new candle opened higher than the extremums, then a signal
You can avoid constant monitoring of computer screen waiting for the DeMarker signal while receiving push notifications to a mobile terminal or a sound alert on the screen about all required events, by using this indicator - DeMarker Alerts. In fact, it is the replacement of the standard indicator with which you will never miss the oscillator signals. If you don't know the benefits of DeMarker or how to use it, please read here . If you need signals of a more popular RSI indicator, use RSI Alert
フィルタ:
レビューなし
レビューに返信
バージョン 1.13 2021.11.26
перекомпиляция
バージョン 1.12 2021.05.15
Правка отображения таблиц
バージョン 1.11 2021.05.14
Исправление таблиц
バージョン 1.1 2021.05.13
added settings - Font Size, Box Height, Box Width