Trading Sessions MT5 Indicator by PipTick
- ユーティリティ
-
Michal Jurnik
 "Talent is cheaper than table salt. What separates the talented individual from the successful one is a lot of hard work." - Stephen King. Those few words reflect myself very well. I am probably not the most talented developer in the world but I truly believe in hard work, professional attitude and
 - バージョン: 1.2
- アップデート済み: 11 6月 2023
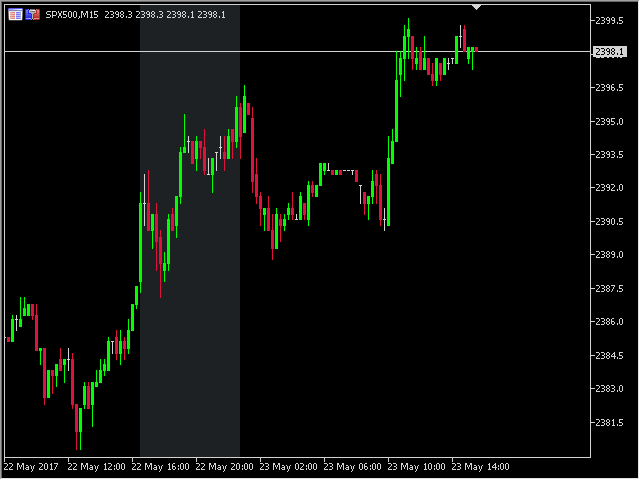
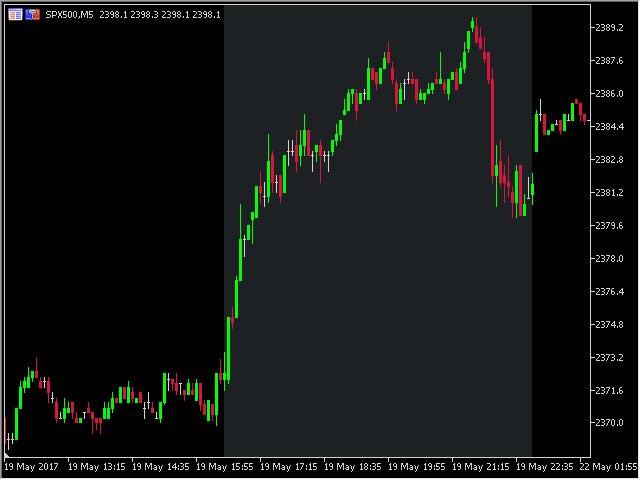
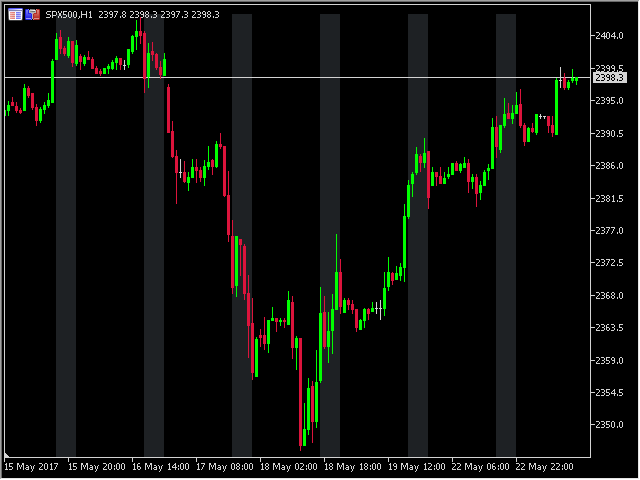
The Trading Sessions indicator is a simple tool that helps to highlight a specific trading session. For example, it can be used to differentiate the European, American or Asian sessions.
Main features
- The indicator shows a user-defined trading session.
- Alert notifications for the start and end of the session.
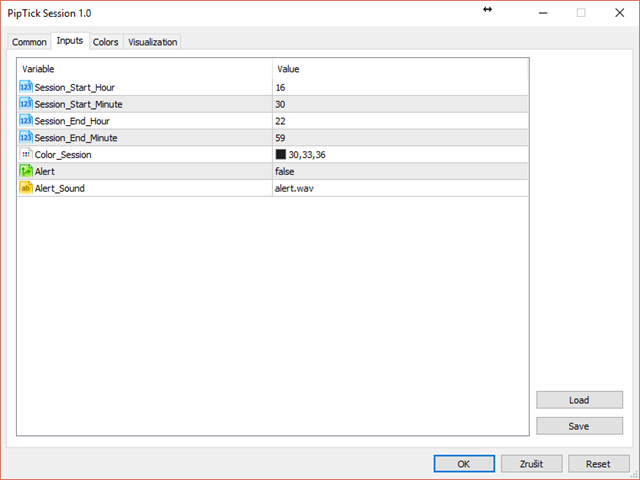
- Custom session time.
- Works on every timeframe (M1, M5, M15, M30, H1, H4, D1, W1, MN).
- Customizable parameters (Colors, alerts...).
- It can be used for creating EA.
- Available for MT4 and MT5.
Please visit the Trading Sessions indicator product page for the input and output parameters settings.

Good indicator. Many thanks for sharing