Currency Barometer MT4 Indicator by PipTick
- インディケータ
-
Michal Jurnik
 "Talent is cheaper than table salt. What separates the talented individual from the successful one is a lot of hard work." - Stephen King. Those few words reflect myself very well. I am probably not the most talented developer in the world but I truly believe in hard work, professional attitude and
 - バージョン: 2.1
- アップデート済み: 3 12月 2021
- アクティベーション: 5
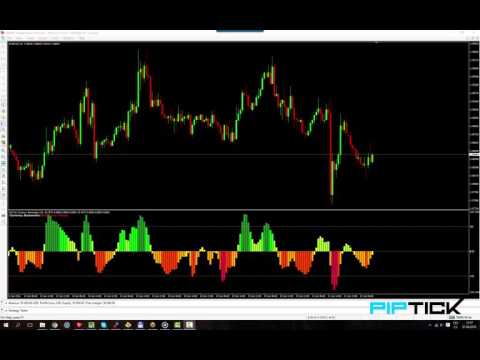
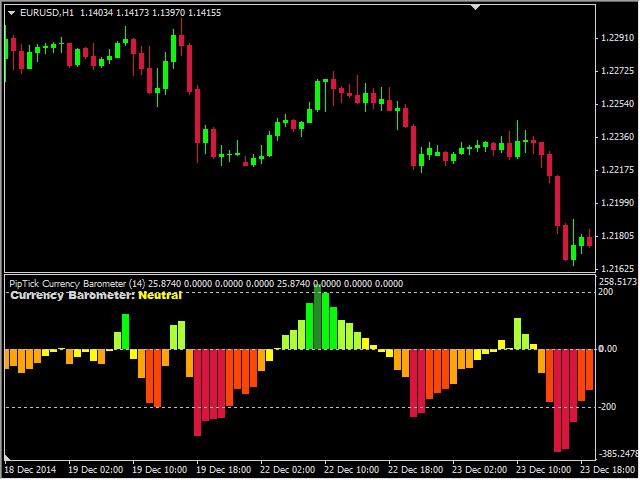
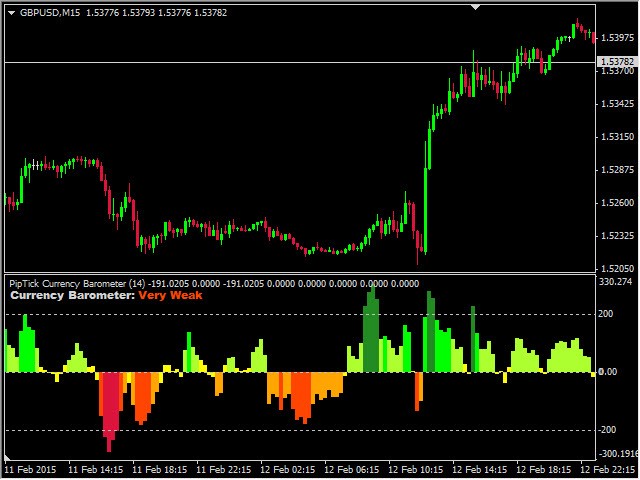
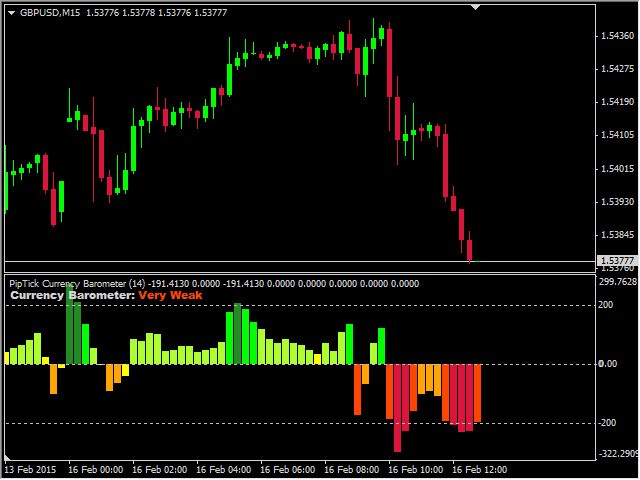
The Currency Barometer indicator is a unique tool that measures the strength of two currencies represented in the pair and compares the difference between them. The result is shown as a histogram where you can simply identify which currency is the strongest. This indicator is designed to measure the strengths and weaknesses of eight major currencies (USD, EUR, GBP, CHF, CAD, JPY, AUD, and NZD) and works on 28 currency pairs. The indicator uses the CI method (Commodity Channel Index) to calculate currencies' strength and weakness.
Interpretation
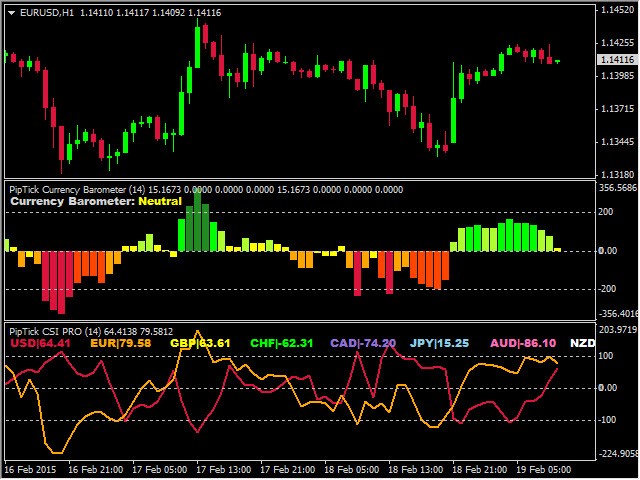
The indicator is divided into three zones.
- Overbought zone - above the line of 200.
- Normal zone - between the lines 200 and -200.
- Oversold zone - under the line of -200.
Because the Currency Barometer compares the first currency in the pair against the second one, it is better to use a sophisticated scale.
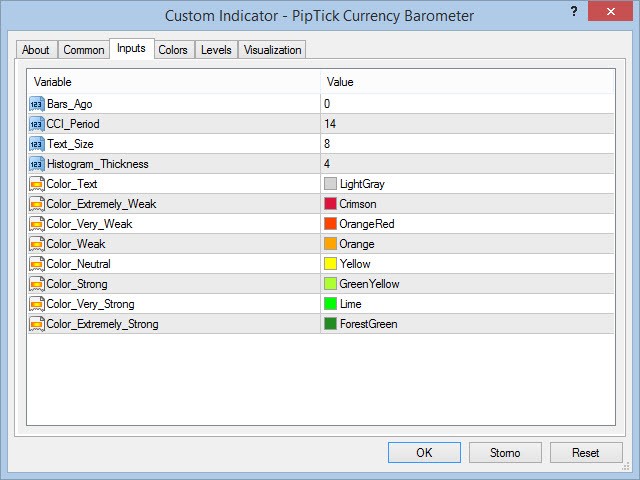
- Extremely Strong - ForestGreen.
- Very Strong - LimeGreen.
- Strong - GreenYelow.
- Neutral - Yellow.
- Weak - Orange.
- Very Weak - OrangeRed.
- Extremely Weak - Crimson.
How to Use the Currency Barometer?
We are sure there are many ways to use our Currency Barometer. For example, you can trade divergences between the price and the indicator. Of course, you can also trade the classical trend strategy - buy a strong currency and sell a weak one. However, never use this strategy if Currency Barometer is in the extreme zone. Conversely, this is often an opportunity to trade in the opposite direction (reverse strategy).
Main Features
- A simple comparison of the strength of two currencies.
- The indicator works with 28 pairs.
- Automatic recognition of the currency pair.
- Overbought and oversold areas for entering or exiting the trades.
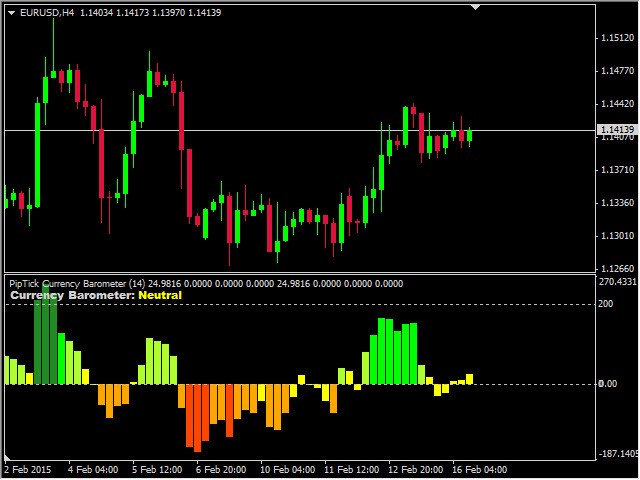
- Works on every timeframe (M1, M5, M15, M30, H1, H4, D1, W1, and MN).
- Non-repainting.
- Ready for backtesting (customizable look-back period).
- Customizable parameters (Colors, Line thickness, Period...).
- High-speed calculation.
- The indicator works with prefixes and suffixes of symbols as well (EURUSD.m, EURUSD-pro...).
- It can be used for creating an EA (Expert Advisor).
- Available for MT4 and MT5.