Close MT5 Script by PipTick

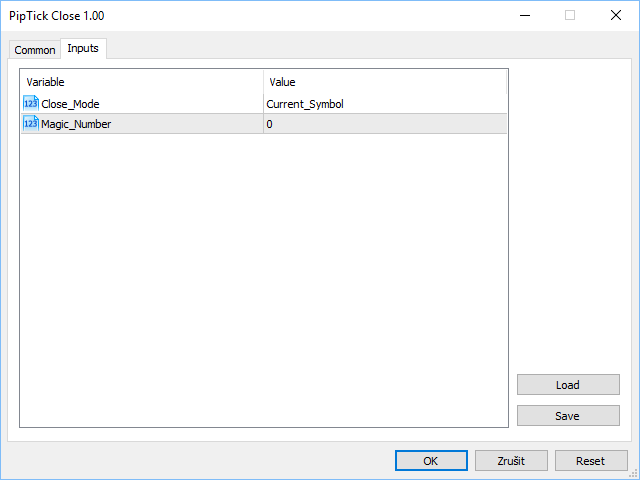
The Close script is a simple tool that allows traders to close their trades by three methods. Just run the script and choose the close method.


Closing methods

  • Symbol - Allows closing all open trades for a specific symbol.
  • All_Trades - Allows closing all open trades.
  • Magic_Number - Allows closing all open trades according to their magic number.

Recommendation

  • AutoTrading functions must be activated. If the AutoTrading function is disabled, the script will not work.
  • EA should be stopped. If you are using an Expert Advisor, you should remove it before running the script.

Main features

  • Three closing methods.
  • Straightforward script.
  • Available for MT4 and MT5.

Please visit the Close script product page for the input parameters settings.

おすすめのプロダクト
DESCRIPTION: Position Size Calculator — On-Chart Risk Management Tool Never risk too much on a single trade again. This calculator displays real-time position sizing for 3 risk levels simultaneously, calculated from your live account balance and current ATR-based stop loss distance. DISPLAYS 3 RISK SCENARIOS AT ONCE: Risk Level 1 (1%): Risk amount in dollars + Lot size Risk Level 2 (2%): Risk amount in dollars + Lot size Risk Level 3 (3%): Risk amount in dollars + Lot size All lot sizes are dyna
FREE
GOM Trade Manager helps you execute trades the way you want it. Works on all instruments Forex, Commodities, & Crypto. It helps you with lot calculations, spread addition and balance calculations so you can just focus on actual trading. For full automatic planned management, stackable triggers and spread widening protection >> check out GOM Trade Manager Pro . ------------------------------------------NOTABLE FEATURES------------------------------------------ You set everything based on bid
FREE
概要 このインジケーターは、クラシックな ドンチャンチャネル を強化したバージョンで、実践的なトレード機能を追加しています。 標準の3本線(上限、下限、中央線)に加え、 ブレイクアウト を検出し、チャート上に矢印で視覚的に表示します。また、チャートを見やすくするために、 現在のトレンド方向と逆側のラインのみを表示 します。 インジケーターの機能: 視覚的シグナル :ブレイクアウト時にカラフルな矢印を表示 自動通知 :ポップアップ、プッシュ通知、Eメール RSIフィルター :市場の相対的な強弱に基づいてシグナルを検証 カスタマイズ可能 :色、ラインの太さ、矢印コード、RSI閾値など 動作原理 ドンチャンチャネルは次のように計算します: 上限線 :直近N本のクローズ済みローソク足の最高値 下限線 :直近N本のクローズ済みローソク足の最安値 中央線 :最高値と最安値の平均値 上方ブレイクアウト は終値が上限線を超えたときに発生し、 下方ブレイクアウト は終値が下限線を下回ったときに発生します。 インジケーターは以下を行います: 3本のドンチャンラインを描画 方向転換後の最初のブレイクアウト
FREE
CosmiCLab SMC FIBO CosmiCLab SMC FIBO is a professional trading indicator designed for traders who use Smart Money Concepts (SMC), market structure analysis and Fibonacci retracement levels. The indicator automatically detects market swings and builds Fibonacci levels based on the latest impulse movement. It also identifies market structure changes such as BOS (Break of Structure) and CHOCH (Change of Character), helping traders understand the current market direction. CosmiCLab SMC FIBO also pr
Spread Candle Clock is a clock that displays the remaining time of the current candle along with the spread in real time directly on the chart. Features: Real-time candle countdown. Live spread (SP) display. Adjustable size. Customizable colors. Configurable position in all four corners. Compatible with all symbols and timeframes. Includes a button to minimize to a small panel.
FREE
"Manage multiple positions as a single unit with hidden targets." The Virtual Basket TP SL Manager is a professional MetaTrader 5 utility designed to automate the closing of positions based on the total profit or loss of a group of orders (a "basket"). By utilizing Virtual Levels , all Take Profit (TP) and Stop Loss (SL) targets are stored locally within the EA's memory and are not sent to the broker's server, keeping your strategy safe from stop-hunting and price manipulation. Key Features Virt
FREE
FibRetrace Zones 直近スイングのフィボナッチ・リトレースメント・ゾーン FibRetrace Zones は FibRetrace EA の無料ビジュアル補助インジケーターです。フィボナッチ・リトレースメント水準を描画し、直近スイングの押し目・戻りゾーンを強調表示するため、取引前にエントリー位置を確認できます。 ゾーンは方向別に色分けされます。強気セットアップは緑、弱気セットアップは赤。あらゆる銘柄・時間足で動作します。 主な機能 ルックバック調整可能な自動スイング検出 古典的フィボナッチ水準(23.6%、38.2%、50%、61.8%、78.6%)、個別に切替可能 色設定可能な押し目ゾーンの強調表示 方向による色分け:緑 = 強気、赤 = 弱気 バー確定で確定表示。形成中バーのリアルタイム更新はオプション 使い方 任意のチャートに適用します。価格が色付きゾーンまで押した位置が、FibRetrace がエントリーを探す場所です。フィボナッチラインを使って手動で指値注文を置くこともできます。 自動化する FibRetrace EA はこの同じゾーンを自動で取引します。1銘
FREE
Important Lines
Terence Gronowski
4.88 (24)
This indicator displays Pivot-Lines, preday high and low, preday close and the minimum and maximum of the previous hour. You just have to put this single indicator to the chart to have all these important lines, no need to setup many single indicators. Why certain lines are important Preday high and low : These are watched by traders who trade in a daily chart. Very often, if price climbs over or falls under a preday low/high there is an acceleration in buying/selling. It is a breakout out of a
FREE
Coming soon: short GIFs showing how to use every part of this manager. I am working on them - please bear with me, they are on the list right after "put the kettle on". Trade manually, manage automatically. Break even, trailing stops, partial closes and an equity guard - all from one clean panel. Free - no DLL, no internet, no subscription. A ton of work has gone into this to make it the best I can make it, and it is free - not a trial, not a lite version - and it always will be. I am still d
FREE
Protect your funded accounts and personal capital with military-grade precision. This utility continuously monitors your floating equity against your daily starting balance. The moment your custom drawdown threshold is breached, it instantly liquidates all open positions, deletes pending orders, and completely unloads from the chart. Stop revenge trading and never fail a prop firm evaluation due to a margin breach again.
FREE
Time Candle with Sound Alert This indicator will be display the time left candle Features : 1. Multi Time Frames, Multi Pairs 2. Time Left 2. Position dynamic with Bid Price or Edge of Chart Screen 3. Font Size and Color 4. Display Current Spread, Maximum Spread and Minimum Spread Note: Maximum and Minimum Spread will be reset when you change TF Tested On MT5 Version 5 Build 5200 If you want the source code, just PM me
FREE
Overview FiT Panel Pro is a professional-grade trade management panel designed for MetaTrader 5 traders who demand speed, precision, and full control over their trades. Built with a modern dark-theme UI, it combines one-click execution with advanced risk management, visual SL/TP drag lines, automatic Fibonacci-based levels, and comprehensive order management — all in a single, compact panel. Whether you are a scalper, day trader, or swing trader, FiT Panel Pro gives you the edge you need to exec
FREE
Donchian Channel is an indicator created by Richard Donchian. It is formed by taking the highest high and the lowest low of the last specified period in candles. The area between high and low is the channel for the chosen period. Its configuration is simple. It is possible to have the average between the upper and lower lines, plus you have alerts when price hits one side. If you have any questions or find any bugs, please contact me. Enjoy!
FREE
DF Fib Trader Pro DF Fib Trader Proは、MetaTrader 5向けに設計された自動取引システムです。 フィボナッチベースの価格水準とトレンドおよびストラクチャー分析を組み合わせ、エントリーポイントとエグジットポイントを決定します。このEAはロングポジションとショートポジションの両方をサポートし、リスク管理パラメータも組み込まれています。 主な機能: • フィボナッチ・リトレースメントとエクステンション・ロジックを用いて、エントリーポイント、SLポイント、TPポイントをプロットします。 • ロットサイズと損切り/利益確定レベルを設定可能 • エントリーポイントは1つまたは2つから選択可能 • 市場状況に応じて、固定または動的な損切り/利益確定をサポート • 複数の時間枠と通貨ペアに対応 • 最大スプレッド、スリッページ、取引頻度の制御オプションを搭載 • 自動取引管理:損益分岐点、トレーリングストップ、部分決済オプション • 希望に応じて成行注文もサポート入力項目の概要: • リスク管理:ロットサイズ、取引ごとのリスク、最大取引回数 • エントリー
FREE
MT5用NAS100 Auto SL and TP Makerをご紹介します: MetaTrader5でナスダック100市場をナビゲートするトレーダーにとって不可欠なアシスタントであるNAS100オートSLおよびTPメーカーで、ストップロスおよびテイクプロフィットの設定をもう見逃すことはありません。このツールは、ストップロスとテイクプロフィットのレベル管理を自動化するシームレスなソリューションを求める方々のために設計されています。 主な特徴 簡単な自動化: ストップロスやテイクプロフィットのないナスダック100取引を自動的に監視します。 ユーザーが構成した設定に基づいてレベルを動的に調整します。 注文タイプの多様性: Nasdaq100の成行注文と未決済注文の両方に対応。 MetaTrader 5で利用可能なさまざまな注文タイプをサポートします。 カスタマイズされた設定: ユーザーフレンドリーなパラメータ設定により、トラッキング設定とストップロス/テイクプロフィットレベルのカスタマイズが可能です。 柔軟な範囲: 実行する特定のNAS100商品または取引されるすべての商品に対してスト
FREE
GDS RiskLab TradeDesk Free Manual Trading Desk and Risk-Control Utility for MetaTrader 5 GDS RiskLab TradeDesk is a free chart-based utility for traders who want a cleaner manual trading workspace in MetaTrader 5. It is designed as a simple execution-support and risk-control panel. The goal is to keep the trading process more organized: review the chart, plan the trade, keep risk visible and execute manually with more structure. This tool does not generate buy or sell signals. It does not predic
FREE
概要 Heiken Ashi Smoothwaveは、メインチャートウィンドウ上でチャートを直接スムージングされた平均足キャンドルに変換し、標準キャンドルを置き換えてよりクリーンなトレンドビューを提供します。別ウィンドウ不要、シンプルな表示。 動作の仕組み 各バーで実際の価格データから平均足のOHLC値を計算します。 カラー表示された平均足キャンドルをメインチャート上に直接描画します。 ネイティブのチャートキャンドルを自動的に非表示にし、平均足キャンドルのみを表示します。 インジケーターを削除すると、標準キャンドルが自動的に復元されます。 入力パラメータ 設定可能なパラメータはありません。アタッチするだけで使用できます。 推奨設定 あらゆる銘柄、あらゆる時間足に対応。Forex、ゴールド、指数、MetaTrader 5で利用可能なすべての銘柄で動作します。 スクリーンショット Heiken Ashi Smoothwave適用後のチャート、ネイティブキャンドルは自動的に非表示。 免責事項 本インジケーターはトレンド分析のための視覚的ツールであり、売買シグナルを生成するものではあ
FREE
ConsistencyGuard
Vanessa Cristina Ribeiro Dos Anjos
バージョン 7.04 デイトレードの規律と口座保護をさらに強化するための大型アップデートです。 • Post-Session Review モードを追加。レビュー時間は 0~60分の範囲で設定できます。 • 許可された取引回数を完了した後も、MetaTrader 5 を開いたままにして、チャートの確認、スクリーンショットの保存、トレード日誌の記録を行うことができます。 • 1日の取引回数上限に達した後に新しい取引を行うと、Emergency Close 保護機能が作動します。 • Emergency Close は未決済ポジションを決済し、保留中の注文をキャンセルした後、取引セッションをロックして MetaTrader 5 を終了します。 • 永続的なデイリーロックにより、重大なルール違反後に MetaTrader 5 を再起動して取引を続けることを防止します。 • 最大許可ロットの保護機能。 • 最大ロットの引き上げは7日間ロックされます。より小さいロットでの取引は引き続き可能です。 • 取引回数のカウントを改善。 • ポジションの部分決済は新しい取引としてカウントされません。 •
FREE
STAMINA HUD – Advanced Market & Trend Dashboard (MT5) STAMINA HUD   is a professional   market information panel   designed for traders who want   clarity, speed, and control   directly on the chart. It provides a   clean heads-up display (HUD)   with essential market data and   multi-timeframe trend direction , without cluttering the chart or generating trading signals. What STAMINA HUD Shows   Current Price   Spread (in real pips)   Today High–Low range (pips)   Average D
FREE
NHK Local Time Scale NHK Local Time Scale displays your PC/local time directly on the MT5 chart , alongside the broker's native chart time. The trader can easily compare both time zones for any candle. Benefits for Traders: Quickly convert Broker Time ↔ Local/PC Time . Helps accurately set News Stop/News Filter times. Makes London, New York, Asian and other trading sessions easier to identify in your local time. Helps verify that EA session and news time settings are correct. Reduces mistakes ca
FREE
Know the Candle Close Time
Benbyaanda Silvere Henri Sedric Kabore
This indicator allows to know the remaining time before the closing of the candle. It works on every timeframe. It is very usefull when your trading strategy depend of the close or the open of a specific candle. So use it like you want. Don't forget to leave a comment or a request for a EA or an indicator. Also spread it to your friends and don't hesitate to visit my profile to see others tools.
FREE
This indicator is especially for the binary trading. Time frame is 1 minutes and exp time 5 or 3 minutes only. You must be use martingale 3 step. So you must put lots size is 10 % at most. You should use Mt2 trading platform to connect with my indicator to get more signal without human working. This indicator wining rate is over 80% but you may get 100% of profit by using martingale 3 step. You should use MT2 Trading Platform to connect meta trader platform and binary platform . You can get mt2
FREE
Daily Entry M1 – MT5インジケーター Daily Entry M1は、M1時間足で短期のデイトレード機会に注目するトレーダー向けに開発されたMetaTrader 5インジケーターです。 このインジケーターは市場状況を分析し、内部のエントリー条件が確認されたときに、チャート上へ明確なBUYおよびSELLの矢印を直接表示します。 このインジケーターは、潜在的な市場の転換エリアを探し、日中の高値または安値に近いエントリーを特定することを目的としており、ランダムな価格位置ではなく、反転の可能性がある機会に集中できるよう支援します。 各トレード矢印には、それぞれ事前定義された独自のターゲットレベルが付属しており、その特定のシグナルに対応するターゲットをすぐに確認できます。 Daily Entry M1の主な目的は、不必要にチャートを複雑化することなく、エントリーシグナルとそれに対応するターゲットを素早く識別できる、シンプルで実用的なトレード環境を提供することです。 free expert Group: https://www.mql5.com/en/messages/01d5
FREE
This indicator consist of Standard BBMA Standard signal Sign on chart added EMA50 Behavior Tracking: The chart background changes color based on the EMA50 (default is black) and shifts to white when a breakout of the Bollinger Bands occurs. Three Engulfing Color Change: Automatically adjusts colors to help you easily determine market zones. default yellow/white High-Low Line Sign: Highlights the potential trading range and key price levels for better visual  MHV
FREE
================================================================ MATRIX CONDITION MONITOR Live Trade Condition Panel for MetaTrader 5 Fully Automatic -- Works with ALL Matrix EAs ================================================================ NEVER MISS A TRADE SETUP AGAIN Matrix Condition Monitor is a free utility that attaches to any chart and automatically checks all 10 trade conditions in real time -- showing you exactly why a trade will or will not open, and alerting you the moment ever
FREE
Overview The Dynamic Candle Timer is a lightweight and efficient utility designed for MetaTrader 5. Unlike traditional candle timers that remain static in the corner of the chart, this indicator dynamically attaches to the current Bid price line. This allows traders to monitor the remaining candle time directly at the point of action, enhancing focus during fast-paced market movements. It is highly suitable for day traders and scalpers operating on XAUUSD, Forex, Crypto, or Indices. Key Feature
FREE
Follow The Line MT5
Oliver Gideon Amofa Appiah
4.6 (35)
This indicator obeys the popular maxim that: "THE TREND IS YOUR FRIEND" It paints a GREEN line for BUY and also paints a RED line for SELL. (you can change the colors). It gives alarms and alerts of all kinds. IT DOES NOT REPAINT and can be used for all currency pairs and timeframes. Yes, as easy and simple as that. Even a newbie can use it to make great and reliable trades. NB: For best results, get my other premium indicators for more powerful and reliable signals. Get them here: https://www.m
FREE
Core function Intelligent transaction management one-click opening and closing operation, which supports user-defined lots to set multiple closing modes: all closing, closing by direction and closing by profit and loss status. Professional risk control, real-time risk monitoring and spread control to avoid high-cost trading environment. Visual control panel has an intuitive graphical interface, and all functions can be operated with one button to display position information, profit and loss sta
FREE
Price Ray
Keni Chetankumar Gajanan -
5 (7)
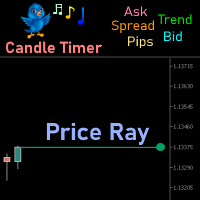
Price Ray indicator is a utility that will improve the way you trade. Primarily, it shows the Bid, Ask or Last price as a line ray which beams till the current candle, last visible chart candle or extended to all candle bars. The enhanced features in this indicator provide information in an area where you focus most, right next to the current candle. You can select text to be shown above or below the Price ray. The indicator is fully customizable, allowing it to fit any strategy requirements. Th
FREE
Pro Spread Monitor Pro Spread Monitor is a specialized, professional-grade utility designed to provide real-time, low-latency monitoring of market spreads directly on your trading chart. In high-volatility environments, sudden spread spikes can significantly impact your execution quality and the integrity of your stop-loss levels. This indicator provides immediate visual feedback, allowing you to identify "danger zones" instantly and avoid trading during periods of unfavorable liquidity. Key Fea
FREE
このプロダクトを購入した人は以下も購入しています
Trade Assistant MT5
Evgeniy Kravchenko
4.43 (216)
取引 ごとのリスクの 計算、新規注文 の 簡単 な 設置、部分的 な 決済機能 を 持 つ 注文管理、 7 種類 のトレーリングストップなど 、便利 な 機能 を 備 えています 。 追加の資料と説明書 インストール手順   -   アプリケーションの手順   -   デモアカウント用アプリケーションの試用版 ライン機能 チャート上にオープニングライン、ストップロス、テイクプロフィットを表示します。この機能により、新規注文を簡単に設定することができ、注文を出す前にその特徴を確認することができます。   リスク計算 リスク計算機能は、設定されたリスクとストップロス注文のサイズを考慮して、新規注文のボリュームを計算します。ストップロスの大きさを自由に設定できると同時に、設定したリスクを守ることができます。 Lot calc ボタン - リスク 計算 を 有効 / 無効 にします 。 Risk フィールドでは 、必要 なリスクの 値 を 0 から 100 までのパーセンテージまたは 預金通貨 で 設定 します 。 設定」 タブで 、 リスク 計算 の 種類 を 選択 します :「 $ 通
Trade Manager EAへようこそ。これは、取引をより直感的、正確、そして効率的にするために設計された究極の リスク管理ツール です。これは単なるオーダー実行ツールではなく、包括的な取引計画、ポジション管理、リスク管理のためのソリューションです。初心者から上級者、迅速な実行を必要とするスキャルパーまで、Trade Manager EAはあらゆるニーズに対応し、為替、指数、商品、暗号通貨などさまざまな市場で柔軟に対応します。 Trade Manager EAを使用すると、複雑な計算が過去のものになります。市場を分析し、エントリーポイント、ストップロス、テイクプロフィットのレベルをチャート上のラインでマークし、リスクを設定するだけで、Trade Managerが最適なポジションサイズを即座に計算し、SLとTPをピップ、ポイント、口座通貨でリアルタイムに表示します。すべての取引が簡単かつ効果的に管理されます。 主な機能: ポジションサイズ計算機 :定義されたリスクに基づいて取引サイズを瞬時に決定します。 簡単な取引計画 :エントリー、ストップロス、テイクプロフィットを設定するためのド
Local Trade Copier EA MT5
Juvenille Emperor Limited
4.94 (149)
Local Trade Copier EA MT5 は、同一の Windows PC または Windows VPS 上で稼働する複数の MetaTrader 5 口座間で、取引をコピーおよび管理するための高速で柔軟なトレードコピーツールです。 ローカルでの取引同期に加え、Receiver 側でロットサイズ、リスク管理、取引フィルター、シンボルマッピング、取引管理、口座保護を個別に設定できます。 Transmitter と Receiver のターミナルは約 1分 で設定でき、同一ブローカーまたは異なるブローカーの口座間で、手動取引や EA による取引をコピーできます。適切な条件下では、ローカルの MetaTrader ターミナル間で取引情報を 0.5秒未満 で同期できます。実際の約定速度は、ブローカーのレイテンシー、ネットワーク状況、PC/VPS の性能、ターミナルの負荷によって異なります。 ご購入前に無料デモをお試しください Local Trade Copier EA MT5 の完全機能版無料デモ を、MT5 デモ口座で 1回につき4時間 テストできます。 Local Trad
================================================================================ POC BREAKOUT - V20.72. Full Professional Grade Toolkit ================================================================================ POC Breakout is a full MetaTrader 5 trading dashboard for discretionary traders who want breakout signals, Point of Control (POC) context, volume profiles, order flow, market structure, news, alerts, and advanced trade planning in one professional workspace. Attached directly to you
Telegram to MT5 Multi-Channel Copier   は、 Telegram と Discord チャンネルのトレードシグナルを MetaTrader 5 へ自動コピーします。ボット不要、ブラウザ拡張不要、手動コピー不要。Telegram や Discord にシグナルが届くと、EA が数秒であなたのターミナルに注文を出します。 さらに、チャンネルをコピーする前に、内蔵バックテスターでそのチャンネルがあなたの口座でどう動いたかを確認できます。 製品は 2 つのコンポーネントで構成されます:Telegram チャンネルを監視する Windows アプリと、MT5 ターミナルでシグナルを執行する本 EA です。MT4 版もあります   こちら . セットアップガイドとアプリのダウンロード:   https://www.mql5.com/en/blogs/post/768988 Telegramのシグナルチャンネルをバックテストする方法 をご覧ください。 現在の価格は今後値上げされます。 仕組み アプリはあなた自身の Telegram アカウントで接続するため、フォロ
Strategy Ledger Pro
Abdullah Uygar Tuna
5 (11)
日本語に対応しました。 Strategy Ledger Pro は、MetaTrader 5 用の読み取り専用の口座分析パネルです。口座の成績をエキスパートアドバイザー(EA)、戦略、銘柄、マジックナンバーごとに分け、それぞれが実際にどれだけ貢献しているかを明らかにします。 パネルは 11 言語に対応しています:English、Français、Deutsch、Español、Italiano、Português、Русский、Türkçe、中文、日本語、한국어。 デモをダウンロードする前に。 Market では、有料製品のデモはストラテジーテスター内でのみ実行されます。このパネルはご自身の口座の取引を分析しますが、ストラテジーテスターには読み取る口座履歴がないため、デモは空のパネルで起動し、その旨を表示します。これはデモの仕組みによるもので、製品の制限ではありません。 この説明内の動画では、実口座でのパネルの動作をご覧いただけます。 すべての機能を解説した詳しい マニュアル (英語)と、情報交換やお知らせのための AureusAI Trading Suite グループをご用意し
TradePanel MT5
Alfiya Fazylova
4.88 (170)
Trade Panelは多機能なトレーディングアシスタントです。アプリには手動取引用の50以上のトレーディング機能が搭載されており、ほとんどの取引作業を自動化することができます。 アプリの説明書: https://www.mql5.com/en/blogs/post/756482 デモ口座用アプリの試用版: https://www.mql5.com/en/blogs/post/750865 アプリのインストール方法: https://www.mql5.com/en/blogs/post/756239 アプリをビジュアルモードでテストする方法: https://www.mql5.com/en/blogs/post/770277 VPSのMetaTraderにアプリをインストールする方法: https://www.mql5.com/en/blogs/post/770190 取引。 ワンクリックで取引操作を行うことができます: リスクを自動計算して指値注文やポジションを開く。 複数の注文やポジションをワンクリックで開く。 注文のグリッドを開く。 保留中の注文やポジションをグループごとに閉じる
自分の取引ルールで Telegram のシグナルをコピー Telegram to MT5 Signal Trader は、Telegram の公開・非公開チャンネルやグループから、テキスト形式の取引シグナルを MetaTrader 5 へ自動でコピーします。1つのデスクトップアプリで複数の配信者と MT5 口座を管理し、 配信者ごとにリスクと取引設定を個別に指定 できます。 シグナルのコピーに Telegram ボットや API 設定は必要ありません。 電話番号または QR コードでご自身の Telegram アカウントにログインし、すでに参加しているチャンネルやグループを選ぶだけです。ボットの作成や、Telegram API トークン、API ID、API hash の入力は不要です。 ポジションサイズを選び、複数の利確水準に分けて決済し、建値へのストップ移動やトレーリングストップを自動化できます。配信者のシグナルを受け取りながら、実際の取引方法は自分で管理できます。 本製品は、この MT5 エキスパートアドバイザ(EA)と、必須の Windows 連携アプリで構成されます。 インス
Farmed Hedge Yield Farming | All Markets (Manual - Hybrid - Semi/Automated EA) VERIFIED TRADING RESULTS - Farmed Hedge Yield Axi Copy:  https://www.mql5.com/en/signals/2356376 - Farmed Hedge Yield Exn Copy:   https://www.mql5.com/en/signals/2356404 - Farmed Hedge Yield V Copy:  https://www.mql5.com/en/signals/2357156 IMPORTANT NOTICE: FarmedHedge is a MANUAL-FOCUSED TRADING UTILITY ,not a fully automated EA. Results shown on this Signal include manual trades and overall strategic management.
The product will copy all telegram signal to MT5 ( which you are member) , also it can work as remote copier.  Easy to set up, copy order instant, can work with almost signal formats, image signal,  s upport to translate other language to English Work with all type of channel or group, even channel have "Restrict Saving Content", work with  multi channel, multi MT5 Work as remote copier: with signal have ticket number, it will copy exactly via ticket number. Support to backtest signal. How to s
Power Candles Strategy Scanner - 自動最適化型マルチシンボル設定ファインダー パワーキャンドル・ストラテジー・スキャナーは 、パワーキャンドル・インジケーターを駆動するのと全く同じ自己最適化エンジンを、マーケットウォッチに登録されているすべての銘柄に対して並行して実行します。1つのパネルで、現在統計的に取引可能な銘柄、各銘柄で勝率の高い戦略、最適なストップロス/テイクプロフィットの組み合わせが表示され、新たなシグナルが発生した瞬間に通知が届きます。 このツールは、Stein Investmentsのエコシステムの一部です。  18種類以上のツールをすべて閲覧し、AIを活用したセットアップの推奨を受け取り、  https://stein.investments でコミュニティに参加しましょう 市場動向を網羅。銘柄ごとに3,000件以上の自動最適化。2種類のアラート。ワンクリックでチャートを切り替えて即座にアクション。 なぜこれが必要なのか 多くのマルチ銘柄スキャナーは、 価格の動き (ボラティリティ、変動率、銘柄ごとのRSI)を表示するだけです。それ
Quant AI Agents are independent trading Expert Advisors. Instead of trading using a fixed strategy like other conventional EAs, Quant AI Agents   is a   multi-agent AI trading framework   that turns natural-language strategy prompts into live.  WANT THE SAME RESULTS AS MY LIVE SIGNAL?   Use the exact same brokers I do:   IC MARKETS , IC TRADING   .  Unlike the centralized stock market, Forex has no single, unified price feed.  Every broker sources liquidity from different providers, creating un
Exp COPYLOT CLIENT for MT5
Vladislav Andruschenko
3.97 (35)
MetaTrader 5 用のプロフェッショナル取引コピー機 MetaTrader 向けの高速・高性能・信頼性の高い 取引コピー機 です。 COPYLOT は、MT4 と MT5 のターミナル間で Forex 取引をコピーでき、 Hedge 口座と Netting 口座の両方に対応しています。 COPYLOT MT5 版の対応構成: - MT5 Hedge → MT5 Hedge - MT5 Hedge → MT5 Netting - MT5 Netting → MT5 Hedge - MT5 Netting → MT5 Netting - MT4 → MT5 Hedge - MT4 → MT5 Netting MT4 版 完全な説明 + DEMO + PDF 購入方法 インストール方法 ログファイルの取得方法 テストと最適化の方法 Expforex のすべての製品 MT4 ターミナルへのコピーも可能です(MT4 → MT4、MT5 → MT4): COPYLOT CLIENT for MT4 COPYLOT は、2台、3台、さらには10台のターミナル間で同時に動作できる、プロフェッ
Grid Manual MT5
Alfiya Fazylova
4.73 (22)
「Grid Manual」は、注文のグリッドを操作するための取引パネルです。 ユーティリティはユニバーサルで、柔軟な設定と直感的なインターフェイスを備えています。 それは、損失を平均化する方向だけでなく、利益を増やす方向でも注文のグリッドで機能します。 トレーダーは注文のグリッドを作成して維持する必要はありません。 すべてが「Grid Manual」によって行われます。 注文を開くだけで十分であり、「Grid Manual」は注文のグリッドを自動的に作成し、非常に閉じるまでそれに付随します。 完全な説明とデモバージョン ここ。 ユーティリティの主な機能と機能 ユーティリティは、モバイル端末から開かれた注文を含め、あらゆる方法で開かれた注文を処理します。 「制限」と「停止」の2種類のグリッドで機能します。 グリッド間隔の計算には、固定と動的(ATRインジケーターに基づく)の2つの方法で機能します。 オープンオーダーグリッドの設定を変更できます。 チャート上の各注文グリッドの損益分岐点を表示します。 各注文グリッドの利益率を表示します。 ワンクリックでグリッドから収益性の高い注文を閉じるこ
Trade Indicator Assistant   is a powerful MT5 utility designed to turn indicators into automated trading systems. Its main feature is the ability to automatically detect an indicator’s   BUY and SELL signal buffers , without requiring you to know the buffer numbers, search through indicator settings, or modify the indicator source code. Bonus Indicator:   After purchasing Trade Indicator Assistant, contact me to receive   Trade Signal Pro   completely free as a bonus indicator. [Download Demo V
Footprint Chart Pro — Professional OrderFlow EA for MetaTrader 5 Version 6.34 | Professional tool for real traders | Institutional-Grade Visualization DEMO USERS - PLEASE SELECT EVERY TICK / REAL TICK WHEN TESTING AND YOU HAVE DOWNLOADED HISTORICAL DATA. IF YOU SEE A WAITING SCREEN AND IT IS NOT DOWNLOADING, IT MEANS YOU HAVE LOW HISTORICAL DATA. TRY 1 MIN AND 5 MIN FIRST ON 1 DAY DATA. ONE DAY DATA SHOULD BE THE NEWEST AND MOST CURRENT DATE. PLEASE WAIT UNTIL THE MARKET HAS ROLLED OVER PERIOD.
Signal TradingView to MT5 Pro Automator TradingViewとMetaTrader 5間の即時プロフェッショナル実行 TradingViewのシグナル(アラート)とMT5での実際の約定を繋ぐ、最も強固なコミュニケーションブリッジで、取引戦略を自動化します。スピード、柔軟性、そして完璧なリスク管理を求めるトレーダー向けに設計されたこのExpert Advisorは、あらゆるアラートメッセージを正確な成行または指値注文に変換します。 強みと利点 ユニバーサルパーシングエンジン(独自技術): あらゆるアラート形式からデータを自動的に認識し、抽出できる高度なテクノロジー。単一の固定フォーマットに制限されることはありません。システムはシンボル(銘柄)、アクション、価格、SL(ストップロス)、TP(テイクプロフィット)を自動的に理解します。 リアルタイム実行: レイテンシ(遅延)を最小限に抑えるよう最適化された、1秒未満の超高速ポーリング技術。シグナルを受信してから数ミリ秒以内に注文が実行されます。 機関投資家レベルのリスク管理: 以下に基づく自動かつ正確
Trade copier MT5
Alfiya Fazylova
4.61 (57)
Trade Copierは、取引口座間の取引をコピーして同期するように設計された専門的なユーティリティです。 コピーは、同じコンピューターまたはvps にインストールされている、サプライヤーのアカウント/端末から受信者のアカウント/端末に行われます。 購入する前に、デモ アカウントでデモ バージョンをテストできます。 デモ版 こちら 。 詳細な説明は こちら 。 主な機能と利点: MT5ネッティングアカウントを含む、MT5> MT5、MT4> MT5、MT5> MT4のコピーをサポートします。 高いコピー速度(0.5秒未満)。 ベンダーモードと受信者モードは同じ製品内に実装されています。 チャートから直接リアルタイムでコピーを制御できる、簡単で直感的なインターフェイス。 接続が切断されたり、端末が再起動されたりしても、設定と位置が失われることはありません。 コピーするシンボルを選択できます。また、受信者のシンボルを置き換えることもできます(例:EURUSD> USDJPY)。 各シンボルごとにコピーの個別設定を行うことができます。 バックコピーをサポートします。 特定の注文のみのコピー
Telegram To MT5 — シグナルコピア Telegram チャンネルのトレードコールを、実際の MT5 注文に変換します — 自動で、好きなだけの口座に対応し、リスクとルールは完全にあなたの管理下に置けます。 Telegram To MT5 は、あなたが Telegram で既にフォローしている VIP / シグナルチャンネルを MetaTrader 5 端末に接続します。無料の付属デスクトップアプリがメッセージを読み取り(ボットを禁止しているチャンネルでも可能)、この EA があなたの口座でそれらを執行します — あなた自身のリスク設定、シンボルマッピング、テイクプロフィット処理、セッションおよびニュースフィルターを適用します。 これはシグナルコピアであり、ブラックボックス戦略ではありません。どのチャンネルを信頼するか、各トレードのロットと管理方法をあなたが決めます。 ステップバイステップの設定と付属アプリのインストールガイド 仕組み [あなたの Telegram チャンネル] -> [付属デスクトップアプリ] -> [MT5 + この EA] -> 注文 付属デスクトッ
Trade Dashboard simplifies how you open, manage, and control your trades, with built-in lot size calculation. It allows you to execute trades, manage risk, and control positions directly on the chart, with tools such as partial close, breakeven, and trailing stop. Designed to reduce manual work and help you stay focused on your trading decisions. A demo version is available for testing. Detailed explanations of features are provided within the MQL5 platform. Installation instructions are include
The Patch It never opens a trade. It walks behind the ones that did. Every open position, every pending order — checked twice a second for the one thing that's easy to forget: a stop, a target. Found bare, it doesn't ask. It writes the missing number in, measured in points from wherever the position began, and moves on to the next. No strategy, no opinion on direction. Just the quiet assumption that nothing should ever sit on the market unprotected — not because someone decided it shouldn't,
FUTURES ORDERFLOW FOOTPRINT CHART Professional OrderFlow EA for MetaTrader 5 Version 1.01| Professional tool for real traders | Institutional-Grade Visualization STRATEGY TESTER USERS - PLEASE SELECT EVERY REAL TICK WHEN TESTING AND YOU HAVE DOWNLOADED HISTORICAL DATA. IF YOU SEE A WAITING SCREEN AND IT IS NOT DOWNLOADING, IT MEANS YOU HAVE LOW HISTORICAL DATA. TRY 1 MIN AND 5 MIN FIRST ON 1 DAY DATA. ONE DAY DATA SHOULD BE THE NEWEST AND MOST CURRENT DATE. PLEASE WAIT UNTIL THE MARKET HAS ROL
HINN MAGIC ENTRY – the ultimate tool for entry and position management! SIMPLE. FASTEST. INTUITIVE. MAX AUTOMATED. Place orders by selecting a level directly on the chart! full description   ::  demo-version  :: 60-sec-video-description Key features: - Market, limit, and pending orders - Automatic lot size calculation - Automatic spread and commission accounting - Unlimited partitial take-profits  - Breakeven and trailing stop-loss and take-profit  functions - Invalidation leves - Intuitive, a
Seconds Chart - MetaTrader 5で秒足チャートを作成するユニークなツールです。 Seconds Chart を使用すると、秒単位のタイムフレームでチャートを構築でき、標準的な分足や時間足チャートでは得られない柔軟性と分析精度を実現します。例えば、 S15 は15秒足を表します。カスタムシンボルをサポートしているインジケーターやEAをすべて使用できます。標準的なチャートと同様に便利に操作できます。 標準的なツールとは異なり、 Seconds Chart は超短期のタイムフレームでも高い精度と遅延なく作業できるように設計されています。 Free Demo: Seconds Chart v2.29 Demo.ex5 無料デモをダウンロードしてご自身でお確かめください: 完全機能版 - すべての機能が利用可能 24時間テスト - 精度と利便性を評価するのに十分な時間 デモ口座のみ - ほとんどのブローカーで簡単に開設可能 GBPCADチャートのみ - ほとんどの端末で利用可能 これらの制限はデモ版のみに適用されます。製品版は、あらゆる口座タイプ(リアル、デモ、コンテス
Your EAs cannot see each other, but Anchor can. Anchor gives you one place to coordinate your EAs, manage risk, and decide when trading is allowed. It works alongside the trading bots you already use without any changes to them. The Problem One EA opens a trade. Then another starts trading. The next thing you know, you wake up to multiple grids built across your account. Each EA may be doing exactly what it was designed to do, but together they can place far more risk on your account than you in
この製品は、ニュースタイム中にすべてのエキスパートアドバイザーと手動チャートをフィルタリングするため、急激な価格変動によるマニュアルトレードのセットアップの破壊や他のエキスパートアドバイザーによって入力された取引について心配する必要はありません。この製品には、ニュースのリリース前にオープンポジションとペンディングオーダーを処理できる完全な注文管理システムも付属しています。 The News Filter  を購入すると、将来のエキスパートアドバイザーのためにビルトインのニュースフィルターに頼る必要はなく、今後はすべてのエキスパートアドバイザーをここからフィルタリングできます。 ニュース選択 ニュースソースは、Forex Factoryの経済カレンダーから取得されます。 USD、EUR、GBP、JPY、AUD、CAD、CHF、NZD、CNYなど、任意の通貨数に基づいて選択できます。 Non-Farm(NFP)、FOMC、CPIなどのキーワード識別に基づいて選択することもできます。 影響レベルによってフィルタリングするニュースを選択することができ、低、中、高の影響範囲から選択できます。
Floor Watch
Syed Tauqeer Hussain Shah
Floor Watch One number, watched every thirty seconds: how far equity has fallen since the day began — or since its highest point, if it's told to trail the peak instead of the open. Cross the line and it doesn't argue. Every open position closes, every pending order vanishes, and anything that slips through afterward gets shut the moment it appears. Not asked. Removed. The floor holds until the clock turns 5 AM Pakistan time — then, and only then, does the day start over. One rule. No except
MetaTrader 5 用トレーディングパネル — チャートとキーボードから行うプロフェッショナルなワンクリック取引 アクティブトレーダーのために設計された高機能 Trading Panel。標準の MetaTrader 操作よりも、はるかに速く、直感的に、そして効率的に取引を実行できます。 本パネルは、ポジション管理、未決注文管理、利益コントロール、執行スピードをひとつのプロフェッショナルなワークスペースに集約した実践的なソリューションです。 これは単なる補助ツールではありません。MetaTrader 5 のための本格的な trading cockpit です。チャートから直接操作し、キーボードで素早くコマンドを実行し、自動計算や視覚的なガイドを活用することで、手動トレードをより速く、より明確に、より快適にします。 このパネルを使えば、チャート上からワンクリックで注文を実行でき、標準の MetaTrader コントロールと比べて最大 30 倍速く取引操作を行うことができます。 新しいプレミアム版が利用可能です: VirtualTradePad PRO SE で取引ワークフローを強
MT5 to Discord Signal Provider は、Discord へ直接トレーディングシグナルを送信するために設計された、使いやすく完全にカスタマイズ可能なユーティリティです。このツールは、あなたのトレーディングアカウントを効率的なシグナルプロバイダーに変えます。 スタイルに合わせてメッセージフォーマットをカスタマイズ!利便性を考え、事前にデザインされたテンプレートから選択し、メッセージのどの要素を含めるか除外するかを選択できます。 [ デモ ] [ マニュアル ] [ MT4 バージョン ] [ Telegram バージョン ]  New: [ Telegram To MT5 ] セットアップ 簡単なセットアップのために、私たちの詳細な ユーザーガイド に従ってください。 Discord API の事前知識は必要ありません。必要なツールはすべて提供されます。 主な特徴 購読者の更新のための注文詳細をカスタマイズ。 ブロンズ、シルバー、ゴールドなど、各レベルで異なるシグナルアクセスを提供する階層的サブスクリプションモデルを実装。 注文が実行されたチャートのスクリーン
作者のその他のプロダクト
The   Candle Timer indicator   displays an advanced bar countdown timer on a chart. This study indicates the remaining time for the last candle in the chart. Main features The indicator shows the remaining time for the last bar in the chart. Alert notifications for new bar. Works on every timeframe (M1, M5, M15, M30, H1, H4, D1, W1, MN). Customizable parameters (Colors, Text size, Visibility...). Ideal tool for all kinds of trading (Scalpers, intraday traders...). Very fast calculation. Availa
FREE
The   Heikin Ashi indicator   is our version of the Heikin Ashi chart. Unlike competitor products, this indicator offers extensive options for calculating Heikin Ashi candles. In addition, it can be displayed as a classic or smoothed version. The indicator can calculate Heikin Ashi with moving average by four methods: SMA  - Simple Moving Average SMMA  - Smoothed Moving Average EMA  - Exponential Moving Average LWMA  - Linear Weighted Moving Average Main features The indicator shows Heikin As
FREE
The   Pivot Point indicator   automatically calculates and displays the pivot point line and support and resistance levels. Pivot can be calculated according to the Classic, Floor, Fibonacci, Woodie, Camarilla or DeMark formula. It is also possible to select the period for calculating the indicator. A trader can choose from daily, weekly, monthly, or user-defined periods. Types of pivots Classic Floor Fibonacci Woodie Camarilla DeMark Main features The indicator shows the current and historic
FREE
The   Candle Timer indicator   displays an advanced bar countdown timer on a chart. This study indicates the remaining time for the last candle in the chart. Main features The indicator shows the remaining time for the last bar in the chart. Alert notifications for new bar. Works on every timeframe (M1, M5, M15, M30, H1, H4, D1, W1, MN). Customizable parameters (Colors, Text size, Visibility...). Ideal tool for all kinds of trading (Scalpers, intraday traders...). Very fast calculation. Availa
FREE
The   OHLC indicator   shows the current and historical values of High, Low, Open, Close and Mid for a specific time period. It can plot the current values or the values from the previous session. The indicator's range can be calculated from a daily, weekly, monthly, or user-specified session. Levels High  of the current or previous session. Low  of the current or previous session. Open  of current or previous session. Close  of the current or previous session. Midpoint  of the current or prev
FREE
The   Trading Sessions indicator   is a simple tool that helps to highlight a specific trading session. For example, it can be used to differentiate the European, American or Asian sessions. Main features The indicator shows a user-defined trading session. Alert notifications for the start and end of the session. Custom session time. Works on every timeframe (M1, M5, M15, M30, H1, H4, D1, W1, MN). Customizable parameters (Colors, alerts...). It can be used for creating EA. Available for MT4 an
FREE
The   Heikin Ashi indicator   is our version of the Heikin Ashi chart. Unlike competitor products, this indicator offers extensive options for calculating Heikin Ashi candles. In addition, it can be displayed as a classic or smoothed version. The indicator can calculate Heikin Ashi with moving average by four methods: SMA  - Simple Moving Average SMMA  - Smoothed Moving Average EMA  - Exponential Moving Average LWMA  - Linear Weighted Moving Average Main features The indicator shows Heikin As
FREE
The   Pivot Point indicator   automatically calculates and displays the pivot point line and support and resistance levels. Pivot can be calculated according to the Classic, Floor, Fibonacci, Woodie, Camarilla or DeMark formula. It is also possible to select the period for calculating the indicator. A trader can choose from daily, weekly, monthly, or user-defined periods. Types of pivots Classic Floor Fibonacci Woodie Camarilla DeMark Main features The indicator shows the current and historic
FREE
The   Fibonacci indicator   automatically displays the Fibonacci retracement levels, representing significant support and resistance. The range for calculating the indicator can be taken from the previous day, week, month, year or user-specified session. Levels 100 %  (High) of the range from the previous session. 0 %  (Low) of the range from the previous session. 76,4 %  of the range from the previous session. 61,8 %  of the range from the previous session. 50 %  of the range from the previou
FREE
The   Fibonacci indicator   automatically displays the Fibonacci retracement levels, representing significant support and resistance. The range for calculating the indicator can be taken from the previous day, week, month, year or user-specified session. Levels 100 %  (High) of the range from the previous session. 0 %  (Low) of the range from the previous session. 76,4 %  of the range from the previous session. 61,8 %  of the range from the previous session. 50 %  of the range from the previou
FREE
The   Trading Sessions indicator   is a simple tool that helps to highlight a specific trading session. For example, it can be used to differentiate the European, American or Asian sessions. Main features The indicator shows a user-defined trading session. Alert notifications for the start and end of the session. Custom session time. Works on every timeframe (M1, M5, M15, M30, H1, H4, D1, W1, MN). Customizable parameters (Colors, alerts...). It can be used for creating EA. Available for MT4 an
FREE
The Volume Weighted ATR indicator is a helpful tool for measuring market activity. It is based on the idea of the Volume-Weighted ATR. Combining these two elements helps identify potential turning points or breakout opportunities. The indicator for the classification of the activity of the market uses the moving average and its multiples. Accordingly, where the VWATR bar is located (relative to the moving average), it is labelled as ultra-low, low, average, high, very high or ultra high. The Vo
FREE
The   Volume Weighted ATR indicator   is a helpful tool for measuring market activity. It is based on the idea of the Volume-Weighted ATR. Combining these two elements helps identify potential turning points or breakout opportunities. The indicator for the classification of the activity of the market uses the moving average and its multiples. Accordingly, where the VWATR bar is located (relative to the moving average), it is labelled as ultra-low, low, average, high, very high or ultra high. Th
FREE
The   OHLC indicator   shows the current and historical values of High, Low, Open, Close and Mid for a specific time period. It can plot the current values or the values from the previous session. The indicator's range can be calculated from a daily, weekly, monthly, or user-specified session. Levels High  of the current or previous session. Low  of the current or previous session. Open  of current or previous session. Close  of the current or previous session. Midpoint  of the current or prev
FREE
The  Equity Curve indicator   is a simple and helpful tool that shows the development of the equity curve in real time. For precision measurement, it should be used in a separate window with a period of M1. Main features The indicator shows the development of the equity curve in real time. High precision on the minute chart. High-speed calculation. Available for MT4 and MT5. Please visit the   Equity Curve indicator   product page for the input and output parameters settings.

FREE
The   Close script   is a simple tool that allows traders to close their trades by three methods. Just run the script and choose the close method. Closing methods Symbol  - Allows closing all open trades for a specific symbol. All_Trades  - Allows closing all open trades. Magic_Number  - Allows closing all open trades according to their magic number. Recommendation AutoTrading functions must be activated.  If the AutoTrading function is disabled, the script will not work. EA should be stopped.
FREE
The   Retracement indicator   shows the current and historical high, low and mid values. Optionally, it can also display major retracement levels. All these levels together form the significant levels of support and resistance. Therefore, it is essential to know them for every kind of trader. Levels High Low Midpoint 76,4 % 61,8 % 38,2 % 23,6 % Main features The indicator shows the actual levels of High, Low, Mid and selected retracements. Four optional retracement levels. Alert notifications
FREE
The  Equity Curve indicator   is a simple and helpful tool that shows the development of the equity curve in real time. For precision measurement, it should be used in a separate window with a period of M1. Main features The indicator shows the development of the equity curve in real time. High precision on the minute chart. High-speed calculation. Available for MT4 and MT5. Please visit the   Equity Curve indicator   product page for the input and output parameters settings.
FREE
The   Retracement indicator   shows the current and historical high, low and mid values. Optionally, it can also display major retracement levels. All these levels together form the significant levels of support and resistance. Therefore, it is essential to know them for every kind of trader. Levels High Low Midpoint 76,4 % 61,8 % 38,2 % 23,6 % Main features The indicator shows the actual levels of High, Low, Mid and selected retracements. Four optional retracement levels. Alert notifications
FREE
Knowledge of the strength and weakness of each currency is vital for every forex trader. Our   Currency Strength Meter indicator   measures the strength of eight major currencies (USD, EUR, GBP, CHF, JPY, CAD, AUD, NZD) by using the Relative Strength Index indicator, also known as RSI. The Currency Strength Meter indicator shows you, simply and quickly, when a currency is oversold, overbought, or in "normal area". This way, you can identify which currency is the strongest and the weakest. Our
The ATR indicator is a helpful tool for measuring the range of bars. It quickly and easily helps evaluate the ATR's current spread (range), which is especially useful for VSA traders. The indicator for classifying the range of bars (candles) uses the moving average and its multiples. Accordingly, the area where the volume is located (relative to the moving average) is labeled as ultra-low, low, average, high, very high, or ultra-high. Our ATR indicator is rendered as a histogram. This indicator
The   Volume indicator   is an excellent tool for measuring tick volume or real volume activity. It quickly and easily helps traders evaluate the volume's current size. The indicator for classification of the volume size uses the moving average and its multiples. Accordingly, the area where the volume is located (relative to the moving average) is labeled as ultra-low, low, average, high, very high, or ultra-high. This indicator can calculate the moving average by four methods: SMA - Simple Mov
The   Currency Barometer indicator   is a unique tool that measures the strength of two currencies represented in the pair and compares the difference between them. The result is shown as a histogram where you can simply identify which currency is the strongest. This indicator is designed to measure the strengths and weaknesses of eight major currencies (USD, EUR, GBP, CHF, CAD, JPY, AUD, and NZD) and works on 28 currency pairs. The indicator uses the CI method (Commodity Channel Index) to calc
The   Volume Spread Analysis indicator   is based on the original Volume Spread Analysis method. It was designed for quick and easy recognition of VSA patterns. Even though this indicator looks very simple, it is the most sophisticated tool we've ever made. It is a really powerful analytical tool that generates very reliable trading signals. Because it is very user-friendly and understandable, it is suitable for every type of trader, regardless of his experience. What is VSA? VSA - Volume Spre
The   VWAP indicator   is our version of the popular Volume-Weighted Average Price indicator. The VWAP is the ratio between the value traded (price multiplied by the number of volume traded) and the total volume traded over a specific time period. As a result, it measures the average price of the instrument much better than the simple moving average. Although there are many ways to use the VWAP, most investors use it to calculate the daily average.  The indicator works in five modes: Moving  -
The Correlation Matrix indicator shows the actual correlation between the selected instruments. The default setting is set to 28 currency pairs, gold, and silver, but the indicator can compare any other symbols. Interpretation of the indicator Positive correlation  (correlation is above 80 %). Negative correlation  (correlation is below -80 %). Weak or no correlation  (correlation is between -80 and 80 %). Main features The indicator shows the actual correlation between the selected instrumen
The Currency Index indicator enables traders to display any index of eight major currencies. It uses a special calculation that considers specific currency pairs and their weights. The default weights are based on the BIS Triennial Central Bank Survey results. Because of this advantage, the trader can see each currency's true strength and weakness. Note:  If the indicator is used in Strategy Tester (demo version), please keep in mind that all currency pairs' data must be downloaded in History
The Pairs Cross indicator is a unique tool for negatively correlated trading instruments, such as EURUSD and USDCHF currency pairs. It is based on a concept called pairs trading (or spread trading). Our indicator compares the strength of two currency pairs that are inversely correlated and quickly tells you when it’s time to buy the first pair and short a second pair, and vice versa. This is a straightforward approach to trading currency pairs that works very well. How to you use the Pairs Cro
The Pairs Spread indicator has been developed for the popular strategy known as pairs trading, spread trading, or statistical arbitrage. This indicator measures the distance (spread) between prices of two directly (positively) correlated instruments and shows the result as a curve with standard deviations. So, traders can quickly identify when the instruments are too far apart and use this information for trade opportunities.  How to use the Pairs Spread indicator Best results are attained whe
The Supply and Demand Zones indicator is one of the best tools we have ever made. This great tool automatically draws supply and demand zones, the best places for opening and closing positions. It has many advanced features such as multi timeframe zones support, displaying the width of zones, alert notifications for retouched zones, and much more. Because of market fractality, this indicator can be used for any kind of trading. Whether you are a positional, swing, or intraday trader does not ma
フィルタ:
削除済み 2019.01.14 08:00 

ユーザーは評価に対して何もコメントを残しませんでした

Ali irwan
5149
Ali irwan 2017.08.03 01:00 

ユーザーは評価に対して何もコメントを残しませんでした

Nork
6187
Nork 2017.07.21 15:55 

ユーザーは評価に対して何もコメントを残しませんでした

レビューに返信