Trading Sessions MT4 Indicator by PipTick

1

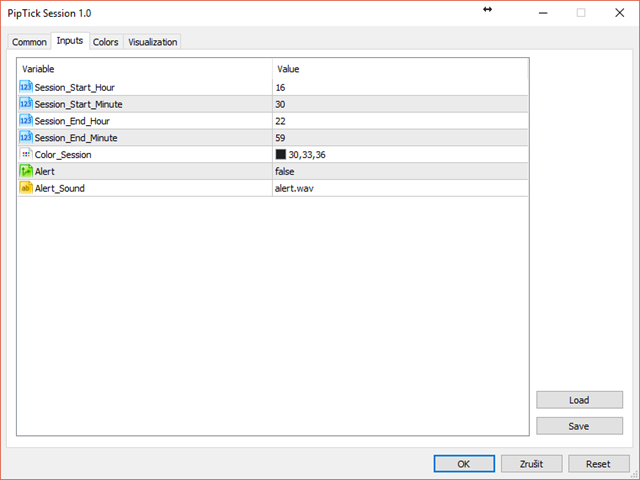
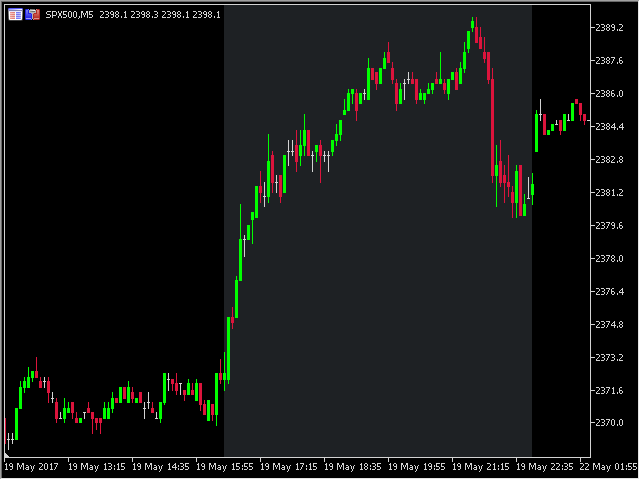
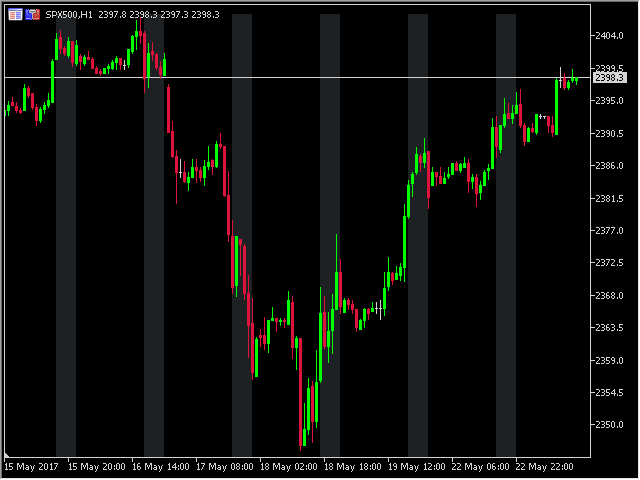
The Trading Sessions indicator is a simple tool that helps to highlight a specific trading session. For example, it can be used to differentiate the European, American or Asian sessions.


Main features

  • The indicator shows a user-defined trading session.
  • Alert notifications for the start and end of the session.
  • Custom session time.
  • Works on every timeframe (M1, M5, M15, M30, H1, H4, D1, W1, MN).
  • Customizable parameters (Colors, alerts...).
  • It can be used for creating EA.
  • Available for MT4 and MT5.


Please visit the Trading Sessions indicator product page for the input and output parameters settings.

おすすめのプロダクト
This indicator is designed to provide all useful information about symbol, account, positions and profit. It is developed for improving trader's money management. Parameters Calc can be divided to separate blocks. Each block is possible to hide, set its own color and other properties. Block symbol: This block displays information about actual SPREAD, POINT VALUE (in deposit currency for 1 lot), SWAP LONG and SHORT. Show symbol info - display/hide this block Color of symbol info - color of this
FREE
Virtual Assistant MINI   VIRTUALL ASSISTANT = MAKE YOUR TP AND SL VIRTUAL!   Tool meant to control your stop loss and take profit by converting them to virtual SL/TP (with support for TRAILING) Convert all SL and TP to virtual so your exits on trades are hidden from your broker! Run this EA on any graph, choose 1MIN timeframe (VA is autosaving data only on new bar detected, so graph TF equals to VA autosave period) !!! When using virtual trade exits, stable connection is needed for order executi
FREE
This simple but useful script calculates the lot in % of the deposit. It is indispensable for risk management. There is only one customizable parameter: MaxRisk - risk in % for lot calculation. The product works as a standard script. Launch it once on an appropriate chart and start trading using the calculated lot value. Genious is simplicity! Happy trading!
FREE
完全無料 — フル機能・制限なし・登録不要。 完全無料・制限なしでご利用いただけます。チャートで役立つと感じられましたら、短いレビューをいただけると何よりの助けになります。30秒で終わり、他のトレーダーがこのツールを見つける唯一の手がかりになります。 Falconが役に立ったら、ぜひレビューをお願いします。無料提供の継続につながります。 対応プラットフォーム: MetaTrader 4(このページ)。MetaTrader 5 版: https://www.mql5.com/en/market/product/182633 同開発者の他ツール (FXEA365): - Aegis Account Protector MT4(口座全体の資産保護): https://www.mql5.com/en/market/product/188539 - Donchian Trend Engine MT4(当社のトレンドEA・こちらも完全無料): https://www.mql5.com/en/market/product/185537 - 全EA・ツール一覧: https://www
FREE
VR カラー レベルは、トレンドライン、四角形、テキストなどの要素を使用してテクニカル分析を適用する人にとって便利なツールです。グラフにテキストを直接追加したり、スクリーンショットを撮ったりすることができます。 設定、設定ファイル、デモ版、説明書、問題解決方法は、以下から入手できます。 [ブログ] レビューを読んだり書いたりすることができます。 [リンク] のバージョン [MetaTrader 5] インジケーターの操作は ワンクリック で実行できます。これを行うには、線の付いたボタンをクリックすると、カーソルの下に傾向線が表示されます。次に、カーソルを移動して 線の位置 を選択し、もう一度クリックして修正します。 インジケーター の特徴は、スタイルと色のすべての変更が自動的に保存され、その後すべての 新しく作成された グラフィック オブジェクトに適用されることです。 このインジケーターには、異なるスタイルのトレンド ラインを設定するための 2 つの独立したボタン、異なるスタイルの 2 つの独立した四角形、独自のスタイルを持つ 1 つのテキスト フィールド、およびスクリーンショット
FREE
Account Info EA It is a tool that presents on the graph all the positions of the account, and specific information concerning the positions, but also the account. It enables the user to have an image of his account at a glance. Use like any expert advisor. You can't attach it in the same chart with other expert advisor. It does not have the ability to open or manage positions. You can attach it on any chart and any timeframe.
FREE
IceFX’s TradeInfo is an utility indicator which displays the most important information of the current account and position. Displayed information: Information about the current account (Balance, Equity, Free Margin). Current spread, current drawdown (DD), planned profit, expected losses, etc. Number of open position(s), volume (LOT), profit. Today’s and yesterday’s range. Remaining time to the next candle. Last day profit information (with integrated IceFX ProfitInfo indicator). Risk-based LOT
FREE
After purchasing the Tpx Dash Supply Demand indicator, you must download this indicator which will link and feed market data to the Tpx Dash Supply Demand indicator and will provide all Supply Demand price signals, ATR Stop, VAH and VAL, trend values ​​with the ADX, and POC prices and locations in the market. Just download it and Dash will locate the indicator to retrieve the information!
FREE
Fastest way to change the period. Suitable for traders who use many charts and timeframes. Size, shape and color can be customized. Inputs Parameters Corner — Choose corner placement Standart is "Right lower chart corner" Color — Background color of the button ColorText — Text color of the button ColorOn — Background color of the button for the current period ColorOnText — Text color of the button for the current period Font — Arial, Verdana... FontSize — Size of the font in pixels DistanceX —
FREE
Core Positioning Advanced analytical tool designed specifically for MT4, providing in-depth analysis of trading history, uncovering data insights, optimizing strategies, and enhancing profitability. Core Usage Strategy Performance Evaluation: Analyzes profitability, stability, and risk to provide an objective rating from A+ to D. Trading Pattern Discovery: Identifies high-quality assets, time periods, and profit-making habits suited to different market conditions. Risk Management Optimization: C
FREE
PZ Penta O MT4
PZ TRADING SLU
2.33 (3)
The Penta-O is a 6-point retracement harmonacci pattern which usually precedes big market movements. Penta-O patterns can expand and repaint quite a bit. To make things easier this indicator implements a twist: it waits for a donchian breakout in the right direction before signaling the trade. The end result is an otherwise repainting indicator with a very reliable trading signal. The donchian breakout period is entered as an input. [ Installation Guide | Update Guide | Troubleshooting | FAQ | A
FREE
Arlene Sessions Background is an indicator that draws colored rectangles on the chart depending on your session, within the price range that has moved and when the sessions overlap, it will be painted in a color that will be the mixture of the colors of the respective sessions. You can see the version 2 here:  https://www.mql5.com/en/market/product/68934 Inputs NumberOfDays AsiaBegin AsiaEnd AsiaColor EurBegin EurEnd EurColor USABegin USAEnd USAColor If you only want to paint a session on your
FREE
Enhanced Volume Profile: The Ultimate Order Flow & Liquidity Analysis Tool Overview Enhanced Volume Profile   is an indicator for MetaTrader 5 that displays the traded volume at specific price levels over a defined period. It separates the total volume into buy and sell components, presenting them as a side-by-side histogram on the chart. This allows users to observe the volume distribution and the proportion of buy and sell volumes at each price level. Graphics Rendering The indicator uses t
FREE
Safety
Sergey Ermolov
5 (2)
私は誰もが"安全"のようなお金の管理のルールを知っていると思います。 気づいていない人のために、金庫は取引の利益がストップの大きさに等しい後にポジションの半分を閉じることを前提としています。 したがって、価格が逆転してストップをキャッチしたとしても、ポジションの一部を以前に閉じたときにまったく同じ量の利益が得られたため、お金を失うことはありません。 Safety Expert Advisorには、決算ロットという設定が1つしかありません。 ポジション0のままにすると、アドバイザーはトランザクションのちょうど半分を閉じます。 Expert Advisorをインストールすると、expert Advisorによって利益の一部が固定される場所のグラフに赤い破線が表示されます。 アドバイザーがトランザクションの一部を別のレベルで閉じるようにする場合は、この行を別の場所に安全に移動できます。 同じ通貨ペアで複数の取引を開いている場合は、マウスカーソルでEAをチャートにドラッグし、安全に閉じたい注文開始レベルの近くにeaをドロップする必要があります。 Expert Advisorは注文チケッ
FREE
Free. Set your risk, click Buy or Sell, done. TrueRisk Trade Panel works out the lot size for you. Type how much of your account you want to risk (for example 1%), set the stop loss in points or drag it on the chart, and the BUY and SELL buttons already show the right lot. No lot calculator, no guessing, no trade that risks ten times more than you meant. TrueRisk Account Dashboard MT4 (free) | TrueRisk Symbol Changer MT4 (free) | MT5 version | All TrueRisk tools NEW (free): a picture of every tr
FREE
Volume By Color RSJ は、出来高が自身の移動平均を上回ったときに出来高バーを濃い色で表示するため、通常と異なる動きのあったローソク足が目立ちます。 オプションの4色モードでは、各ローソク足の出来高の強さを段階的に表示します。 初期設定では、各バーを出来高の20期間単純移動平均と比較します。平均の種類と期間は入力パラメータで変更できます。 使い方 色分けされたバーにより、通常を上回る出来高を伴って発生したブレイクアウト、反発、クライマックスのローソク足を簡単に見つけられます。 高い出来高で水準をブレイクしたローソク足は、その動きに多くの参加者がいることを示し、出来高の少ないブレイクアウトは関心が薄いことを示します。 4色モードでは、各色が平均と比較した出来高の強さの範囲を表し、弱いものから非常に強いものまで段階的に示します。 このインジケーターはサブウィンドウに表示され、あらゆる銘柄と時間足で使用できます。 このインジケーターが役に立ったと感じたら、レビューを書いていただけると幸いです。他のトレーダーが見つけやすくなります。 同じ作者の製品(MetaTrader 5):
FREE
Swing Low MT4
Teerathad Booranawisedkul
Key Features: Automatic swing detection on any timeframe (M1 to MN1) Visual arrow indicators (red for swing highs, blue for swing lows) Adjustable sensitivity with customizable swing strength parameter Dynamic arrow positioning that never overlaps with candles Instant display when changing timeframes - no delays Compatible with MT4 and MT5 platforms Clean, professional interface with minimal screen clutter Lightweight code for fast performance Customizable colors and arrow sizes Customizable S
FREE
Smart Lot-Size Calculator And Trade Assistant for Mobile Trading Overview: This is the tool every trader in the market must have no matter if you are scalper, swing traders, day trader, or long term trader. This On-The-Go trading tool will help you stay disciplined and also stay free from daily trade management chores, Most traders face common problems like   1. Calculation of proper lot-size of a position to take controlled risk  2. Managing every trade and trailing stop-loss if trades goes in
FREE
Your chart. One glance. Total clarity. Built by @Ash_TheTrader for traders who are tired of guessing, Extreme Trading Dashboard is a professional-grade heads-up display that sits quietly in the corner of your chart — dark charcoal, rounded, semi-transparent, and genuinely easy on the eyes — until the moment it matters. Dual Session Highlighter Shade up to two independent time windows directly on your chart — London, New York, or your own custom kill-zone. Each gets its own color, so overlappi
FREE
Scalping One MT4 free バージョンです。 1ポジションを1つのボタンで表示します。リアルタイムで損益、  Lot、  Pointを表示。チャート通貨のみと全通貨ペアのポジションの表示を切り替え可能。(free版は3ポジションのみ) 日本語、英語に自動識別対応(設定タブは英語のみですが http://www.emkyuradias.shop/emkyuradias.shop/instruction.html にて日本語Helpを用意) 口座通貨表記はドル、ユーロ、ポンド、円に対応(自動識別) タイムラインの描画機能は、ローカルタイム(PC時間)、カレントタイム、東京、ニューヨーク、ロンドン、シドニー時間を選択可能な時計表示と連動可能、サマータイム対応。 ラウンドナンバー、日、週、月、年の安値、高値ライン表示、非表示がワンクリックで可能、高値安値は時間表示上のデータ表示部分にて個別に表示も可能です。
FREE
Simple RSI trader
Aleksei Sukhanov
4.5 (2)
This is a simple Expert Advisor that uses the RSI indicator to enter a trade and several patterns. the advisor trades one deal and each deal has a stop loss and take profit (set in the settings) in case of failure (the deal is closed by stop loss), it is possible to increase the lot of the next deal. The telegram group:   https://t.me/FXAdvisorsMy Start_trade - time to start trading End_trade   - trade end time Lot             -  size of the lot for opening the first order (this is a fixed lot
FREE
~~~~~Product Description~~~~~ This Close Panel Trading can Help Our Trading Plane . This has 13 Button Box , 2 Key In Box and 1 Description . CloseBuy All         - To Close All Buy Active Order CloseBuy Profit     - To Close All Buy Active Profit Order CloseBuy Lose      - To Close All Buy Active Lose Order CloseBuy Pending - To Close All Pending Buy Order CloseSell All         - To Close All Sell Active Order CloseSell Profit    - To Close All Sell Active Profit Order CloseSell Lose      - To
FREE
Constructor is a convenient tool for creating, (building strategies) testing and applying trading strategies and ideas, as well as testing and using separate indicators and their groups. Constructor includes opening, closing, deal tracking, averaging and recovery modules, as well as various trading options with and without averaging and martingale. You are able to connect up to 10 different external indicators. Find the detailed instructions in the attached pdf file. Trading settings averaging
FREE
MT4用NAS100 Auto SL and TP Makerをご紹介します: MetaTrader4でナスダック100市場をナビゲートするトレーダーにとって不可欠なアシスタントであるNAS100オートSLおよびTPメーカーで、ストップロスおよびテイクプロフィットの設定をもう見逃すことはありません。このツールは、ストップロスとテイクプロフィットのレベル管理を自動化するシームレスなソリューションを求める方々のために設計されています。 主な特徴 簡単な自動化: ストップロスやテイクプロフィットのないナスダック100取引を自動的に監視します。 ユーザーが構成した設定に基づいてレベルを動的に調整します。 注文タイプの多様性: Nasdaq100の成行注文と未決済注文の両方に対応。 MetaTrader 4で利用可能な様々な注文タイプをサポートします。 カスタマイズされた設定: ユーザーフレンドリーなパラメータ設定により、トラッキング設定とストップロス/テイクプロフィットレベルのカスタマイズが可能です。 柔軟な範囲: 実行する特定のNAS100商品、または取引されるすべての商品に対してStop
FREE
Automated Timeframe cycling with Symbols centered.  Force every timeframe onto one clock window, so the story you see on Daily is the same story you are slicing on H4, H1, and M1.  Traders usually flip timeframes and lose the span. A Daily chart shows a few weeks, then M15 shows a few hours, and the eye treats them as different markets. This indicator locks the window to N bars of the highest enabled timeframe — default 10 Daily — and maps every lower timeframe to that same stretch. You stay ins
FREE
Advanced Market Sessionsインジケーターで市場のリズムをマスターしよう。 トレードにおいてタイミングはすべてです。主要な金融センターがいつ開き、いつ閉まるのかを正確に把握することが、市場のボラティリティ、流動性、方向性バイアスを理解するための鍵となります。このインジケーターは、アジア、ロンドン、ニューヨークという3つの主要なトレーディングセッションをクリアに可視化します。 各セッションの高値(High)と安値(Low)をリアルタイムで自動マッピングすることにより、真の機関投資家のコンテキストに沿ったトレードが可能になります。スマートマネーコンセプト(SMC)、ICT、ブレイクアウト戦略、平均回帰のいずれを取引する場合でも、セッションの境界線を知ることは、高確率なトレードセットアップを見つけるために不可欠です。 主なメリット: 流動性プール(Liquidity Pools)の特定: セッションの高値と安値は、価格にとって自然な磁石です。流動性がどこに溜まっているかを容易に把握し、ブレイクアウトやダマシ(ストップ狩り)を予測できます。 オーバーラップ(時間帯重複)の活
FREE
This MQL4 indicator creates a customizable grid of horizontal lines on your trading chart. Here's what it does: **Main Functions:** - Draws equally spaced horizontal lines across the visible price range - Supports two line types: horizontal lines or trend lines with forward projection - Automatically adjusts to price scale changes **Key Features:** 1. **Customizable Spacing**: Set grid distance in pips (20 pips by default) 2. **Flexible Starting Point**: Auto-calculates starting price or lets
FREE
The Night Scalper EA Lite is a fully automated Expert Advisor that trades at night and relies on price reversion. The EA trades using market orders and has the option to use time averaging to improve performance. This EA works best on EURUSD using the M5 timeframe, but will also work on AUDUSD, GBPUSD, NZDUSD, USDCAD, USDCHF and likely many more. A VPS is advisable when trading this system and a low spread and commission based broker is best. Check the comments for back test results and optimiz
FREE
it is hard to do full margin strategy in MT4, because you cannot close all orders easily. Unlock the power of full margin trading with confidence using   FullMargin RiskGuard , a cutting-edge Expert Advisor (EA) designed specifically for beginner traders on the MetaTrader 5 platform. Inspired by the renowned trading style of Papip Celebes, this EA empowers users to execute full trade strategies while safeguarding their capital with advanced risk management features. Key Features: MaxFloatingLos
FREE
Pips Hunter PRO MT4
Rodrigo Arana Garcia
5 (1)
Pips Hunter PRO は数年かけて開発され、前作の改良版です。この強力なインジケーターは、マーケットと価格の履歴を分析し、売買エントリーを生成します。これらのエントリーの計算には、複雑な統計的対数だけでなく、連動する様々なインジケーターを使用し、不利なエントリーをフィルタリングして排除します / MT5バージョン 。 特徴 リペイントなし このインディケータは、新しいデータが到着してもその値を変更しません ラグなし このインディケータはラグがありません 取引ペア すべてのFXペア  (できればEURGBP) 時間枠  すべての時間枠 パラメータ ===== 表示 矢印の距離 // シグナル(矢印)とローソク足の距離 ===== アラート ポップアップアラート // MT4ターミナル用のアラート プッシュ通知 // 携帯電話向けアラート メールアラート // メールアラート ===== チャート設定 チャート上のローソク足の色を変更するオプション。 警告 私はMQL5.comでのみ製品を販売しています。もし誰かが私の製品を売りたいと連絡して
FREE
このプロダクトを購入した人は以下も購入しています
Trade Manager EAへようこそ。これは、取引をより直感的、正確、そして効率的にするために設計された究極の リスク管理ツール です。これは単なるオーダー実行ツールではなく、包括的な取引計画、ポジション管理、リスク管理のためのソリューションです。初心者から上級者、迅速な実行を必要とするスキャルパーまで、Trade Manager EAはあらゆるニーズに対応し、為替、指数、商品、暗号通貨などさまざまな市場で柔軟に対応します。 Trade Manager EAを使用すると、複雑な計算が過去のものになります。市場を分析し、エントリーポイント、ストップロス、テイクプロフィットのレベルをチャート上のラインでマークし、リスクを設定するだけで、Trade Managerが最適なポジションサイズを即座に計算し、SLとTPをピップ、ポイント、口座通貨でリアルタイムに表示します。すべての取引が簡単かつ効果的に管理されます。 主な機能: ポジションサイズ計算機 :定義されたリスクに基づいて取引サイズを瞬時に決定します。 簡単な取引計画 :エントリー、ストップロス、テイクプロフィットを設定するためのド
Local Trade Copier EA MT4
Juvenille Emperor Limited
4.96 (111)
Local Trade Copier EA MT4 は、同一の Windows PC または Windows VPS 上で稼働する複数の MetaTrader 4 口座間で、取引をコピーおよび管理するための高速で柔軟なトレードコピーツールです。 ローカルでの取引同期に加え、Receiver 側でロットサイズ、リスク管理、取引フィルター、シンボルマッピング、取引管理、口座保護を個別に設定できます。 Transmitter と Receiver のターミナルは約 1分 で設定でき、同一ブローカーまたは異なるブローカーの口座間で、手動取引や EA による取引をコピーできます。適切な条件下では、ローカルの MetaTrader ターミナル間で取引情報を 0.5秒未満 で同期できます。実際の約定速度は、ブローカーのレイテンシー、ネットワーク状況、PC/VPS の性能、ターミナルの負荷によって異なります。 ご購入前に無料デモをお試しください Local Trade Copier EA MT4 の完全機能版無料デモ を、MT4 デモ口座で 1回につき4時間 テストできます。 Local Trad
Exp COPYLOT CLIENT for MT4
Vladislav Andruschenko
4.69 (65)
MetaTrader 4向け 高機能トレードコピーソフト MetaTrader 4 用の、高速・安定・高機能なトレードコピーソフトです。 COPYLOT は、 MetaTrader 4 と MetaTrader 5 間でFX取引をコピーでき、さまざまな口座タイプや運用スタイルに合わせて柔軟に同期できます。 COPYLOT MT4版の対応コピー方式: MetaTrader 4 → MetaTrader 4 MetaTrader 5 Hedge → MetaTrader 4 MetaTrader 5 Netting → MetaTrader 4   MT5版 詳細説明 + DEMO + PDF 購入方法 インストール方法 ログファイルの取得方法 テストと最適化の方法 Expforexの全製品 MetaTrader 5版 を使えば、 MetaTrader 5 → MetaTrader 5 および MetaTrader 4 → MetaTrader 5 のコピーにも対応します: COPYLOT CLIENT for MT5 COPYLOT は、2台、3台、さらには10台規模のターミナル環境でも
Grid Manual MT4
Alfiya Fazylova
4.71 (17)
「Grid Manual」は、注文のグリッドを操作するための取引パネルです。 ユーティリティはユニバーサルで、柔軟な設定と直感的なインターフェイスを備えています。 それは、損失を平均化する方向だけでなく、利益を増やす方向でも注文のグリッドで機能します。 トレーダーは注文のグリッドを作成して維持する必要はありません。 すべてが「Grid Manual」によって行われます。 注文を開くだけで十分であり、「Grid Manual」は注文のグリッドを自動的に作成し、非常に閉じるまでそれに付随します。 完全な説明とデモバージョン ここ。 ユーティリティの主な機能と機能 ユーティリティは、モバイル端末から開かれた注文を含め、あらゆる方法で開かれた注文を処理します。 「制限」と「停止」の2種類のグリッドで機能します。 グリッド間隔の計算には、固定と動的(ATRインジケーターに基づく)の2つの方法で機能します。 オープンオーダーグリッドの設定を変更できます。 チャート上の各注文グリッドの損益分岐点を表示します。 各注文グリッドの利益率を表示します。 ワンクリックでグリッドから収益性の高い注文を閉じるこ
Trade Indicator Assistant is a powerful MT4 utility designed to turn indicators into automated trading systems. Its main feature is the ability to automatically detect an indicator’s   BUY and SELL signal buffers , without requiring you to know the buffer numbers, search through indicator settings, or modify the indicator source code. Bonus Indicator: After purchasing Trade Indicator Assistant, contact me to receive Trade Signal Pro completely free as a bonus indicator. [Download Demo Version]
TradePanel MT4
Alfiya Fazylova
4.84 (95)
Trade Panelは多機能なトレーディングアシスタントです。アプリには手動取引用の50以上のトレーディング機能が搭載されており、ほとんどの取引作業を自動化することができます。 アプリの説明書: https://www.mql5.com/en/blogs/post/756482 デモ口座用アプリの試用版: https://www.mql5.com/en/blogs/post/750865 アプリのインストール方法: https://www.mql5.com/en/blogs/post/756239 アプリをビジュアルモードでテストする方法: https://www.mql5.com/en/blogs/post/770277 VPSのMetaTraderにアプリをインストールする方法: https://www.mql5.com/en/blogs/post/770190 取引。 ワンクリックで取引操作を行うことができます: リスクを自動計算して指値注文やポジションを開く。 複数の注文やポジションをワンクリックで開く。 注文のグリッドを開く。 保留中の注文やポジションをグループごとに閉じる
Trade Assistant MT4
Evgeniy Kravchenko
4.43 (197)
取引 ごとのリスクの 計算、新規注文 の 簡単 な 設置、部分的 な 決済機能 を 持 つ 注文管理、 7 種類 のトレーリングストップなど 、便利 な 機能 を 備 えています 。 追加の資料と説明書 インストール手順 - アプリケーションの手順   ライン機能 チャート上にオープニングライン、ストップロス、テイクプロフィットを表示します。この機能により、新規注文を簡単に設定することができ、注文を出す前にその特徴を確認することができます。   リスク計算 リスク計算機能は、設定されたリスクとストップロス注文のサイズを考慮して、新規注文のボリュームを計算します。ストップロスの大きさを自由に設定できると同時に、設定したリスクを守ることができます。 Lot calc ボタン - リスク 計算 を 有効 / 無効 にします 。 Risk フィールドでは 、必要 なリスクの 値 を 0 から 100 までのパーセンテージまたは 預金通貨 で 設定 します 。 設定」 タブで 、 リスク 計算 の 種類 を 選択 します :「 $ 通貨」、「 % 残高」、「 % エクイティ 」、「 % フリ
Close If Profit or Loss with Trailing for MetaTrader 4 — 総利益または総損失で自動決済 MetaTrader 4 用の実用的な取引管理ツールです。設定した総利益または総損失に到達すると、選択されたポジションを自動的に決済できます。 Expert Advisor は保有中の取引を監視し、含み損益を計算し、Trailing Profit を使用して、手動操作より素早くポジション管理を行うことができます。 MetaTrader 4 は現在でも、裁量トレーダー、スキャルピング、グリッド取引、EA 運用で広く使用されています。しかし、MT4 には複数ポジションを「合計結果」で簡単に自動決済する標準機能がありません。このユーティリティは、その不足している管理機能を追加します。 Close If Profit or Loss with Trailing は、裁量取引、他の Expert Advisors、グリッドシステム、ナンピン、リカバリー戦略、複数シンボルの取引と組み合わせて使用できます。ルールを設定すれば、EA が結果を監視し、条件に到
Trade copier MT4
Alfiya Fazylova
4.62 (37)
Trade Copierは、取引口座間の取引をコピーして同期するように設計された専門的なユーティリティです。 コピーは、同じコンピューターまたはvps にインストールされている、サプライヤーのアカウント/端末から受信者のアカウント/端末に行われます。 購入する前に、デモ アカウントでデモ バージョンをテストできます。 デモ版 こちら 。 詳細な説明は こちら 。 主な機能と利点: MT5ネッティングアカウントを含む、MT4> MT4、MT4> MT5、MT5> MT4のコピーをサポートします。 高いコピー速度(0.5秒未満)。 ベンダーモードと受信者モードは同じ製品内に実装されています。 チャートから直接リアルタイムでコピーを制御できる、簡単で直感的なインターフェイス。 接続が切断されたり、端末が再起動されたりしても、設定と位置が失われることはありません。 コピーするシンボルを選択できます。また、受信者のシンボルを置き換えることもできます(例:EURUSD> USDJPY)。 各シンボルごとにコピーの個別設定を行うことができます。 バックコピーをサポートします。 特定の注文のみのコピー
サポートが必要ですか?設定方法は?ご質問は?こちらでお客様の言語でどうぞ、迅速に返信します: https://www.mql5.com/en/market/product/139089/comments 無料トライアル版ダウンロード Copy Cat More (コピーキャット・モア) MT4 トレードコピー (Trade Copier) は単なるローカルのトレードコピーではありません。今日のトレード課題のために設計された 完全なリスク管理・執行フレームワーク (risk management and execution framework) です。プロップファーム (prop firm) のチャレンジから個人のポートフォリオ管理まで、堅牢な執行、資金保護、柔軟な設定、高度なトレード処理の組み合わせによって、あらゆる状況に適応します。 このコピーは   マスター (Master、送信側) と スレーブ (Slave、受信側)   の両モードで動作し、成行注文・指値注文、トレードの変更、部分決済、そして両建て決済 (Close By) 操作をリアルタイムで同期します。デモ口座と実口
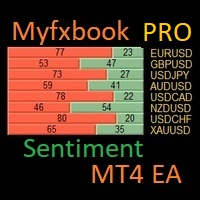
I have created this  MT4 Tool EA to test if it is more profitable to trade in favor of the mass sentiment of traders or it is better to go against it. Remember to authorize Myfxbook url in WebRequest options in MT4 .  Features: Market Sentiment update every 30 minutes SL TP BreakEven Trail SL Daily Target Profit Max Daily DrawDown (Useful for prop firm) Max Spread Filter Time Filter Custom Trade Comments Protection in case a pair is not read correctly from the web (Prevents improper closing or o
News Filter EA: Advanced Algo Trading Assistant News Filter EA is an advanced algo trading assistant designed to enhance your trading experience. By using the   News Filter EA , you can integrate a Forex economic news filter into your existing expert advisor, even if you do not have access to its source code. In addition to the news filter, you can also specify   trading days   and   hours   for your expert. The News Filter EA also includes   risk management   and   equity protection   features
DoIt Trade Manager - Risk Panel and EA Position Manager for MT4 Finding an entry is only half the job. Many execution mistakes happen in position sizing, partial exits, breakeven, trailing and account protection. DoIt Trade Manager puts the complete workflow on the chart. Plan the risk before entry, execute the order and apply consistent management rules to your manual trades and selected positions opened by other EAs. Full setup guide + how the free version works and where PRO starts :  https:/
CBOEオプションデータからのリアルタイムGEXレベル。ES、NQ、RTY、Gold。2分ごとに更新。 Full description: GammaOrderBook — オールインワンEA。ライブGEXデータをダウンロードしチャートに直接表示。別途インジケーター不要。 表示内容 • GEX Bars — コール/プットのガンマレベル、ETF/Index別に色分け • Zero Gamma Line — ヘッジ方向が変わる重要レベル • Panorama V4 — マルチタイムフレームガンマポジショニング • サポート/レジスタンス — オプション建玉からの主要レベル • Bias Panel — BULL/BEAR/NEUTRALシグナル、OIポジショニング • Distance Display — Zero Gammaからのリアルタイム距離 • アナウンスシステム — 重要な更新をチャート上に表示 対応銘柄 • ES / SP500 • NQ / Nasdaq • RTY / Russell • GC / Gold データ更新 • 2分ごと(リアルタイム) • 複
Drawdown Minimizer for MetaTrader 4 - your EAs pay in, old losers get paid off. This utility runs next to your other Expert Advisors and never opens a trade. It keeps a savings book of the net realized profit of your whole account and uses it to close the oldest losing positions of the EAs you choose - slice by slice, oldest first. WHY IT EXISTS Made by traders, for traders. One of our grid EAs got stuck in drawdown for months. The old positions did not come back, and they paid swap every single
The product will copy all telegram signal to MT4   ( which you are member  ) , also it can work as remote copier.  Easy to set up, copy order instant, can work with almost signal formats, image signal, s upport to translate other language to English Work with all type of channel or group, even channel have "Restrict Saving Content", work with  multi channel, multi MT5 Work as remote copier: with signal have ticket number, it will copy exactly via ticket number. Support to backtest signal. How to
TelegramからMT4へ: 究極のシグナルコピーソリューション Telegram to MT4 は、DLLを必要とせず、TelegramのチャンネルやチャットからMetaTrader 4プラットフォームに取引シグナルを直接コピーできる最先端のユーティリティです。この堅牢なソリューションは、比類のない精度とカスタマイズオプションにより、シグナルのシームレスな実行を保証し、時間を節約し、効率性を向上させます。 [ Instructions and DEMO ] 主な特徴 直接的なTelegram API統合 電話番号とセキュアコードで認証します。 ユーザーフレンドリーな EXE ブリッジを使用して、チャット ID を簡単に取得および管理します。 複数のチャネル/チャットを追加、削除、更新して、同時に信号をコピーします。 高度なフィルターによる信号解析 カスタム例外語 (例: 「レポート」、「概要」) を含む不要な信号をスキップします。 柔軟な SL および TP 形式 (価格、ピップ、ポイント) をサポートします。 シグナルが価格ではなくポイントを指定する場合、エントリ ポイントを自動
Risk Manager MT4   is an account protection Expert Advisor for traders who want strict risk control inside MetaTrader 4. The utility monitors your account equity, daily and weekly results, drawdown, open positions, trade count, consecutive losses, and trading hours. When a configured limit is reached, it can automatically close positions, cancel pending orders, stop other EAs, send notifications, or close the terminal. Instead of relying on discipline during a stressful trading session, you defi
これは視覚的な取引パネルであり、取引を簡単に配置および管理し、人為的エラーを回避し、取引活動を強化するのに役立ちます。使いやすい視覚的なインターフェースと、健全なリスクおよび位置管理アプローチを組み合わせています。 [ インストールガイド | 更新ガイド | トラブルシューティング | よくある質問 | すべての製品 ] 驚くほど使いやすい チャートから簡単に取引 正確なリスク管理との取引、手間のかからない 資本の保存が最優先事項です 気をつけずに利益を上げましょう できるだけ早くリスクのない取引をお楽しみください 開かれているすべての取引の自動トレーリングストップ 最初のストップロスは、取引が行われるとすぐに配置されます EAは、取引を行った後に次のタスクを実行します。 最初のストップロス/テイクプロフィットは自動的に配置されます できるだけ早くフリーライドにロックします(オプション) ストップロスを初めて損益分岐点に移動します(オプション) 停止するまで、希望の方法を使用してストップロスを追跡します その他のクールな機能は次のとおりです。 優れたターミナルアクティビティレポート
The program is use to copy trading from MT4   to MT4 and MT5  on same Windows   PC or VPS .   Now you can easy copy trades to any MT4 account or MT5 account. Instants copy, speed smaller 0.1 seconds, easy to setup. Need run EA as Signal provider on one MT4 account, other MT4 / MT5 will run EA as Trade copier. You can download and try demo version on demo account Copi Trade MT4 demo   version   here   Copi Trade MT5 demo   version  here  
ATTENTION: The Indicator cannot be backtested, as it is generated exclusively from live intraday calculations based on options flow. GEX Level Converter – Gamma Exposure Mapping for CFD Charts NASDAQ-100 edition — for US100 · NDX · NAS100 · USTECH and every Nasdaq-100 CFD equivalent Instantly see professional options-market levels directly on your MetaTrader Nasdaq-100 CFD chart. The GEX Level Converter translates the daily Gamma Exposure (GEX) zones of the NDX options market into precise pri
注文管理やリスク管理など、手間のかかる作業をワンクリックまたは数クリックで行えるようにし、取引を楽にするためのユーティリティです。 特徴 リスク管理  リスク欄に%またはドルで指定されたリスクに基づいて自動的にロットを計算し、SL TPなどのラインを置くだけで入力でき、リスクリワードをリアルタイムで表示します。 TrueRiskは、FXペアのロットサイズ計算時に手数料を含むので、例えば1%を指定した場合、全ての取引手数料で1%のリスクを負うか、負わないかは、あなたの選択です。 シンボルごとの最大取引数量の10倍以上の取引をワンクリックで行えるビッグロッツハンドラーを搭載。 指数や他の資産で、自動計算されたロットサイズがロット単位に合わない場合でも、四捨五入して入力することができます。(1、0.1、0.01のロット単位に対応しています。) トレード管理  ワンクリックで可能です。 手数料とスプレッドを含む、または含まないブレイクイーブンのオープンポジションを設定することができます。 テキストフィールドにSLまたはTPの新しい価格を指定し、入力された新しいSLおよび
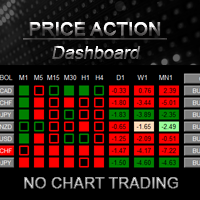
The Price Action Dashboard is an innovative tool to help the trader to control a large number of financial instruments. This tool is designed to automatically suggest signals and price conditions. The Dashboard analyzes all major Time Frame suggesting price action conditions with graphic elements. The Dashboard can suggest you the strength of the trend identifying directional movement, it is an indispensable tool for those who want to open position themselves using market trends identifiers. The
Trading History - A program for trading and money management on the history of quotes in stratagy tester. It can work with pending and immediate orders, and is equipped with trailing stop, breakeven and take profit functions. Very good for training and testing different strategies. Manual (Be sure to read before purchasing) Advantages 1. Allows you to test any trading strategy in the shortest possible time 2. An excellent simulator for trading training. You can gain months of trading experience
Shepherd Safety EA
AW Trading Software Limited
4.92 (13)
AW Shepherd Safety EA は、保有中のポジションを管理するエキスパートアドバイザーです。最初の注文はトレーダーがパネルから発注し、その後は EA がバスケットを自動で管理します。トレンドフィルターを通してリカバリー注文を追加し、TakeProfit、トレーリング、またはストップでサイドを決済し、決済の水準をチャートに表示します。 買いと売りは別々に管理され、両方のサイドを同時に保有できます。リカバリー注文は、価格が一定の間隔だけ動いたというだけでは発注されず、Parabolic SAR、2本の MA、またはローソク足の色でポジション方向への反転が確認されてから発注されます。Orders Magic number が一致していれば、手動や他の EA で発注したポジションも管理の対象になります。 EA によるポジション管理の流れ: 1 トレーダーが Open Buy または Open Sell ボタンで、Order Size 欄のロットで最初の注文を発注します。 2 価格がポジションに不利な方向へ Minimal step between recovery orders
多機能取引ツール:ロット計算機、グリッド注文、R/R比率、トレードマネージャー、需給ゾーン、プライスアクションなど デモ版   |   ユーザーマニュアル トレードアシスタント はストラテジーテスターでは動作しません:この ユーティリティ をテストするには デモ版をこちら からダウンロードしてください。 ご質問 /改善のアイデア/バグ発見 の場合は 私に連絡 してください MT5版が必要な場合は、 こちら から入手できます 取引 プロセス を簡素化、高速化、自動化します。この ダッシュボード で標準ターミナルの機能を拡張します。 取引パネル はあらゆる取引銘柄で動作します:FX、株式、指数、暗号通貨など。 1. 新規取引の開始 :ロット/リスク/RR計算:手動取引のリスク管理 ロット計算機(リスクサイズに基づく取引量計算) リスク計算機(ロットサイズに基づくリスク額) リスクリワード比率 グリッド注文: + 動的間隔オプション、分割ロットオプション 注文アクショントリガー、+ 買いストップリミット/売りストップリミット:Mt4でも可能 仮想SL、仮想TP(非表示SL、非表示TP:ブロ
Az OrderGun
Jose Antonio Valle Magana
AZ_OrderGun MT4 - Professional 1-Click Trading Panel AZ_OrderGun is the all-in-one panel to execute and manage your trades without wasting time setting up SL/TP. KEY FEATURES: 1. 4 INSTANT ENTRIES: Buy SLL - Buy with SL on Low of previous candle Sell SLH - Sell with SL on High of previous candle Buy SLO / Sell SLO - SL on Open of previous candle > Fully configurable % Risk 2. ADVANCED VISUAL MANAGEMENT: Draggable lines for Pending and Market orders Auto calculation of Lot Size, $ Ri
RS Trade Copier - 超高速 で動作するローカルトレードコピー機。 真の グラフィカルインターフェース搭載。口座番号の手動入力はもう終わりです。200項目を超える長大なパラメータリストとも、これでおさらばです。 複数のMT4とMT5ターミナル間で取引操作をコピーするための、信頼性が高く柔軟なツールです。経験豊富なトレーダーやシグナルサービス、個人投資家に適しています。1つまたは複数のシグナルソース(Provider)から1つまたは複数のレシーバー(Client)へ、高い精度と最小限の遅延で 取引を同期 します。シンプルな自動設定と高度な手動設定の両方をサポートしています。手動または他のEAで開かれた注文に干渉しません。すべての処理は MT4内でローカルに 行われ、サードパーティサーバーを使用しません。 RS Trade Copierと他のソリューションの比較 RS Trade Copier 他のソリューション 設定 ビジュアルステップバイステップウィザード。 設定時間は約1分。 200以上の分かりにくい入力パラメータ。 設定時間は約20分。 速度 非同期トレード操作。*
Telegram to MT4 Multi-Channel Copier   は、 Telegram と Discord チャンネルのトレードシグナルを MetaTrader 4 へ自動コピーします。ボット不要、ブラウザ拡張不要、手動コピー不要。Telegram や Discord にシグナルが届くと、EA が数秒であなたのターミナルに注文を出します。 さらに、チャンネルをコピーする前に、内蔵バックテスターでそのチャンネルがあなたの口座でどう動いたかを確認できます。 製品は 2 つのコンポーネントで構成されます:Telegram チャンネルを監視する Windows アプリと、MT4 ターミナルでシグナルを執行する本 EA です。MT5 版もあります   こちら . 購入前にお試しください:   アプリは無料でダウンロードできます。ご自身のチャンネルを接続し、各シグナルがどのように読み取られるかをご確認ください。Backtest タブと実際の取引には、購入またはレンタルした EA が必要です。このページの無料デモはストラテジーテスターでのみ動作し、テスターでは Telegram と D
Rhino Chart Drawing Tools は、MetaTrader 4 に TradingView スタイル の描画ワークフローを提供します。 54種類の描画ツール 、カスタマイズ可能なツールバー、お気に入り、クイックスタイル、オブジェクト設定、テンプレート、オブジェクトマネージャーを搭載しています。 ユーザーマニュアル: 製品の使い方 無料デモ版: デモ版をダウンロード MetaTrader 5版: Rhino Drawing Tools for MT5 描画ツール グループ オブジェクト一覧 ライン トレンドライン、レイ、延長ライン、水平線、垂直線、水平レイ、クロスライン、トレンド角度、矢印、パス、ポリライン、情報ライン。 チャネル 平行チャネル、回帰チャネル、フラットチャネル、ディスジョイントチャネル、ピッチフォーク。 フィボナッチ リトレースメント、エクステンション、チャネル、スピードファン、タイムゾーン。 ギャン ギャンボックス、ギャンファン。 図形 長方形、回転長方形、楕円、円、三角形、ポリライン。 注釈 テキスト、ノート、コールアウト、価格ラベル、サインポス
作者のその他のプロダクト
The   Candle Timer indicator   displays an advanced bar countdown timer on a chart. This study indicates the remaining time for the last candle in the chart. Main features The indicator shows the remaining time for the last bar in the chart. Alert notifications for new bar. Works on every timeframe (M1, M5, M15, M30, H1, H4, D1, W1, MN). Customizable parameters (Colors, Text size, Visibility...). Ideal tool for all kinds of trading (Scalpers, intraday traders...). Very fast calculation. Availa
FREE
The   Heikin Ashi indicator   is our version of the Heikin Ashi chart. Unlike competitor products, this indicator offers extensive options for calculating Heikin Ashi candles. In addition, it can be displayed as a classic or smoothed version. The indicator can calculate Heikin Ashi with moving average by four methods: SMA  - Simple Moving Average SMMA  - Smoothed Moving Average EMA  - Exponential Moving Average LWMA  - Linear Weighted Moving Average Main features The indicator shows Heikin As
FREE
The   Pivot Point indicator   automatically calculates and displays the pivot point line and support and resistance levels. Pivot can be calculated according to the Classic, Floor, Fibonacci, Woodie, Camarilla or DeMark formula. It is also possible to select the period for calculating the indicator. A trader can choose from daily, weekly, monthly, or user-defined periods. Types of pivots Classic Floor Fibonacci Woodie Camarilla DeMark Main features The indicator shows the current and historic
FREE
The   Candle Timer indicator   displays an advanced bar countdown timer on a chart. This study indicates the remaining time for the last candle in the chart. Main features The indicator shows the remaining time for the last bar in the chart. Alert notifications for new bar. Works on every timeframe (M1, M5, M15, M30, H1, H4, D1, W1, MN). Customizable parameters (Colors, Text size, Visibility...). Ideal tool for all kinds of trading (Scalpers, intraday traders...). Very fast calculation. Availa
FREE
The   OHLC indicator   shows the current and historical values of High, Low, Open, Close and Mid for a specific time period. It can plot the current values or the values from the previous session. The indicator's range can be calculated from a daily, weekly, monthly, or user-specified session. Levels High  of the current or previous session. Low  of the current or previous session. Open  of current or previous session. Close  of the current or previous session. Midpoint  of the current or prev
FREE
The   Pivot Point indicator   automatically calculates and displays the pivot point line and support and resistance levels. Pivot can be calculated according to the Classic, Floor, Fibonacci, Woodie, Camarilla or DeMark formula. It is also possible to select the period for calculating the indicator. A trader can choose from daily, weekly, monthly, or user-defined periods. Types of pivots Classic Floor Fibonacci Woodie Camarilla DeMark Main features The indicator shows the current and historic
FREE
The   Trading Sessions indicator   is a simple tool that helps to highlight a specific trading session. For example, it can be used to differentiate the European, American or Asian sessions. Main features The indicator shows a user-defined trading session. Alert notifications for the start and end of the session. Custom session time. Works on every timeframe (M1, M5, M15, M30, H1, H4, D1, W1, MN). Customizable parameters (Colors, alerts...). It can be used for creating EA. Available for MT4 an
FREE
The   Heikin Ashi indicator   is our version of the Heikin Ashi chart. Unlike competitor products, this indicator offers extensive options for calculating Heikin Ashi candles. In addition, it can be displayed as a classic or smoothed version. The indicator can calculate Heikin Ashi with moving average by four methods: SMA  - Simple Moving Average SMMA  - Smoothed Moving Average EMA  - Exponential Moving Average LWMA  - Linear Weighted Moving Average Main features The indicator shows Heikin As
FREE
The   OHLC indicator   shows the current and historical values of High, Low, Open, Close and Mid for a specific time period. It can plot the current values or the values from the previous session. The indicator's range can be calculated from a daily, weekly, monthly, or user-specified session. Levels High  of the current or previous session. Low  of the current or previous session. Open  of current or previous session. Close  of the current or previous session. Midpoint  of the current or prev
FREE
The   Fibonacci indicator   automatically displays the Fibonacci retracement levels, representing significant support and resistance. The range for calculating the indicator can be taken from the previous day, week, month, year or user-specified session. Levels 100 %  (High) of the range from the previous session. 0 %  (Low) of the range from the previous session. 76,4 %  of the range from the previous session. 61,8 %  of the range from the previous session. 50 %  of the range from the previou
FREE
The   Volume Weighted ATR indicator   is a helpful tool for measuring market activity. It is based on the idea of the Volume-Weighted ATR. Combining these two elements helps identify potential turning points or breakout opportunities. The indicator for the classification of the activity of the market uses the moving average and its multiples. Accordingly, where the VWATR bar is located (relative to the moving average), it is labelled as ultra-low, low, average, high, very high or ultra high. Th
FREE
The Volume Weighted ATR indicator is a helpful tool for measuring market activity. It is based on the idea of the Volume-Weighted ATR. Combining these two elements helps identify potential turning points or breakout opportunities. The indicator for the classification of the activity of the market uses the moving average and its multiples. Accordingly, where the VWATR bar is located (relative to the moving average), it is labelled as ultra-low, low, average, high, very high or ultra high. The Vo
FREE
The  Equity Curve indicator   is a simple and helpful tool that shows the development of the equity curve in real time. For precision measurement, it should be used in a separate window with a period of M1. Main features The indicator shows the development of the equity curve in real time. High precision on the minute chart. High-speed calculation. Available for MT4 and MT5. Please visit the   Equity Curve indicator   product page for the input and output parameters settings.
FREE
The   Fibonacci indicator   automatically displays the Fibonacci retracement levels, representing significant support and resistance. The range for calculating the indicator can be taken from the previous day, week, month, year or user-specified session. Levels 100 %  (High) of the range from the previous session. 0 %  (Low) of the range from the previous session. 76,4 %  of the range from the previous session. 61,8 %  of the range from the previous session. 50 %  of the range from the previou
FREE
The  Equity Curve indicator   is a simple and helpful tool that shows the development of the equity curve in real time. For precision measurement, it should be used in a separate window with a period of M1. Main features The indicator shows the development of the equity curve in real time. High precision on the minute chart. High-speed calculation. Available for MT4 and MT5. Please visit the   Equity Curve indicator   product page for the input and output parameters settings.
FREE
The   Retracement indicator   shows the current and historical high, low and mid values. Optionally, it can also display major retracement levels. All these levels together form the significant levels of support and resistance. Therefore, it is essential to know them for every kind of trader. Levels High Low Midpoint 76,4 % 61,8 % 38,2 % 23,6 % Main features The indicator shows the actual levels of High, Low, Mid and selected retracements. Four optional retracement levels. Alert notifications
FREE
The   Retracement indicator   shows the current and historical high, low and mid values. Optionally, it can also display major retracement levels. All these levels together form the significant levels of support and resistance. Therefore, it is essential to know them for every kind of trader. Levels High Low Midpoint 76,4 % 61,8 % 38,2 % 23,6 % Main features The indicator shows the actual levels of High, Low, Mid and selected retracements. Four optional retracement levels. Alert notifications
FREE
The   Close script   is a simple tool that allows traders to close their trades by three methods. Just run the script and choose the close method. Closing methods Symbol  - Allows closing all open trades for a specific symbol. All_Trades  - Allows closing all open trades. Magic_Number  - Allows closing all open trades according to their magic number. Recommendation AutoTrading functions must be activated.  If the AutoTrading function is disabled, the script will not work. EA should be stopped.
FREE
The   Close script   is a simple tool that allows traders to close their trades by three methods. Just run the script and choose the close method. Closing methods Symbol  - Allows closing all open trades for a specific symbol. All_Trades  - Allows closing all open trades. Magic_Number  - Allows closing all open trades according to their magic number. Recommendation AutoTrading functions must be activated.  If the AutoTrading function is disabled, the script will not work. EA should be stopped.
FREE
Knowledge of the strength and weakness of each currency is vital for every forex trader. Our   Currency Strength Meter indicator   measures the strength of eight major currencies (USD, EUR, GBP, CHF, JPY, CAD, AUD, NZD) by using the Relative Strength Index indicator, also known as RSI. The Currency Strength Meter indicator shows you, simply and quickly, when a currency is oversold, overbought, or in "normal area". This way, you can identify which currency is the strongest and the weakest. Our
The ATR indicator is a helpful tool for measuring the range of bars. It quickly and easily helps evaluate the ATR's current spread (range), which is especially useful for VSA traders. The indicator for classifying the range of bars (candles) uses the moving average and its multiples. Accordingly, the area where the volume is located (relative to the moving average) is labeled as ultra-low, low, average, high, very high, or ultra-high. Our ATR indicator is rendered as a histogram. This indicator
The   Volume indicator   is an excellent tool for measuring tick volume or real volume activity. It quickly and easily helps traders evaluate the volume's current size. The indicator for classification of the volume size uses the moving average and its multiples. Accordingly, the area where the volume is located (relative to the moving average) is labeled as ultra-low, low, average, high, very high, or ultra-high. This indicator can calculate the moving average by four methods: SMA - Simple Mov
The   Currency Barometer indicator   is a unique tool that measures the strength of two currencies represented in the pair and compares the difference between them. The result is shown as a histogram where you can simply identify which currency is the strongest. This indicator is designed to measure the strengths and weaknesses of eight major currencies (USD, EUR, GBP, CHF, CAD, JPY, AUD, and NZD) and works on 28 currency pairs. The indicator uses the CI method (Commodity Channel Index) to calc
The   Volume Spread Analysis indicator   is based on the original Volume Spread Analysis method. It was designed for quick and easy recognition of VSA patterns. Even though this indicator looks very simple, it is the most sophisticated tool we've ever made. It is a really powerful analytical tool that generates very reliable trading signals. Because it is very user-friendly and understandable, it is suitable for every type of trader, regardless of his experience. What is VSA? VSA - Volume Spre
The   VWAP indicator   is our version of the popular Volume-Weighted Average Price indicator. The VWAP is the ratio between the value traded (price multiplied by the number of volume traded) and the total volume traded over a specific time period. As a result, it measures the average price of the instrument much better than the simple moving average. Although there are many ways to use the VWAP, most investors use it to calculate the daily average.  The indicator works in five modes: Moving  -
The Correlation Matrix indicator shows the actual correlation between the selected instruments. The default setting is set to 28 currency pairs, gold, and silver, but the indicator can compare any other symbols. Interpretation of the indicator Positive correlation  (correlation is above 80 %). Negative correlation  (correlation is below -80 %). Weak or no correlation  (correlation is between -80 and 80 %). Main features The indicator shows the actual correlation between the selected instrumen
The Currency Index indicator enables traders to display any index of eight major currencies. It uses a special calculation that considers specific currency pairs and their weights. The default weights are based on the BIS Triennial Central Bank Survey results. Because of this advantage, the trader can see each currency's true strength and weakness. Note:  If the indicator is used in Strategy Tester (demo version), please keep in mind that all currency pairs' data must be downloaded in History
The Pairs Cross indicator is a unique tool for negatively correlated trading instruments, such as EURUSD and USDCHF currency pairs. It is based on a concept called pairs trading (or spread trading). Our indicator compares the strength of two currency pairs that are inversely correlated and quickly tells you when it’s time to buy the first pair and short a second pair, and vice versa. This is a straightforward approach to trading currency pairs that works very well. How to you use the Pairs Cro
The Pairs Spread indicator has been developed for the popular strategy known as pairs trading, spread trading, or statistical arbitrage. This indicator measures the distance (spread) between prices of two directly (positively) correlated instruments and shows the result as a curve with standard deviations. So, traders can quickly identify when the instruments are too far apart and use this information for trade opportunities.  How to use the Pairs Spread indicator Best results are attained whe
The Supply and Demand Zones indicator is one of the best tools we have ever made. This great tool automatically draws supply and demand zones, the best places for opening and closing positions. It has many advanced features such as multi timeframe zones support, displaying the width of zones, alert notifications for retouched zones, and much more. Because of market fractality, this indicator can be used for any kind of trading. Whether you are a positional, swing, or intraday trader does not ma
フィルタ:
Mark
122
Mark 2023.03.12 23:45 

I installed the indicator as was the only one I could find that did close to what I wanted. However when installed it kept deleting my drawings off my charts and interfered with the operation of my trade manager EA, so sadly had to uninstall again.

Matthew Todorovski
13126
Matthew Todorovski 2018.06.16 10:15 

ユーザーは評価に対して何もコメントを残しませんでした

Tim Eubanks
5763
Tim Eubanks 2018.03.22 01:52 

ユーザーは評価に対して何もコメントを残しませんでした

Ali irwan
5149
Ali irwan 2017.07.28 13:40 

ユーザーは評価に対して何もコメントを残しませんでした

808
97
808 2017.06.29 01:20 

ユーザーは評価に対して何もコメントを残しませんでした

レビューに返信