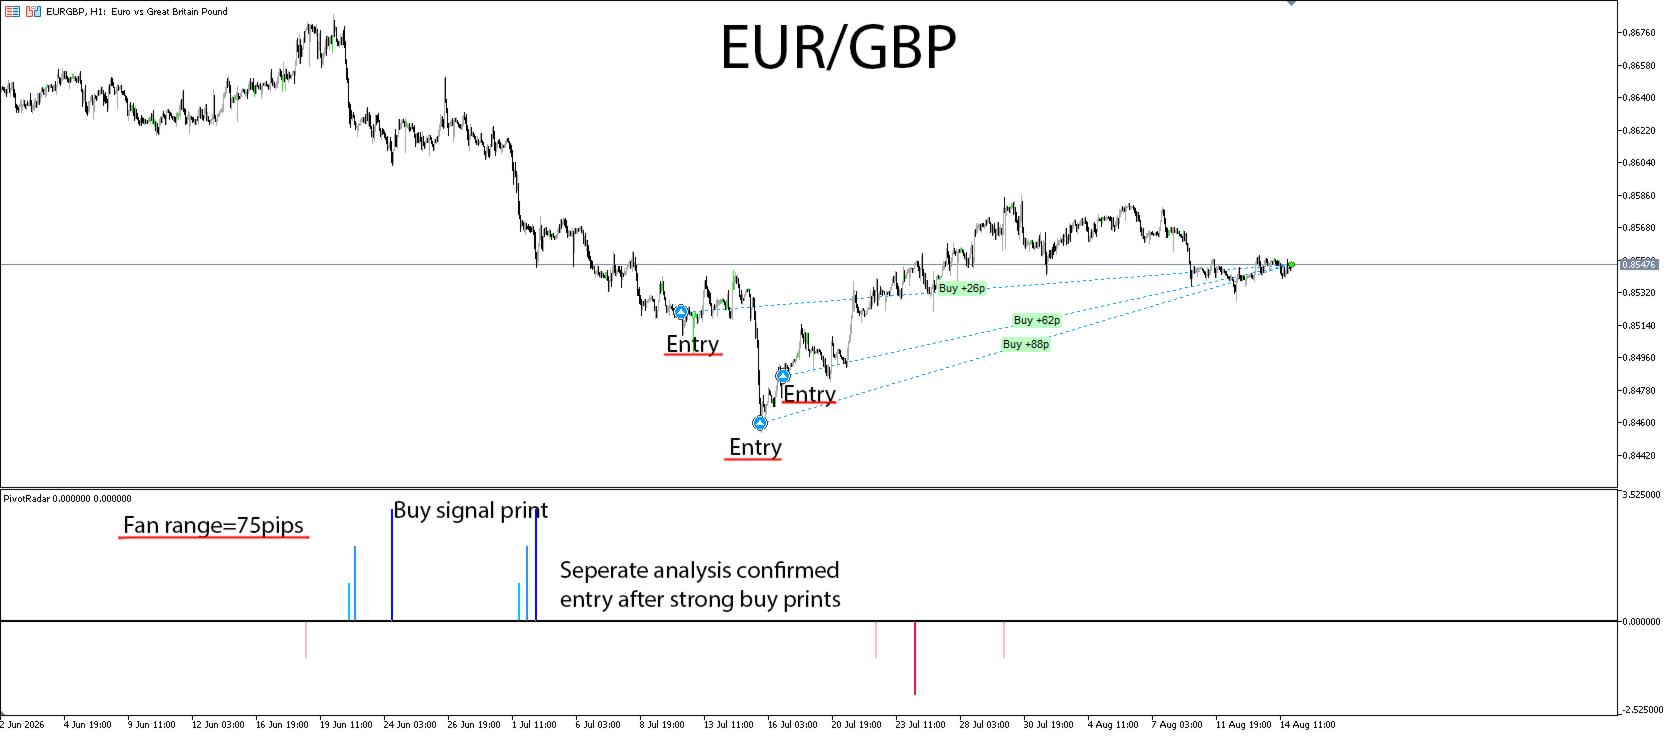
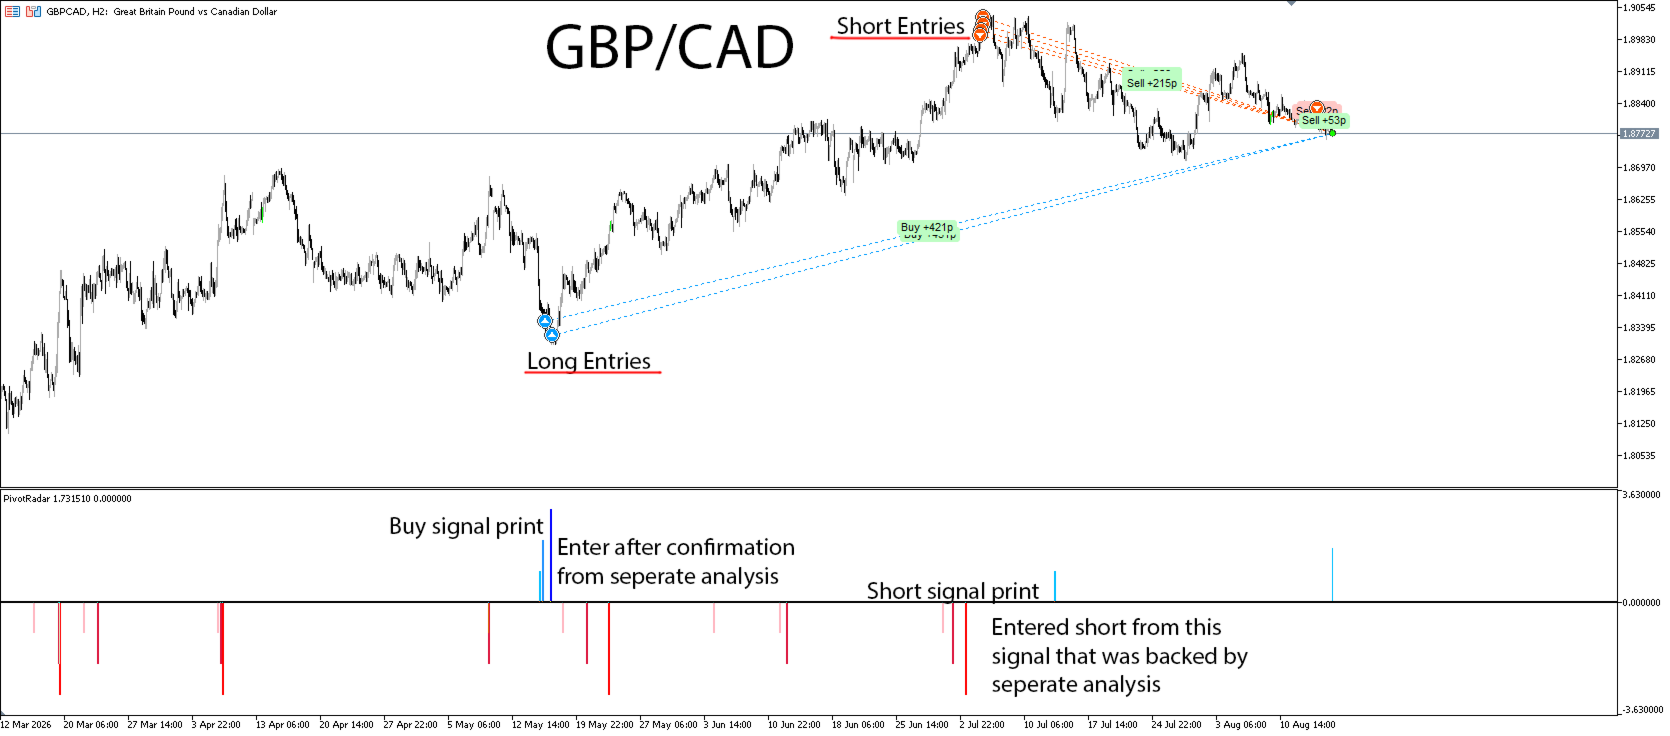
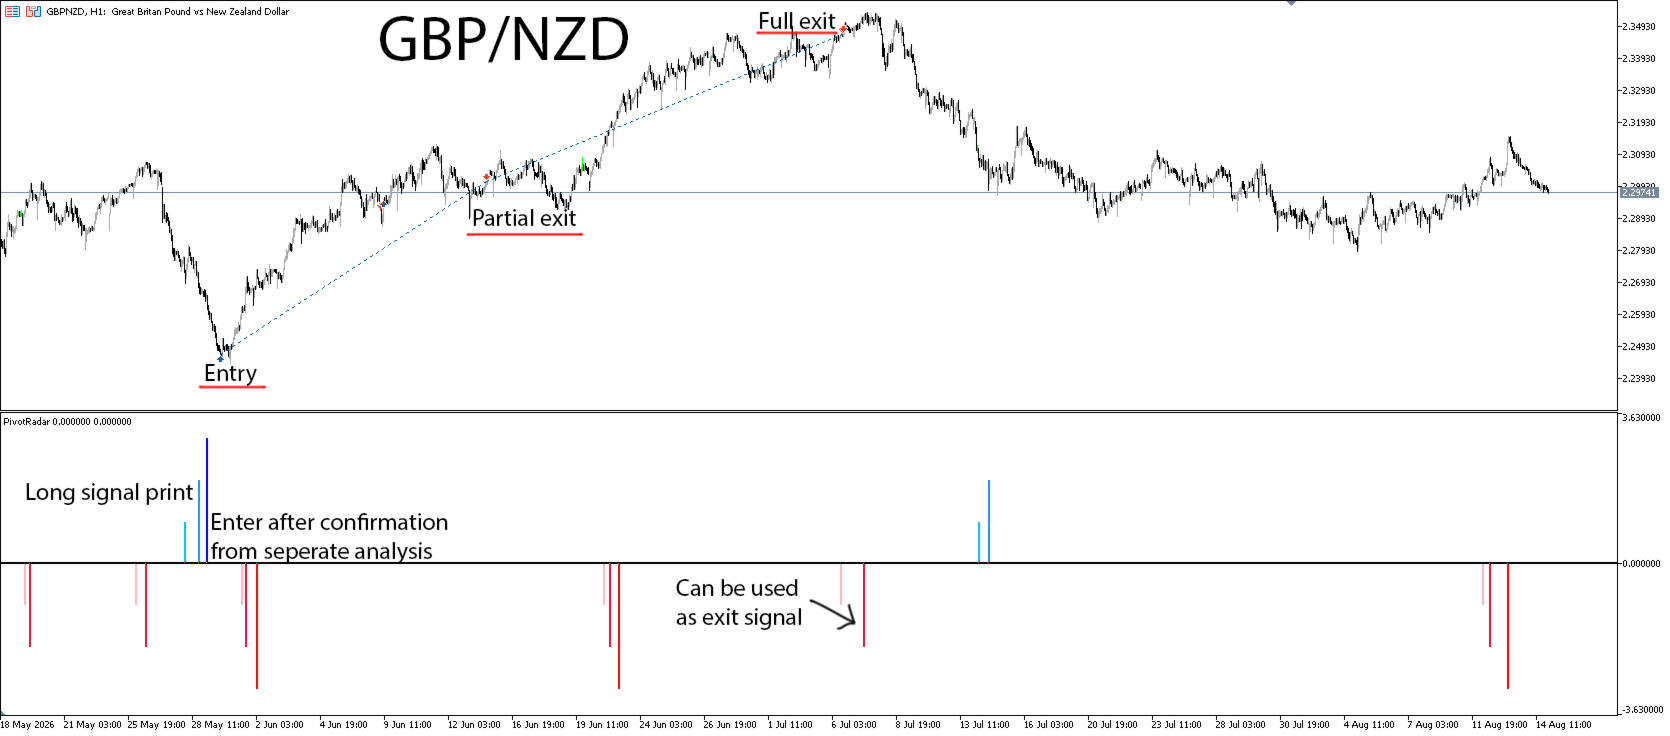
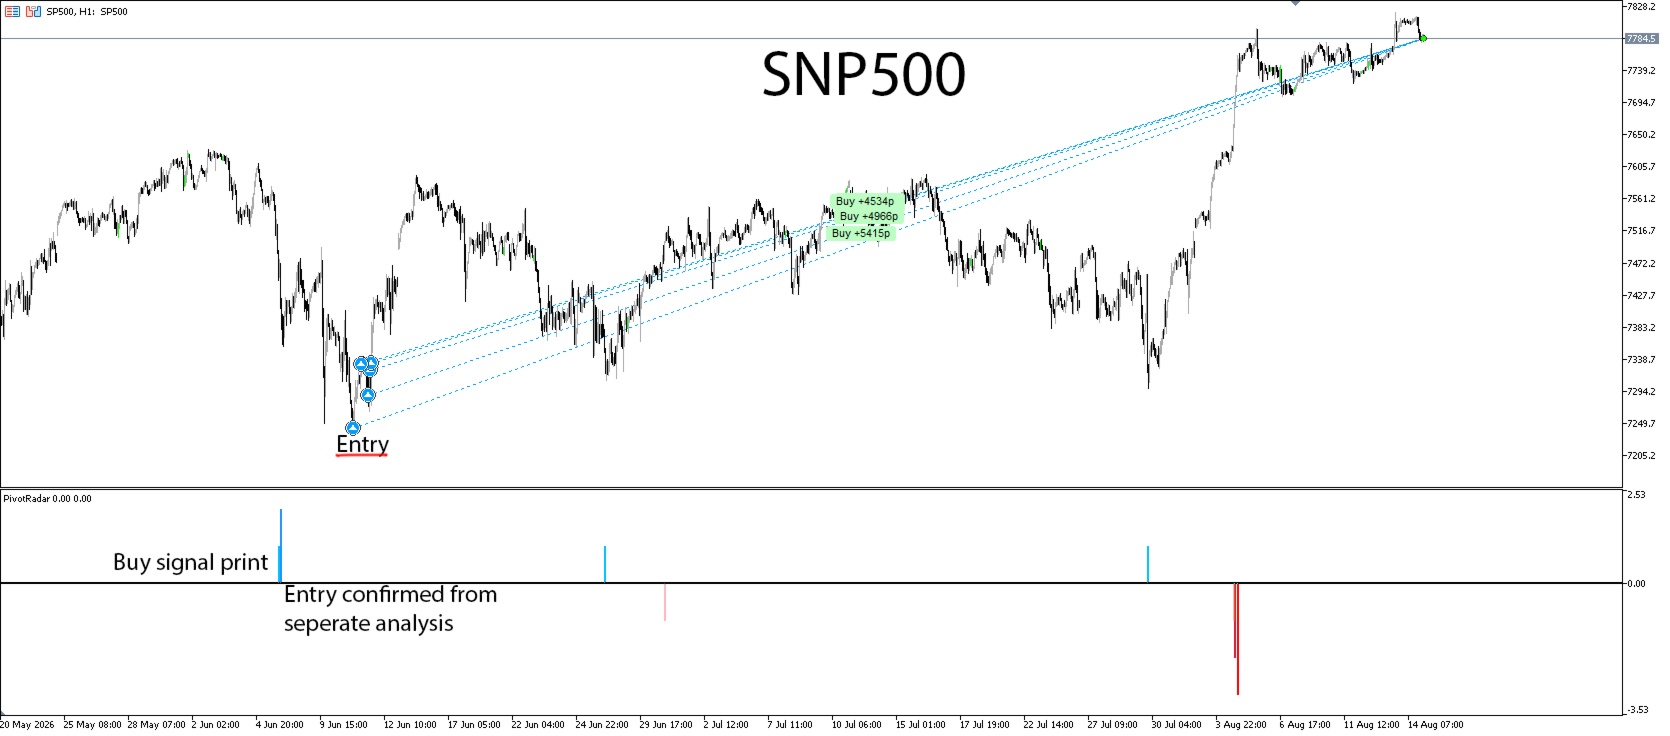
PivotRadar

How it works
A fresh read, every week. At the start of each trading week, PivotRadar re-anchors its zones to that week's opening structure. Nothing carries over stale from the week before — every week starts clean.
Three graduated tiers, both directions. As price works deeper into a zone, PivotRadar tracks it through three escalating tiers — a shallow first warning, a stronger mid-level signal, and an extreme-zone alert. This works for both potential upside and downside reversals, tracked independently, so you get a genuine two-sided read on the market rather than a one-directional bias.
Fires once, not on repeat. Each tier only signals the first time it's reached in a given week. You won't get flooded with the same alert firing over and over while price sits in a zone — one clean signal per tier, per week, per direction.
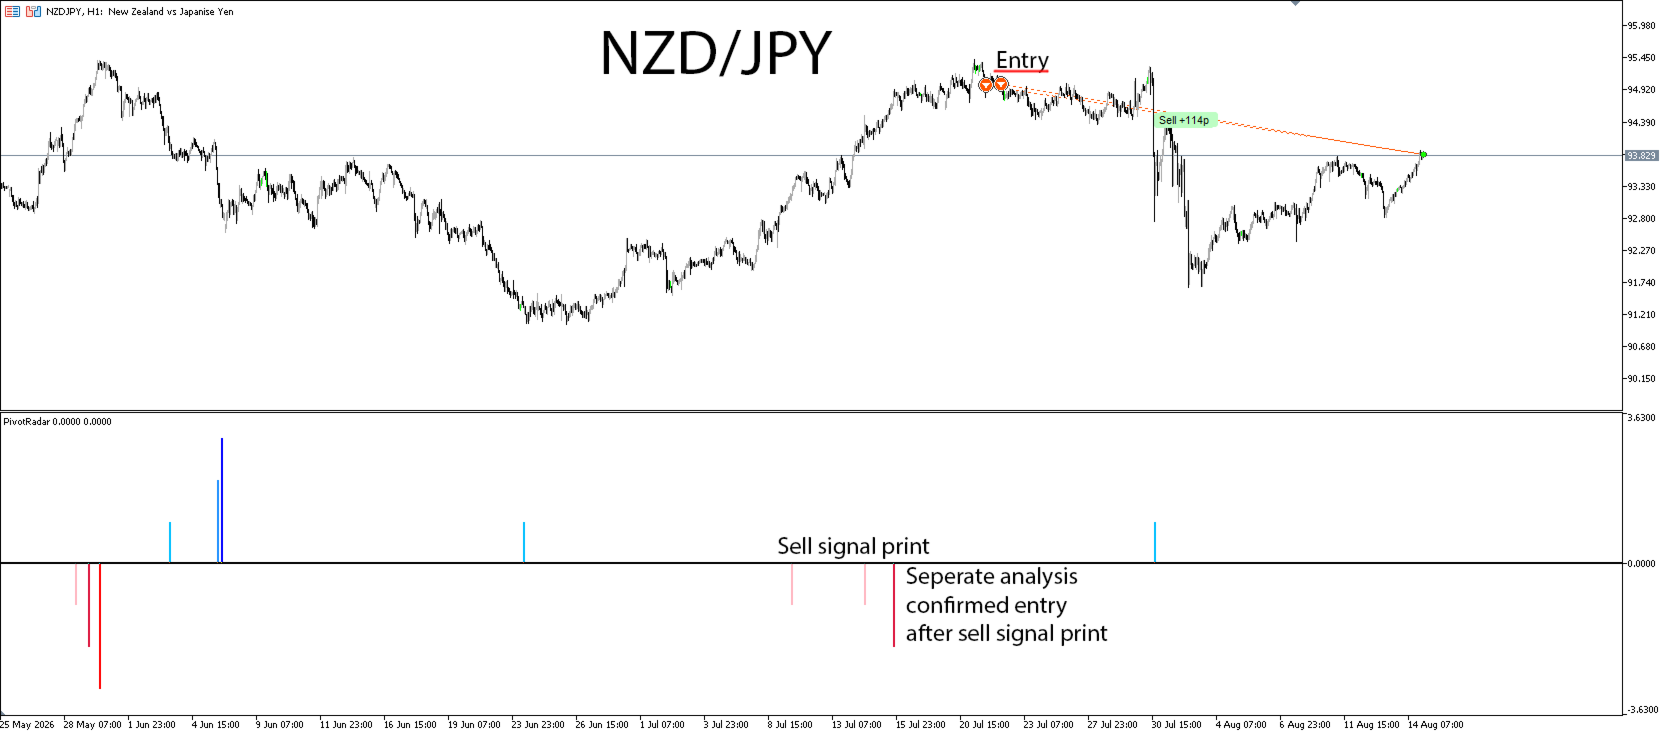
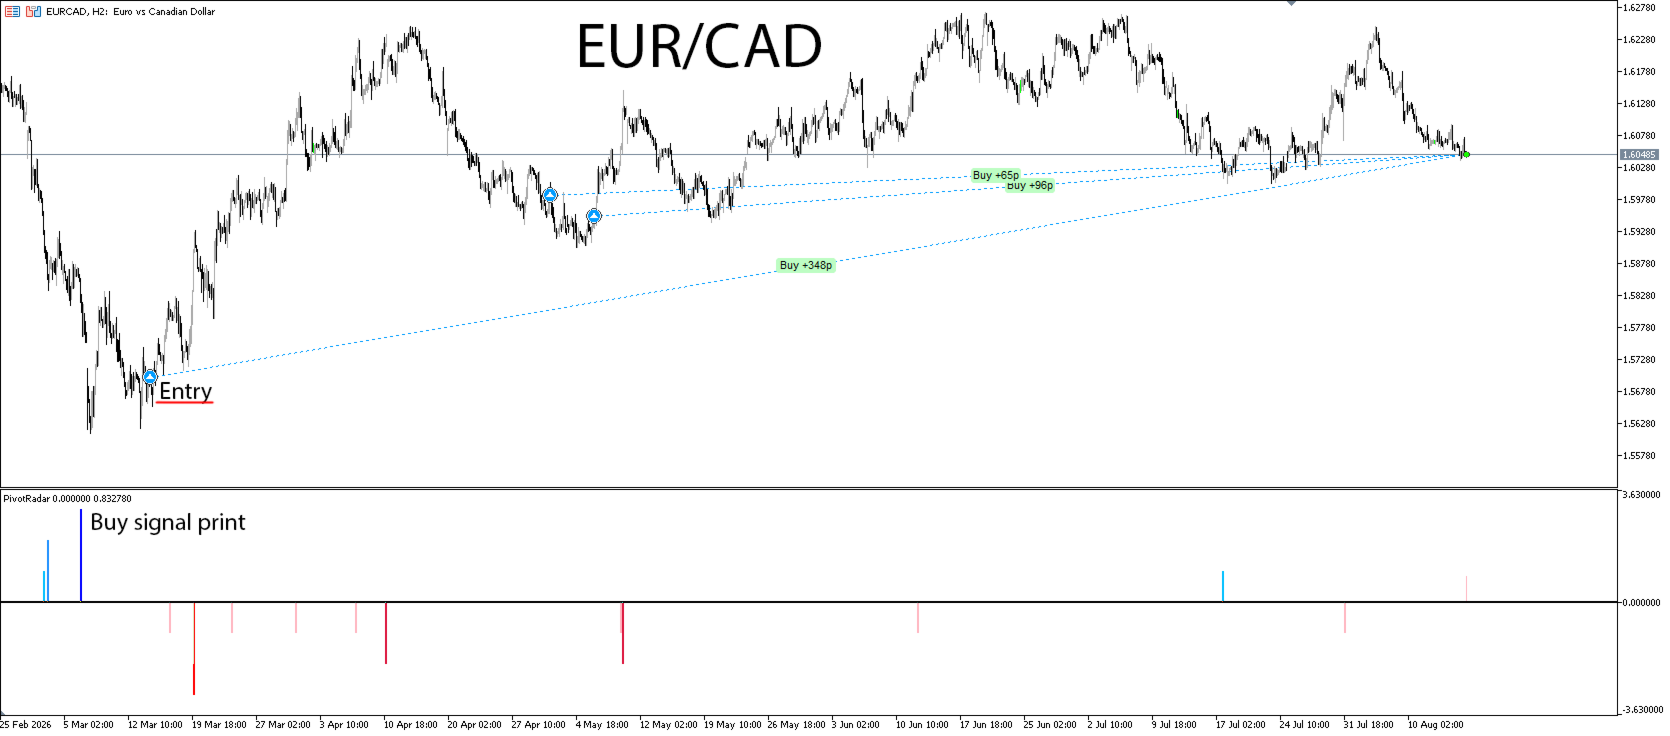
Built for discretion. Signals appear as clean, adjustable-width markers in a dedicated indicator window, color-coded by severity — so at a glance you know not just that something happened, but how significant it was.
What you get
Independent buy-side and sell-side signal tracking, each with its own three-tier escalation
Fully adjustable signal colors, so it fits whatever chart theme you already use
Adjustable signal width and direction (flip either side up or down to suit your layout)
Built with forex and indices in mind, and works on other instruments too — futures, stocks, ETFs, and beyond — provided you manually adjust the settings to fit that instrument's own price behavior (see "Honest limitations" below)
Configurable week-start day, for traders whose trading week doesn't begin Monday
A dedicated, uncluttered signal window that stays out of your way until it has something to say
How traders use it
PivotRadar isn't a standalone "buy here, sell here" system, and we won't pretend it is. It's a structural warning layer — a way to know, without staring at the chart all week, that price has worked its way into a zone worth paying attention to. Most traders use it alongside their own confirmation tools: price action, a trend filter, or their own support/resistance analysis. Think of it as the thing that taps you on the shoulder and says "look here now" — not the thing that makes the decision for you.
The three-tier structure exists because not every touch of a zone is equally significant. A shallow first-tier signal might just be noise inside a broader trend. A third-tier extreme signal is a genuinely rare, high-conviction event worth real attention. PivotRadar lets you calibrate how seriously to take each one, rather than treating every alert the same.
This is not a scalping tool. Because zones reset weekly and each tier only fires once, PivotRadar isn't going to hand you a stream of signals throughout the day, every day — if you're in and out of the market on a minute-by-minute basis, this isn't built for that rhythm. It's designed with swing and positional trading in mind, where a handful of well-placed weekly signals is the point, not a limitation. That said, shorter-term opportunities can still be taken when a signal does occur — plenty of traders will see a tier fire and use it as the trigger for a faster-turnaround trade — but always in conjunction with your own methods and analysis, not as a standalone entry signal on its own.
Reading a signal in context
PivotRadar tells you where price has reached, not what kind of move got it there — that second part is on you, and it's the difference between using this tool well and using it badly.
The tool is at its most powerful after price has already made an extended move — not at the start of one. A buy signal that prints after a selloff off the weekly highs is a genuinely different situation than a buy signal that prints while price is in the middle of a steep, established downtrend. Both can technically trigger the same tier — PivotRadar only measures distance from the weekly anchor, not the character of the trend that got price there. Telling those two situations apart is exactly the "your own judgment about the broader trend" piece we mean when we say to use this alongside your own analysis, not instead of it.
The pattern to look for: after an extended rally, a pulldown into the zone can produce a legitimate buy signal — you're watching a pullback inside strength, not a fresh breakdown. The mirror is true for sells: after an extended decline, a bounce into the zone can produce a legitimate sell signal — a rally inside weakness, not the start of a new uptrend. In both cases, the signal means more because it's happening against a move that's already run its course, not at the front edge of a fresh one.
What this tool is not for: treating every buy signal as a reason to immediately expect (or chase) a sell signal shortly after, or flipping straight from a long to a short the moment the opposite side fires. A signal on one side doesn't cancel or predict a signal on the other — read each one in its own trend context, not as a ping-pong pair.
Honest limitations
No indicator predicts the market, and we're not going to claim this one does. PivotRadar tells you where price has moved to relative to its own weekly structure — it doesn't know why, and it doesn't manage your risk for you. Use it with a stop loss. Use it with your own judgment about the broader trend.
PivotRadar is built and tuned with forex and indices in mind — that's where its default settings are calibrated to behave well out of the box. It works on other instruments too, including futures, stocks, and ETFs, but every market moves differently, and the defaults won't automatically fit an instrument they weren't built around. If you're running this on anything outside forex and indices, plan to manually adjust the relevant settings to match that instrument's own price behavior before trusting it — and backtest on your own instruments and timeframes before trading it with size, since behavior genuinely varies across different markets' volatility profiles.


SETTINGS

PivotRadar — Settings Guide

A quick reference for what each setting does. Everything here can be adjusted from the Inputs.

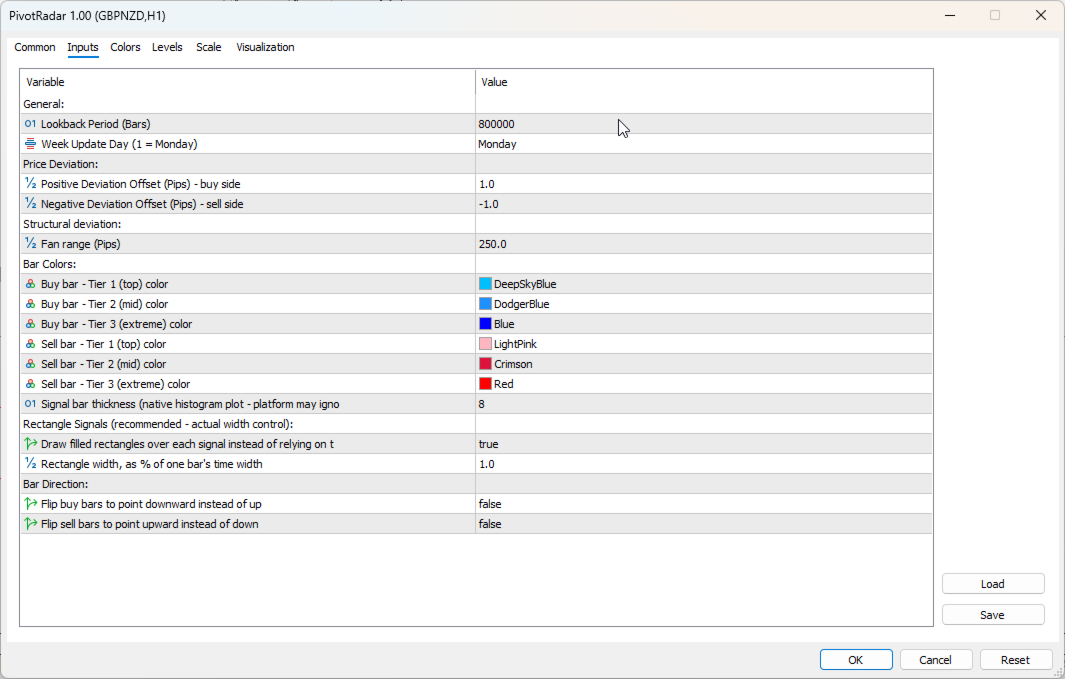
Lookback Period

How far back PivotRadar scans, in bars, when it first loads on a chart — this is what lets it rebuild every past weekly zone and signal across your available chart history, not just what happens from today forward.

Default: 800,000 bars — deep enough to cover essentially any amount of history your broker provides.

When to touch it: Rarely. Lower it only if you're on a very long history chart and want a faster initial load, and don't care about seeing older signals.

Week Update Day

Sets which day of the week PivotRadar treats as the start of a new cycle — this is the moment both the buy-side and sell-side zones reset fresh for the week ahead.

Default: Monday.

When to touch it: If your instrument's trading week effectively starts on a different day in your broker's server time, or you simply prefer to align the reset to a different day for your own planning.

Price Deviation

Two settings — one for the buy side, one for the sell side — that control how closely the tool's internal reference point tracks price. This is one of two settings governing how sensitive PivotRadar is before anything can be considered for a signal.

Default: 1 pip on both sides.

When to touch it: Advanced use only. This is a core sensitivity setting, not a cosmetic one — test any change thoroughly on your own instrument and timeframe before trusting it, ideally in the Strategy Tester before going live with it.

Fan Range

Sets how wide a zone PivotRadar watches around each week's anchor point, in pips. This is the second core sensitivity setting, and it's the one most likely to need adjusting per instrument.

Default: 250 pips.

When to touch it: This is the setting to tune first if you move PivotRadar to a different instrument. Every market has its own natural weekly range — a fast-moving pair or index can blow through a zone sized for a calmer one, while that same zone might be nearly unreachable on something slower. There's no universal right number here; back-test on your specific instrument before committing to a new value.

Bar Tiers

Controls the appearance of the three severity tiers on each side — Tier 1 (shallow), Tier 2 (mid), Tier 3 (extreme) — independently for buy and sell. Includes color per tier, overall bar width, and (recommended) the rectangle-signal width percentage, which gives more reliable thickness control than the native bar width setting alone.

Default: Light-to-dark blue for buy (shallow to extreme), light-to-dark red for sell.

When to touch it: Entirely cosmetic — adjust freely to match your chart theme. The tier structure itself (which signal counts as which severity) doesn't change; only how it looks does.

Bar Direction

Two on/off switches that flip which way each side's bars point. By default, buy signals point upward and sell signals point downward.

When to touch it: Personal preference only — some traders prefer both sides pointing the same direction, or the reverse of the default layout. Purely visual; has no effect on when or why a signal fires.


おすすめのプロダクト
FiboMaster Pro — Automatic Fibonacci with Entry, SL & TP Automatic swing detection and Fibonacci levels with entry, stop loss, and take profit zones, drawn on any instrument and timeframe. FiboMaster Pro automatically detects the most recent swing high and swing low on your chart and draws the full Fibonacci retracement along with reference entry, stop loss, and two take profit levels — no manual drawing required. HOW IT WORKS The indicator scans the last N candles (configurable), identifies the
MetaTrader 5用スマートピボットポイント — スマートな取引のための明確なレベル スマートピボットポイントは、MetaTrader 5用のプロフェッショナルインジケーターです。チャート上に主要な取引レベルを自動計算し、表示します。混沌とした価格変動を、明確な構造化されたマップに変換し、サポート、レジスタンス、価格バランス、そして潜在的なターゲットゾーンをハイライトします。明瞭性を重視するトレーダーのために設計されたこのツールは、FX、仮想通貨(ビットコイン、イーサリアム)、株価指数、株式、コモディティ(XAUUSD)など、あらゆる市場で機能します。 このインジケーターは、計算時間を節約し、分析に客観性をもたらす、信頼できる分析アシスタントです。市場シグナルを提供したり、代わりに意思決定を行うわけではありませんが、情報に基づいた独自の取引判断のための高品質な情報基盤を提供します。 主な機能とメリット すぐに使える価格座標システム:もう手動でレベルを描く必要はありません。中心レベル(バランス)、サポート、レジスタンス、買いターゲット、売りターゲットの5本の明確なラインがチャ
Fibonacci Pullback EA
Rodrigo Alejandro Stemann Henriquez
Fibonacci Pullback EA detects the latest valid swing via symmetric pivots and projects a configurable Fibonacci level across that range. When the previous closed candle wicks into that level and confirms on close , the EA places an order with SL at the swing extreme plus a points buffer , and TP at the opposite swing extreme. Designed originally for EURUSD M30 and USDJPY M30 , yet fully configurable. Signal logic Determines the latest bearish or bullish swing using symmetric pivots. Computes a F
Liquidity Map  Overview The Liquidity Map indicator is an advanced visualization tool based on ICT Smart Money Concepts . It automatically identifies daily Buy Zones , Sell Zones , and Liquidity Levels , showing where price is likely to reverse or continue based on institutional order flow. It calculates key levels from the daily session — such as the previous day’s high, low, and midpoint — then derives a premium (sell bias) and discount (buy bias) structure. When price trades into these mapped
Simple EA with 1 SMA and Fibonacci. The Expertadvisor opens positions in the direction of the trend when price levels have exceeded or fallen below the Fibonacci levels. It depends on the market in question and which parameters to use. The EA is programmed in such a way that optimization runs consume little time. A news filter and filter by day of the week are built in.
Mogalef Bands — Dynamic Range Structure & Target Zones (MT5) Mogalef Bands is a visual market-structure indicator that models price as a dynamic range that shifts in stages. Instead of relying on isolated “signals”, it provides contextual levels to: identify where price is currently “working” (operating zone), locate potential extension areas (targets), and filter market noise through a non-impulsive, stable update logic (with inertia). It is designed for discretionary traders who want clear lev
HenGann
Ehsan Kariminasab
Hengann Sq, using artificial intelligence, mathematical algorithms, Fibonacci, 9 Gann and Fibonacci square strategy, which enables us to have win rate of 200% profit per month. Initial investment for minimum capital of $100 to $1000, you be able to adjust the volume, date, hour, day and profit limit. adjustable profit limit in both buy and sell positions. Able to place orders in all time frames from 5 minutes to a week. further adjustment enables you to open the position according your desir
Automatically plots the 'Golden Fibonacci Ratio’ between the High and Low of the previous day... ...Highs and Lows are great Support and Resistance zones. Breakouts of Fibonacci levels are key points for entry and exit of trades. Pink lines indicate that the previous day's Candle closed lower. Blue colored lines indicate that the previous day's Candle closed higher.
Indicador Para Opções Binarias. Indicator for Binary Options Usa dois gales. Instalar em mt5 Esse indicador é para ser usado no tempo de vela de 5 minutos e em M5. Este também funciona em M1, porém é mais eficiente em M5. Só descompactar e copiar os arquivos na pasta de dados do seu MT5. Arquivos indicator na pasta MQL5 - Indicator. Baixe também a Media Movel totalmente gratis: https://www.mql5.com/pt/market/product/50400 Esse Indicador é para a próxima vela. Apareceu a seta, só aguardar a próx
Risk Calculator MT5
Manuel Guillermo Sanchez Castro
Este Experto Asesor (EA) es un Centro de Control y Calculadora de Gestión de Riesgo Avanzada en Tiempo Real para MetaTrader 5. Está diseñado principalmente para traders de índices bursátiles (como el US30, NAS100), materias primas y Forex que necesitan ejecutar operaciones con precisión milimétrica, gestionar el riesgo de forma automatizada y proteger sus cuentas (especialmente útil para pasar y mantener cuentas de empresas de fondeo o Prop Firms ). A continuación, te detallo para qué sirve ca
mql4 version:  https://www.mql5.com/en/market/product/44606   Simple indicator to calculate profit on fibonacci retracement levels with fixed lot size, or calculate lot size on fibonacci levels with fixed profit. Add to chart and move trend line to set the fibonacci retracement levels. Works similar as default fibonacci retracement line study in Metatrader. Inputs Fixed  - select what value will be fix, lot or profit Fixed value  - value that will be fix on all levels Levels  - levels for which
概要 外国為替や金融市場では、迅速な反応と正確な意思決定が非常に重要です。しかし、標準のMetaTrader 5端末は最小でも1分のチャートしかサポートしておらず、トレーダーが市場の変動に敏感であることを制限しています。この問題を解決するために、 秒単位チャートキャンドルインジケーター を導入しました。このインジケーターを使用すれば、1秒から30秒の市場の動向をサブチャートで簡単に表示・分析できます。 主な機能 複数の秒単位タイムフレームのサポート :このインジケーターは、以下のタイムフレームを選択でき、さまざまな取引戦略に対応します: S1 : 1秒 S2 : 2秒 S3 : 3秒 S4 : 4秒 S5 : 5秒 S10 : 10秒 S15 : 15秒 S20 : 20秒 S30 : 30秒 リアルタイム更新 :秒単位チャートはリアルタイムで更新され、各瞬間に最新の市場情報を提供します。これにより、迅速な取引判断が可能になります。 ユーザーフレンドリーなインターフェース :インジケーターはサブチャートに表示され、直感的で使いやすいです。異なるタイムフレームに素早く切り替えて市場を迅速
UNIVERSAL RISK TRADE MANAGER MT5 Control Your Risk. Protect Your Capital. Trade with Confidence. Successful trading is not only about finding the right entry. It is about controlling how much you can lose when the market moves against you. Universal Risk Trade Manager MT5 is a professional risk-management and trade-execution assistant designed to calculate position sizes, protect trading capital, and manage open trades directly from a clear, easy-to-use chart panel. Whether you trade Forex, Gold
Double Fractal Entry Bot trades automatically using fractal breakouts or rebounds. It detects precise entry points, places SL and TP based on market structure, and includes logic to manage risk and avoid false signals. Simple, smart, and powerful. This product is also available for MetaTrader 4 =>  https://www.mql5.com/en/market/product/143609 Double Fractal Entry Bot is an intelligent trading robot based on the proven logic of the Double Fractal Entry indicator. It analyzes price using upper a
Investment Philosophy Master Dow Jones EA is a high-precision algorithmic trading system specifically engineered for the Dow Jones Industrial Average (DJ30/US30) . Unlike generic trading systems, this algorithm exploits the structural bullish bias inherent in the top 30 U.S. blue-chip companies by operating exclusively on the Long Side . This specialization significantly reduces exposure to erratic short-side volatility and aligns the strategy with long-term institutional capital flows. Strategy
TradeManagerRR Visualizer MT5   は、トレーダーがチャート上で利益確定(TP)および損切り(SL)レベルを簡単に視覚化できるように設計されたトレード管理ツールです。この初期バージョンは、SLおよびTPゾーンとエントリープライスを表示するシンプルなグラフィカル表現を提供します。現在のバージョンは、グラフ上でSLおよびTPゾーンを図形として視覚化することにのみ焦点を当てています。 現在のバージョンの特徴: SLおよびTPゾーンの表示:   カスタマイズ可能な色で、ストップロスとテイクプロフィットレベルのクリアな視覚化を提供します。 移動可能なエントリープライス:   チャート上でエントリープライスを移動させることで、SLおよびTPレベルの反応を見ることができます。 リスクリワード比の計算:   定義されたレベルに基づいたリスクリワード比の動的表示。 使用方法: エントリープライスの設定:   チャートをクリックしてエントリープライスを設定します。 SLおよびTPレベルの調整:   SLおよびTPゾーンを移動させて、リスクとリターンのレベルを調整します。 ゾーン
Swing Master EA
Ihor Otkydach
4.39 (79)
すべてのお客様への特典: このボットをご購入いただいたお客様には、 GRABBER BOT をプレゼントいたします。本キャンペーンは期間限定です。お早めにご利用ください! 最強のEAを紹介します!これは私の手動トレードシステム「 Algo Pumping 」をベースにして作り上げたものです。 このストラテジーを徹底的に磨き上げ、重要なアップデート、フィルター、テクノロジーをぶち込み、ついにリリースすることになりました。このEAは: 高度なAlgo Pumping Swing Tradingアルゴリズムでマーケットを攻めます 資金を守るためにしっかりStop Lossを設定 「Prop Firmチャレンジ」にも「個人トレード」にもバッチリ対応 マーチンゲールも重いナンピンも使わず、リスク管理はスマートに M15タイムフレームで稼働(今後H1とH4対応も予定) 15通貨ペアを同時に運用:AUDCAD、AUDCHF、AUDUSD、AUDSGD、CADCHF、EURGBP、EURNZD、EURUSD、GBPAUD、GBPCAD、GBPCHF、GBPUSD、NZDUSD、USDCAD、USDC
FibonacciPRO
Antonio Gutemberg Frota
Fibonacci Pro Fibonacci Pro is an automatic Fibonacci indicator for MetaTrader 5 designed to identify the current market movement and draw clean retracement and extension levels directly on the chart. It detects the relevant swing high and swing low of the active move, then plots key Fibonacci levels with clear labels, making it easier to analyze pullbacks, continuation zones, and potential reaction areas. Main Features Automatic Fibonacci drawing based on the current market movement Detects swi
FREE
"Manual channel drawing? Not anymore. Let the market structure reveal itself automatically." "Track long-term price zones 24/7, in real-time." Real Trader Pain Points Identifying pivot points manually takes   huge time   and   effort Difficult to adapt to   high volatility   and pinpoint   reliable channels Copy Ideas "Markets never sleep. Why should your analysis stop?" "Dozens of assets a day—how do you keep up?" Core Claim AutoChannels   automatically reads market structure , reducin
Fibonacci MT5 は、フィボナッチレベルに基づく自動取引のエキスパートアドバイザーです。指定されたバー数で価格の最安値と最高値を判定し、フィボナッチレベルを描画し、現在価格が選択されたレベルに達すると取引を開始します。EA はトレンド方向、または逆張りで取引することが可能で、設定パラメータに従います。また、決済レベル、リスク管理、時間フィルターも設定できます。 特徴 ローカル極端の自動検出およびフィボナッチのレベルの構造。   フィボナッチレベルに基づいて取引を開始および終了するためのカスタマイズ可能な条件。  柔軟なリスク管理オプション:損失を停止し、利益を得る、注文の量と数を制限します。 一般設定 Lot Size:取引開始ロット数。 Max Open Buy Orders:最大買いポジション数。 Max Open Sell Orders:最大売りポジション数。 Magic Number:EA取引の一意の識別番号。 リスク管理 Use Stop Loss:ストップロス有効化。 Stop Loss (pips):ストップロス幅(pips)。 Use Take Pro
NEXA Donchian Break 1. 製品概要 NEXA Donchian Break は、 ドンチャン・チャネルを基に 価格ブレイクアウト領域 を検出し、 追加のテクニカル条件が満たされた場合にのみ取引を行う 自動売買エキスパートアドバイザー(Expert Advisor)です。 本製品は 学習および研究目的で無料配布 されており、 パラメータ設定を通じて ブレイクアウトロジック、トレンドフィルター、 ストップロス/テイクプロフィット構造の関係を理解することを目的としています。 本製品は いかなる取引結果も保証または約束するものではありません 。 実際の結果は、市場環境、ブローカー条件、 およびユーザー設定によって異なります。 2. 戦略構造 本 EA には、2 つの戦略モードが用意されています。 戦略モード V1 ドンチャン・チャネルのブレイクアウト検出 Momentum インジケーターによる方向確認 ADX によるトレンド強度フィルター 初期ストップロスは ATR ベース 条件達成後、構造的(スイング)ストップロスへ切り替え可能 戦略モード V2 ドンチャン・チャ
FREE
このEAは,Meta Trader 5プラットフォーム向けのシンプルな自動取引システムです.パラボリックSARを用いて,市場のトレンドを見極めてロットサイズを自動的に調整し,コツコツと利益を積み上げていきます. 主な特徴 ロットサイズの調整にマーチンゲール法を用いません. 外国為替市場閉場前にポジションを持っている場合,そのポジションは週末に持ち越しされます. このEAは複数のポジションを同時に持つことを前提としているため,利用しているブローカーのMT5口座がヘッジングシステムタイプであることを確認してください. どの執行方式・フィルポリシーであっても対応できる回路をEAに組み込んでいます. 注文価格がストップレベルに違反していた場合には自動調整が行われます. 推奨設定 シンボル:USDJPY タイムフレーム:M5(5分足チャート) デポジット:最低1,000ドル(100,000円)を推奨します すべてのパラメータはデフォルト値に設定することを推奨します.TradeVolumeは証拠金に応じて増やすことができますが,その分リスクも高まります.TakeProfitとStopLoss
Bar Sequential
Maximiliano Frisione Figueroa
This indicator can help you clearly identify trend changes in both bullish and bearish markets. The indicator compares the closing price of the last candle with the closing price of the candle "X" periods ago (input parameter). In an uptrend, an initial number '1' is plotted if a candle closes higher than the closing of a candle "X" periods ago. In a downtrend, an initial number '1' is plotted if a candle closes below the closing of a candle "X" periods ago. Subsequent numbers are plotted when e
FREE
BALOGUN SMC ELITE — Professional Smart Money Concepts Indicator KEY FEATURES: Strict BUY/SELL Alternation — Only 1 BUY followed by 1 SELL (no signal spam) Non-Repainting Signals — Signals confirmed on closed bars only Zone-Limited NO TRADE Markers — Clear visual zones showing when NOT to trade Multi-Factor Confluence Scoring — 0-100% quality score per setup Professional Dashboard — Real-time trend, confluence, and signal status Multi-Channel Alerts — Popup, Push, Email, and S
Phoenix Fibonacci
Nigel Nii Darku Narnor Darko
This indicator, often referred to as an Auto-Fibonacci Retracement Tool, is a technical analysis script designed to identify potential support and resistance levels based on the "Golden Ratio." Unlike the standard manual tool, this version automatically scans a specific lookback period (e.g., the last 100 candles) to find the absolute Swing High and Swing Low, drawing the levels for you in real-time. How to Use it for Trading 1. Entering a BUY Trade (Long) You use the Fibonacci levels to find "
FREE
HTF Open Markers + ICT Silver Bullet Zones — Usage & Strategy Guide What it draws Session 1 / Session 2 lines : vertical lines at the open of every bar on two independently configurable higher timeframes (defaults: H4 and D1), including a projected line for the rest of today's not-yet-opened bars on sub-daily timeframes, so you can see where the next candle will open before it happens. ICT Silver Bullet zones : shaded rectangles over the three classic ICT kill-zone windows, converted from New Yo
FREE
PREDATOR PULSE AI TRADER Premium · By Prometheus Neural Systems Most trading indicators are built once, calibrated on historical data, and left to run. They don't adapt. They don't learn. When the market changes — and it always does — they keep firing the same signals based on conditions that no longer exist. Predator Pulse was built on a different idea. Two Engines Working Together The foundation is a 60-feature institutional microstructure engine. Every bar, it analyses sixty distinct aspects
ENGLISH VERSION (for MQL5 Market) Product Description: RSI Trend & Volatility Dashboard (Multi-Timeframe Filter) This professional dashboard provides traders with an ultimate market overview inside a single chart. It continuously monitors the trend direction across 5 timeframes simultaneously: M5, M15, M30, H1, and D1 [MQL5]. No more tedious chart switching or multi-window clutter – see everything from quick scalping moves to global institutional daily trends in real-time [MQL5]. Key Adva
Harness the power of the universe's most perfect number. Golden Retracement is an Expert Advisor meticulously engineered to identify and trade precise reversals at key Fibonacci retracement levels. It automatically detects significant market swings and calculates the golden ratio levels (38.2%, 50.0%, 61.8%), waiting for the price to "bounce" with a powerful confirmation. This bot brings mathematical elegance and disciplined execution to your trading, helping you capitalize on deep corrections a
QTS Gold Guardian AI ニューラルネットワークを搭載した機関投資家レベルのゴールドスキャルパー。スマートヘッジ、エクイティ保護、ボラティリティ適応機能を搭載。危険なマーチンゲール法は使用しません。 QTS Gold Guardian AIは、XAUUSD(ゴールド)スキャルピングの究極のソリューションであり、ボラティリティの高い市場環境にも対応できるよう設計されています。口座を破綻させる従来のスキャルパーとは異なり、QTSはまず元本の保全に重点を置いています。 主な機能: ニューラルネットワークロジック:高度なロジックを用いて、M5/H1の時間枠でミクロトレンドを検出します。 スマートリカバリー:スマートヘッジ係数を用いて、証拠金に負担をかけずに不利な取引を中和します。 エクイティガーディアン:ハードストップメカニズムを内蔵。ドローダウンが危機的な水準に達した場合、EAは取引を一時停止して口座を保護します(プロップ取引会社にとって非常に重要です!)。 ニュースフィルター:影響力の大きいニュースが配信されている時間帯には、自動的に取引を回避します。
このプロダクトを購入した人は以下も購入しています
UZFX {SSS} スキャルピング・スマートシグナル v4.0 MT5は、変動の激しい市場において正確かつリアルタイムのシグナルを求めるスキャルパー、デイトレーダー、スイングトレーダー向けに設計された、リペイントのない高性能な取引インジケーターです。(UZFX-LABS)によって開発されたこのインジケーターは、価格行動分析、トレンド確認、スマートフィルタリングを組み合わせることで、すべての通貨ペアおよび時間軸において、高確率の売買シグナル、警告シグナル、トレンド継続の機会を生成します。 トレードの判断に迷うのはもうやめましょう。明確さ、正確さ、そして規律ある市場執行を求めるトレーダーのために設計された、体系的なシグナルシステムに従い始めましょう。 私のおすすめ* 最適な時間足:15分足以上。 {H1} が私のお気に入りです。そして、その成果は驚異的です…!! 主な機能の更新 • 自動売買シグナル検出 • 高度な反転認識ロジック • 市場反転の可能性に先立つ早期警告シグナル • トレンド継続確認シグナル • エントリー、ストップロス、TP1、TP2、TP3レベルを備えた組み込み型
ARICoin is a powerful trading companion designed to generate high-probability entry signals with dynamic TP/SL/DP levels based on volatility. Built-in performance tracking shows win/loss stats, PP1/PP2 hits, and success rates all updated live. Key Features: Buy/Sell signals with adaptive volatility bands Real-time TP/SL/DP levels based on ATR Built-in MA Filter with optional ATR/StdDev volatility Performance stats panel (Success, Profit/Loss, PP1/PP2) Alerts via popup, sound, push, or email Cust
PrimeScalping is a powerful trading companion designed to generate high-probability entry signals with dynamic TP/SL/DP levels based on volatility. Built-in performance tracking shows win/loss stats, PP1/PP2 hits, and success rates — all updated live. Key Features: Buy/Sell signals with adaptive volatility bands Real-time TP/SL/DP levels based on ATR Built-in MA Filter with optional ATR/StdDev volatility Performance stats panel (Success, Profit/Loss, PP1/PP2) Alerts via popup, sound, push, or e
note: this indicator is for METATRADER4, if you want the version for METATRADER5 this is the link:  https://www.mql5.com/it/market/product/108106 TRENDMAESTRO ver 2.5 TRENDMAESTRO recognizes a new TREND from the start, he never makes mistakes. The certainty of identifying a new TREND is priceless. DESCRIPTION TRENDMAESTRO identifies a new TREND in the bud, this indicator examines the volatility, volumes and momentum to identify the moment in which there is an explosion of one or more of these da
OrderFlow Absorption – MT5用プロフェッショナル・デルタ&アブソープションシグナルインジケーター OrderFlow Absorptionで本物のオーダーフロー分析の力を解き放ちましょう。MetaTrader 5向けの究極のデルタヒストグラム&アブソープションシグナルインジケーターです。あらゆる価格変動の裏側で何が起きているのかを知りたいトレーダーのために設計されており、市場を動かす隠れた買い/売り圧力や吸収イベントを明らかにします。 特徴 デルタヒストグラムの可視化:   買い圧力・売り圧力を色分けされたヒストグラムで即座に表示。 アブソープションシグナル検出:   高度なロジックで強気・弱気の吸収イベントを特定し、反転の兆しを早期に通知。 チャートマーカー:   吸収シグナルをチャート上に直接マークし、視覚的に分かりやすく表示。 ポップアップアラート:   新しい吸収シグナルが出現した際にリアルタイムで通知。 カスタマイズ可能な閾値:   弱いシグナルを除外し、高確率のセットアップに集中。 リソース管理:   大きなチャートでも高速に動作する効率的な計算。
SmartScalping is a powerful trading companion designed to generate high-probability entry signals with dynamic TP/SL/DP levels based on volatility. Built-in performance tracking shows win/loss stats, PP1/PP2 hits, and success rates — all updated live. Key Features: Buy/Sell signals with adaptive volatility bands Real-time TP/SL/DP levels based on ATR Built-in MA Filter with optional ATR/StdDev volatility Performance stats panel (Success, Profit/Loss, PP1/PP2) Alerts via popup, sound, push, or e
ScalpPoint is a powerful trading companion designed to generate high-probability entry signals with dynamic TP/SL/DP levels based on volatility. Built-in performance tracking shows win/loss stats, PP1/PP2 hits, and success rates — all updated live. Key Features: Buy/Sell signals with adaptive volatility bands Real-time TP/SL/DP levels based on ATR Built-in MA Filter with optional ATR/StdDev volatility Performance stats panel (Success, Profit/Loss, PP1/PP2) Alerts via popup, sound, push, or emai
MasterTrend Indicator for MT5 A powerful trend-following and signal-evaluation tool MasterTrend   is a custom MT5 indicator that combines Moving Averages and ATR-based risk/reward logic to generate clear buy/sell signals. It visualizes dynamic SL/TP levels, evaluates past trade outcomes, and displays win/loss statistics in a clean on-chart panel. Key features include: Buy/Sell signals based on MA crossovers ATR-based SL/TP1/TP2/TP3 levels with visual lines and labels Signal outcome tracking wit
ARIPoint
Temirlan Kdyrkhan
1 (1)
ARIPoint is a powerful trading companion designed to generate high-probability entry signals with dynamic TP/SL/DP levels based on volatility. Built-in performance tracking shows win/loss stats, PP1/PP2 hits, and success rates all updated live. Key Features: Buy/Sell signals with adaptive volatility bands Real-time TP/SL/DP levels based on ATR Built-in MA Filter with optional ATR/StdDev volatility Performance stats panel (Success, Profit/Loss, PP1/PP2) Alerts via popup, sound, push, or email Cu
MasterTrend Indicator for MT5 A powerful trend-following and signal-evaluation tool MasterTrend   is a custom MT5 indicator that combines Moving Averages and ATR-based risk/reward logic to generate clear buy/sell signals. It visualizes dynamic SL/TP levels, evaluates past trade outcomes, and displays win/loss statistics in a clean on-chart panel. Key features include: Buy/Sell signals based on MA crossovers ATR-based SL/TP1/TP2/TP3 levels with visual lines and labels Signal outcome tracking wit
Naked Forex Tweezer Pro Indicator Tweezer Pro Indicator is a pattern recognition indicator for Forex, Stocks, Indices, Futures, Commodities and Cryptos. The standard Tweezer is a two bar pattern. Our enhanced version is a multi-bar pattern. We filter the patterns for you so that you only get the     best and most effective patterns   and ignore the noise. The Tweezer pattern is a simple and effective pattern to trade. The strategy that comes with the Tweezer is based on price action. The Twe
このインジケーターは、市場で 関心が示されたゾーン をハイライトし、その後に 注文の蓄積ゾーン を表示します。 これは、大規模な**板情報(オーダーブック)**のように機能します。 これは、 巨大な資金 のためのインジケーターです。その性能は卓越しています。 市場にどんな関心が存在していても、 必ず目に見えるようになります 。 (これは 完全に再設計され、自動化されたバージョン です。もはや手動分析は必要ありません。) トランザクションスピード(取引速度) は新しい概念のインジケーターで、市場で大口注文が どこに・いつ 集中しているかを示し、それに基づいたチャンスを提供します。 トレンドの変化を 非常に早い段階 で察知することができます。 FXでは「出来高」と呼ばれているものは誤解されています。実際には、これは 時間あたりの価格変動量 です。したがって、正しい名称は トランザクションスピード です。 考え方・行動・分析の仕方すべてが問われます。 分析パラダイムの転換は非常に重要です。 このインジケーターは、FXにおける出来高の考え方を 根本から再定義 し、論理的な形で正確に活用する、
AriX
Temirlan Kdyrkhan
1 (4)
AriX Indicator for MT5 A powerful trend-following and signal-evaluation tool AriX is a custom MT5 indicator that combines Moving Averages and ATR-based risk/reward logic to generate clear buy/sell signals. It visualizes dynamic SL/TP levels, evaluates past trade outcomes, and displays win/loss statistics in a clean on-chart panel. Key features include: Buy/Sell signals based on MA crossovers ATR-based SL/TP1/TP2/TP3 levels with visual lines and labels Signal outcome tracking with real-time stat
相場が本当は何をしているのかを見抜く。   3つの市場フェーズ(収縮・拡張・トレンド)を目の前でライブに捉え、トレンド・フェーズの初期段階でより優れたエントリーを取りましょう   。      当て推量はもう終わり。機関投資家やスマートマネーのように相場を読み始めましょう。   Apex Market Structure Pro(MT5版)は、ノイズを取り除き、あらゆるローソク足の下にある真の構造を見せる高精度のスマートマネー分析ツ   ールです。流動性、構造転換、蓄積ゾーン、トレンドバイアスを、ひとつのクリーンでプロフェッショナルなオーバーレイに集約します。遅行   指標に見切りをつけ、明晰さをもってトレードする準備のできた本気のトレーダーのために作られました。   重要:本インジケーターは Heikin Ashi(平均足)ローソク足での動作を前提に設計されています。使用前にチャートを Heikin Ashi   に設定し、その真価を解き放ってください。分析のすべては Heikin Ashi の価格の流れを軸に構築されています。Apex Market Structure Pr
OmniSync Projection
Antonio-alin Teculescu
5 (1)
Chronos Fractal Engine is an innovative price projection indicator for MetaTrader 5, designed to transform your technical analysis by intelligently identifying and projecting historical price patterns. Built upon an advanced correlation algorithm and the fractal principles of the market, this powerful tool visualizes potential future price movements, giving you a unique edge in your trading decisions. What is Chronos Fractal Engine? At its core, the Chronos Fractal Engine employs a sophisticat
マーケットメーカーのためのツール。 Meravith は次の機能を提供します: すべての時間足を分析し、現在有効なトレンドを表示します。 強気と弱気の出来高が等しくなる流動性ゾーン(出来高均衡)を強調表示します。 異なる時間足のすべての流動性レベルをチャート上に直接表示します。 テキスト形式の市場分析を生成し、参考情報として表示します。 現在のトレンドに基づいて目標値、サポートレベル、ストップロスを計算します。 取引のリスクリワード比を算出します。 口座残高に基づいてポジションサイズを計算し、潜在的な利益を推定します。 また、市場に大きな変化があった場合には警告を表示します。 インジケーターの主要ライン: 強気/弱気の出来高エグゾーストライン ― 目標値として機能します。 市場のトレンドを示すライン。市場が強気か弱気かによって色が変わり、トレンドのサポートとして機能します。主にその色が市場センチメントを示します。 出来高均衡ライン(Eq)。Eq(Volume Equilibrium)ラインはシステムの中核です。これは買い手と売り手の出来高のバランスポイントを表します。市場の流動性を示し
==================================================================== SMC Pro v6.1 APEX AI — XAUUSD Gold Empire MetaTrader 5 インジケーター · Smart Money Concepts · 予測インテリジェンス・エンジン ==================================================================== SMC Pro v6.1 APEX AI は、MetaTrader 5 上の XAUUSD(ゴールド)専用に構築された、プロフェッショナルな Smart Money Concepts インジケーターシステムです。 完全な SMC フレームワーク — Order Blocks、Liquidity sweeps(流動性スイープ)、Fair Value Gaps、Break of Structure、Change of Character — に加え、AI を活用した 8 つの新モジュールを組み合わせ、精密なビ
「 Dynamic Scalper System MT5 」インジケーターは、トレンド波の中でスキャルピング取引を行う手法のために設計されています。 主要通貨ペアと金でテスト済みで、他の取引商品との互換性があります。 トレンドに沿った短期的なポジションオープンのシグナルを提供し、追加の価格変動サポートも提供します。 インジケーターの原理 大きな矢印はトレンドの方向を決定します。 トレンド波の中では、小さな矢印の形でスキャルピングシグナルを生成するアルゴリズムが機能します。 赤い矢印は強気方向、青い矢印は弱気方向です。 トレンドの方向には敏感な価格変動ラインが描かれ、小さな矢印のシグナルと連動します。 シグナルは次のように機能します。適切なタイミングでラインが現れるとエントリーシグナルが形成され、ラインが開いている間はポジションが保持され、完了すると取引が終了します。 推奨される動作時間枠はM1~H4です。 矢印は現在のローソク足に形成され、次のローソク足が開いている場合は、前のローソク足の矢印は再描画されません。 入力パラメータ Trend Wave Period - トレ
VTrende Pro
Andrii Diachenko
5 (1)
VTrende Pro - MTF indicator for trend trading with a display panel for MT5 *** Videos can be translated into any language using subtitles (video language - Russian) Although the signals of the VTrende Pro indicator can be used as signals of a full-fledged trading system, it is recommended to use them in conjunction with the Bill Williams TS. VTrende Pro is an extended version of the VTrende indicator. Difference between Pro version and VTrende: - Time zones - Signal V - signal 1-2 waves -    S
This indicator automatically detects internal & swing market structure, Fibonacci Retracement and Fibo Levels. Features Full internal & swing market structure labeling in real-time Fibonacci Retracement Fibonacci Levels After purchasing the indicator, the full source code is provided, and via indicator buffers it can be easily integrated into your Expert Advisors (EAs) for automated trading strategies.
Euro Escalper — Puro no Kikan Toshi Sukyarupingu Injikeeta Euro Escalper wa, subete no entori de kikan toshi reberu no seido wo motomeru toreedaa no tame ni sekkei sareta kooseinou torihiki injikeeta desu. Gousei Shisuu (Deriv), Forex, oyobi MetaTrader 5 de riyou kanou na subete no shisan de kinoushimasu. Fibonacci beisu no ryuudousei zoon, naizou SuperTrend enjin, oyobi riaru taimu no purofesshonaru dasshubooddo wo kumiawasemasu. Shuyo na Riten Sai Egaki Nashi: Shingou yajirushi wa rousoku ashi
MERAVITH SCANNERは、MetaTrader 5用のプロフェッショナルな金融市場インジケーターで、複数の分析ツールを一つの統合システムにまとめています。独自の出来高加重平均価格(VWAP)手法を使用してすべての計算を自動で行い、主観的な解釈を完全に排除します。 このインジケーターは、すべての資産クラス(FX、株式、指数、商品、暗号通貨)およびM1から月足までのすべての時間軸で動作します。基本原理は「価格は出来高に従う」というものです。MERAVITHは機関投資家の出来高が集中するポイントを特定し、その集中から数学的に正確な価格レベルを導き出します。予測や投機は行わず、計算のみを行います。 MERAVITH SCANNERを使用すると、28の主要FX通貨ペアをすべての時間軸でわずか2~3分でスキャンできます。また、任意の市場をスキャンすることも可能です。例えば、約100銘柄の株式を約10分でスキャンできます。 インジケーターは、消耗レベル、均衡線、偏差、統計レベル、およびターゲット予測を算出します。 チャート要素 Origin Point :すべての計算が始まる起点です。イン
Big Player Range
Thalles Nascimento De Carvalho
5 (3)
BigPlayerRange — MT5向け最強インジケーター BigPlayerRange は、MetaTrader 5 で日経ミニやドル先物などの取引において、 最も効果的なインジケーター と評価されています。大口投資家(機関投資家)の行動を可視化し、高精度なテクニカル分析を可能にします。 どのように機能するのか? BigPlayerRangeは、買い圧力ゾーン(緑ライン)と売り圧力ゾーン(赤ライン)を描画し、価格がその範囲を超えるとトレンド方向への動きを示唆します。 緑のライン上で終値: 買いの勢いが強く、上昇トレンドの可能性。 赤のライン下で終値: 売り圧力が優勢で、下落が予想される。 範囲内での価格: レンジ相場でブレイクを待つ段階。 主なメリット: 機関投資家ゾーンの検出: 大口のエントリーポイントを視覚化。 自動ターゲット計算: 利確ポイントを戦略的に設定。 プルバックの可能性分析: リスク管理に役立つ情報提供。 推奨の使い方: Imbalance DOM Pro と併用してゾーンブレイクを確認。 SwingVolum
プレミアムレベルは、正しい予測の精度が80%を超える独自の指標です。 この指標は、最高のトレーディングスペシャリストによって2か月以上テストされています。 あなたが他のどこにも見つけられない作者の指標! スクリーンショットから、このツールの正確さを自分で確認できます。 1は、1キャンドルの有効期限を持つバイナリーオプションの取引に最適です。 2はすべての通貨ペア、株式、商品、暗号通貨で機能します 手順: 赤い矢印が表示されたらすぐにダウントレードを開き、青い矢印が表示されたら閉じます。青い矢印の後に開くこともできます。 試してテストしてください!推奨設定はデフォルトです! 日足チャートで最高の精度を示します! インディケータは、2600 Pipsの収益性に対して、約10Pipsという非常に小さなマージンを使用します。
SMC Institutional Suite v3.7 Professional Smart Money Concept Indicator for MetaTrader 5 What is New in Version 3.7 - Visual Stability Update This release focuses entirely on one goal: making every zone, label, and line on your chart rock-solid stable. There is no more flickering, no more zones disappearing on a new candle, and no more duplicate drawings. Order Block (OB) zones no longer flicker or disappear. Once drawn, they stay permanently on the chart. Equal Highs and Equal Lows (EQH / EQL)
MATADOR GOLD XAUUSD M5 Scalp Signals for MT5 MATADOR GOLD is a decision-support indicator for MetaTrader 5, designed for traders who analyze short-term Gold movement on the M5 timeframe. The indicator does not open, close, or manage trades automatically. It provides buy and sell signal guidance so the user can make their own trading decisions according to their risk plan, broker conditions, and trade management rules. Main purpose MATADOR GOLD is built to help traders avoid noisy signal flow and
Footprint は、オーダーフロー(Order Flow)と出来高分析のためのインジケーターです。 クラスターレベルでの市場構造の特定、アクティビティの高い主要ゾーンの発見、そして設定ウィンドウを毎回開くことなくチャート上で直接フィルター操作を行うのに役立ちます。 Footprintインジケーターの機能 Bid x Ask、Deltaのクラスターチャート; チャート上のコントロールパネル; フィルター調整用のスライダー; Absorption; Initiative; Stacked Imbalances; Big Trades; dPOC / Dynamic Point of Control; Delta; サイドマーケットプロファイル; 累積デルタ(Cumulative Delta)。 主な利点 高密度のティックフローに対する高速な計算とデータ表示; チャート内管理 — 設定を開くことなく、主要モードとフィルターを直接切り替え可能; 重要な価格レベルとクラスターを強調するためのフィルタリング; シグナルの視覚的ハイライト:吸収、主導権、インバランス、大口取引; 日、週、または現
ZIVA Signal Intelligence
Hassan Abdullah Hassan Al Balushi
ZIVA Signal Intelligence An Adaptive, Modular Market Intelligence System ZIVA Signal Intelligence is not positioned as a conventional trading indicator. It is a fully integrated, proprietary market intelligence system engineered to deliver structured, high-precision interpretation of price behavior within a controlled analytical environment. Developed through an independent architectural approach, ZIVA does not rely on, derive from, or replicate existing indicators. It represents a standalone
First time on MetaTrader, introducing IQ Star Lines - an original Vedic Astrology based indicator. "Millionaires don't use astrology, billionaires do" . - J.P. Morgan, Legendary American financier and banker. Welcome to  the new and updated  IQ Star Lines , the ultimate fusion of ancient planetary harmonic cycles and modern quantitative trading. published for the   first time on Metatrader. This is an indicator built by the developer, who has spent almost 2 decades trading while studying Vedic
+++++++++++++++++++++++++++++++++++++++++++++++++++++++++++++++++++++++++++++++++++++++++++++++++ +++ Link to EURUSD Only Free Version -->  https://www.mql5.com/en/market/product/156904?source=Unknown +++++++++++++++++++++++++++++++++++++++++++++++++++++++++++++++++++++++++++++++++++++++++++++++++ Hallo Trader, This is a traditional GANN & FIBONACCI strategy based on detection of an impulsive move in the opposite direction. This is called a Breakout. At the moment of Breakout, the indicator draw
フィルタ:
レビューなし
レビューに返信