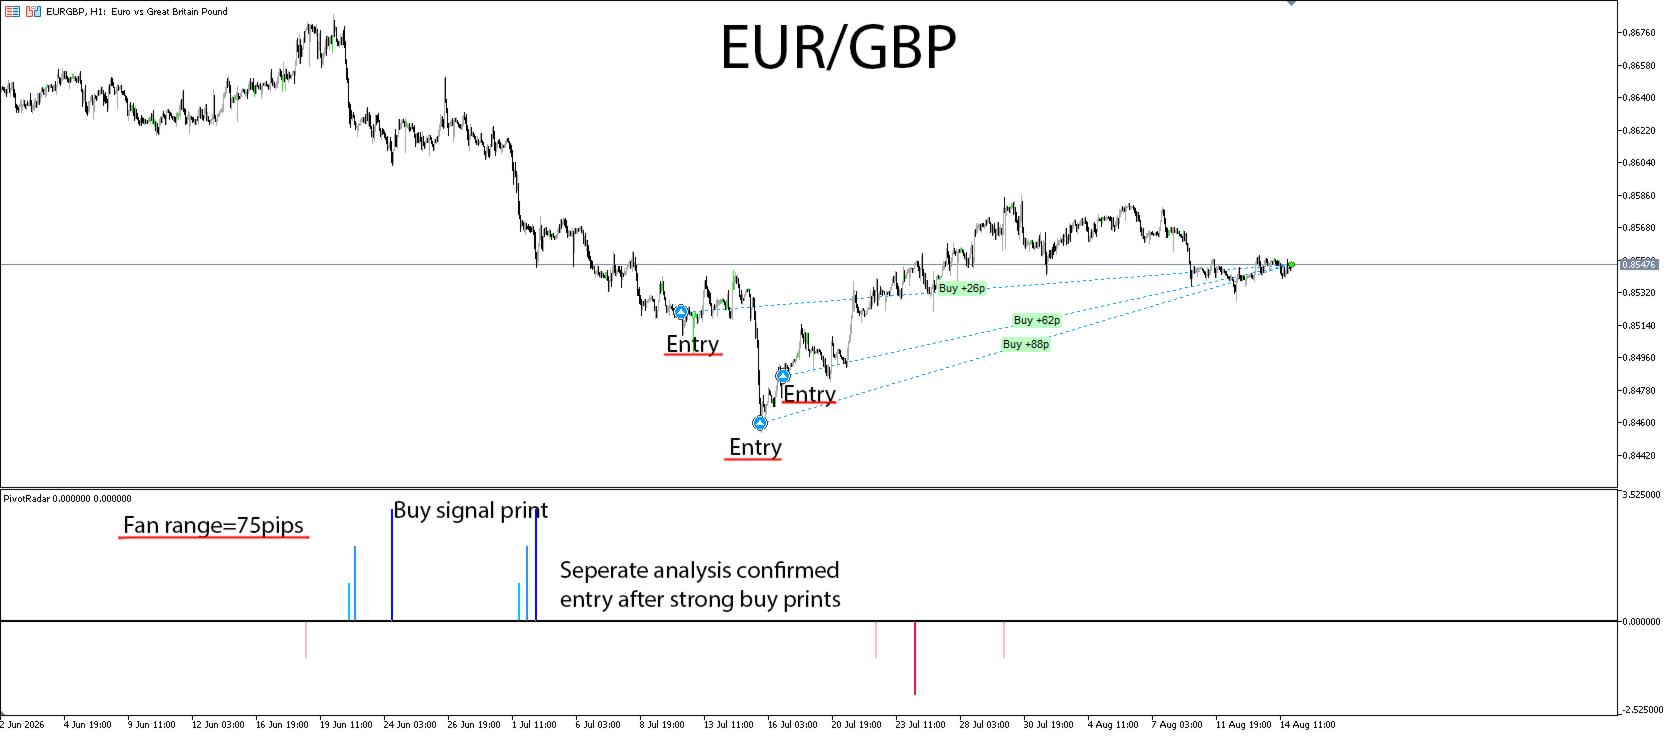
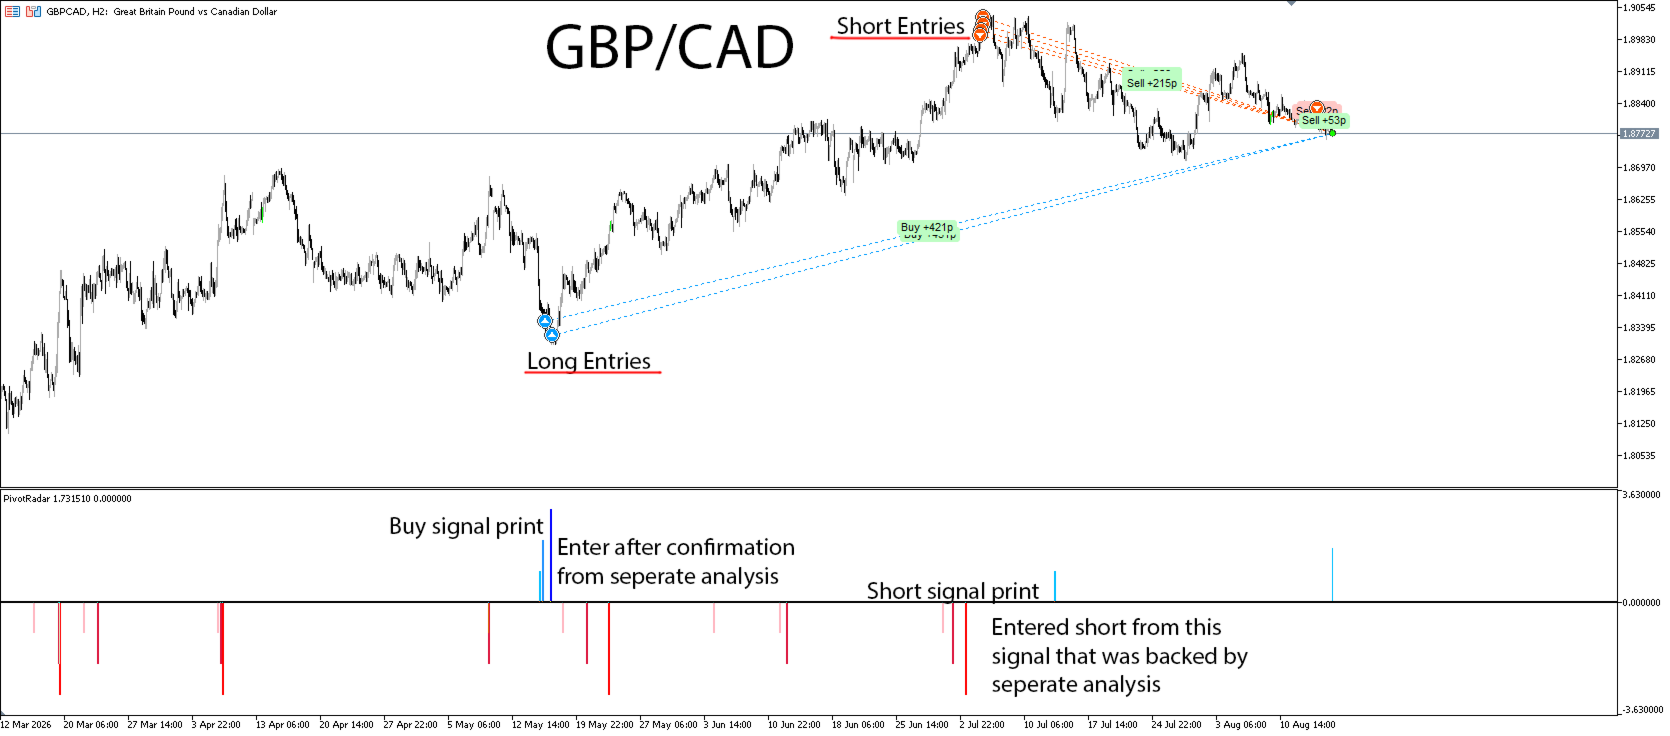
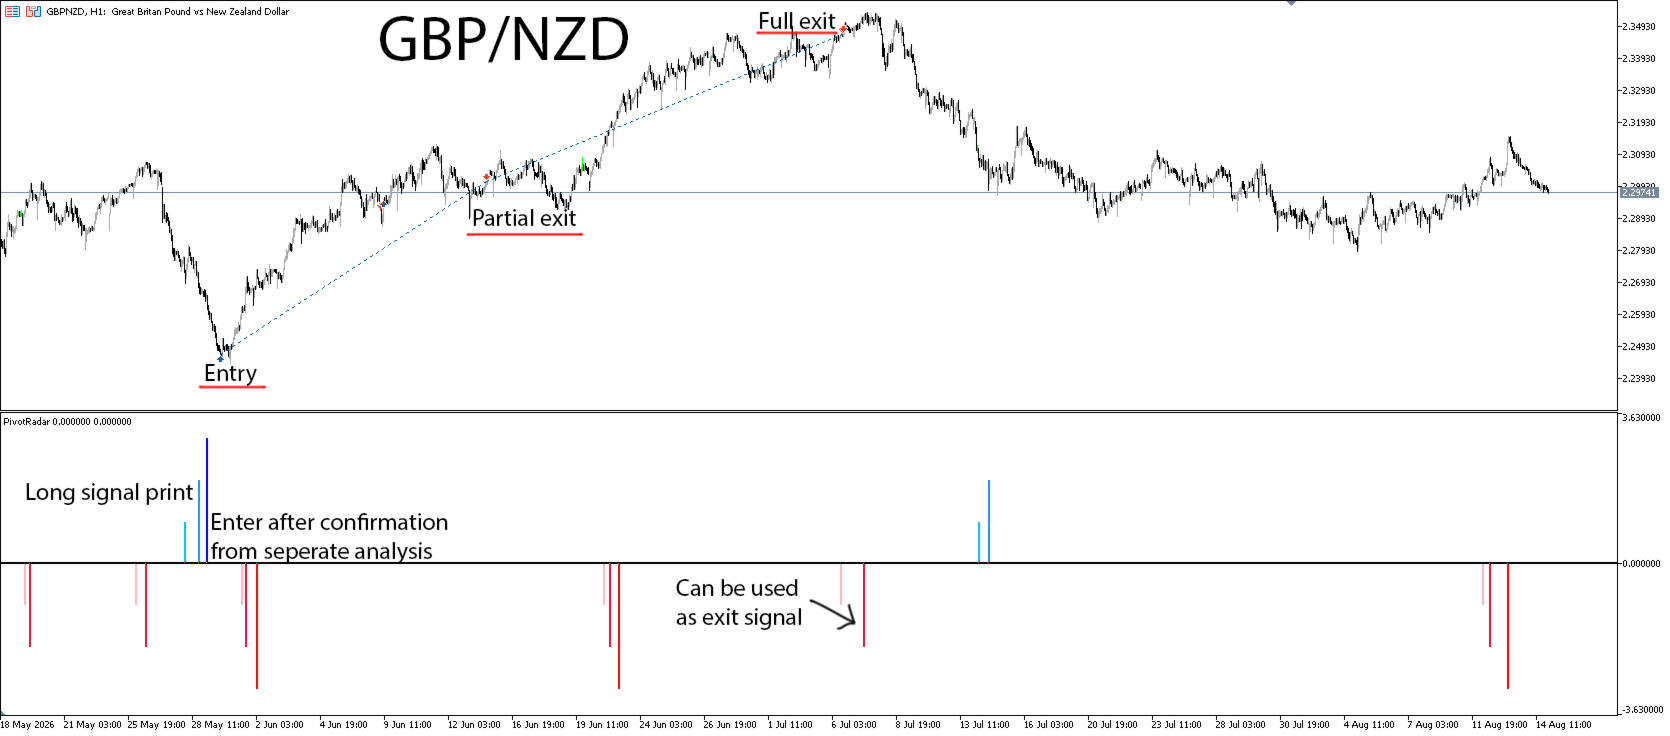
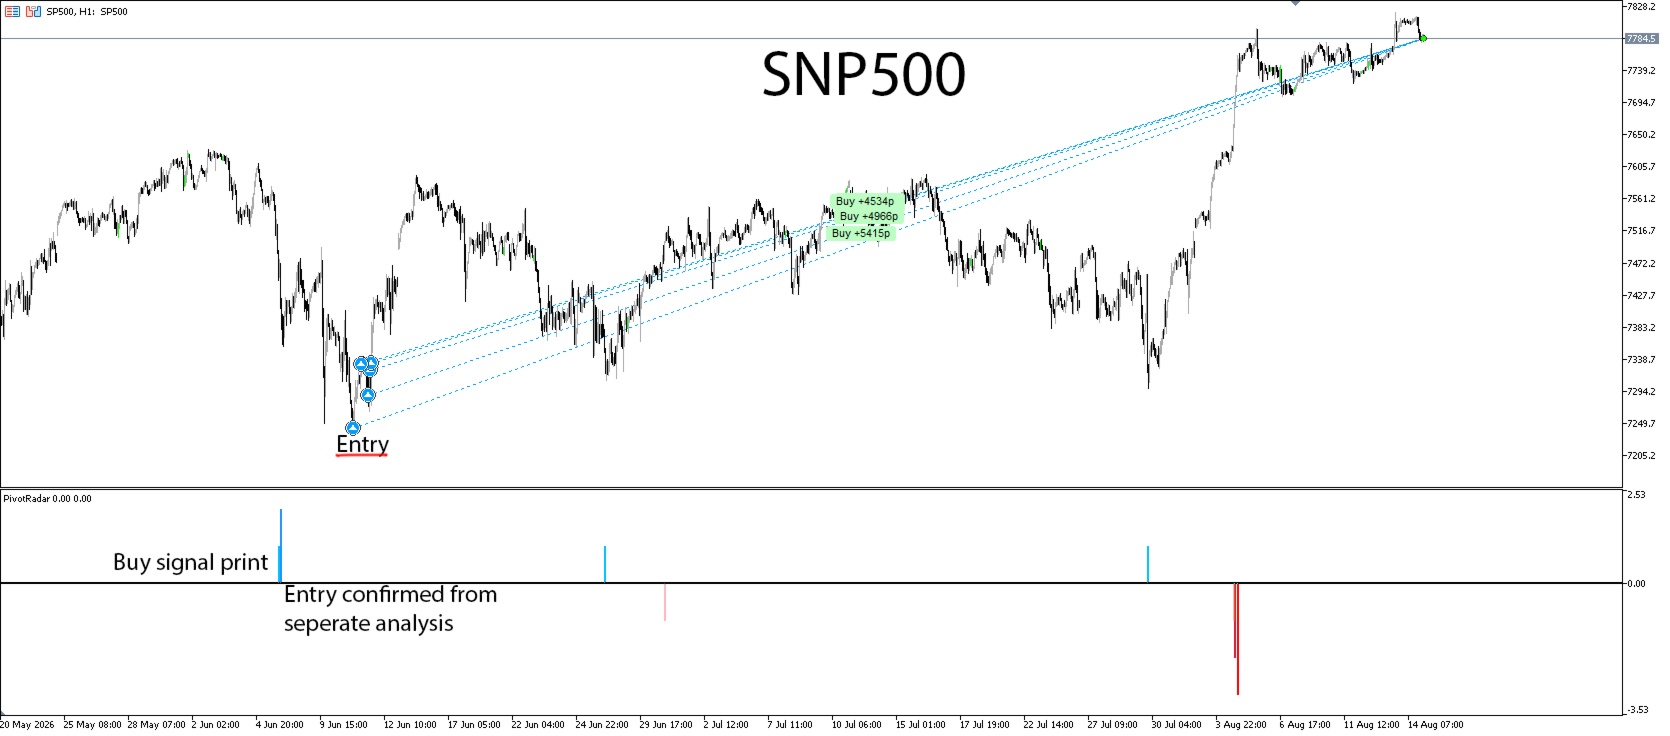
PivotRadar

How it works
A fresh read, every week. At the start of each trading week, PivotRadar re-anchors its zones to that week's opening structure. Nothing carries over stale from the week before — every week starts clean.
Three graduated tiers, both directions. As price works deeper into a zone, PivotRadar tracks it through three escalating tiers — a shallow first warning, a stronger mid-level signal, and an extreme-zone alert. This works for both potential upside and downside reversals, tracked independently, so you get a genuine two-sided read on the market rather than a one-directional bias.
Fires once, not on repeat. Each tier only signals the first time it's reached in a given week. You won't get flooded with the same alert firing over and over while price sits in a zone — one clean signal per tier, per week, per direction.
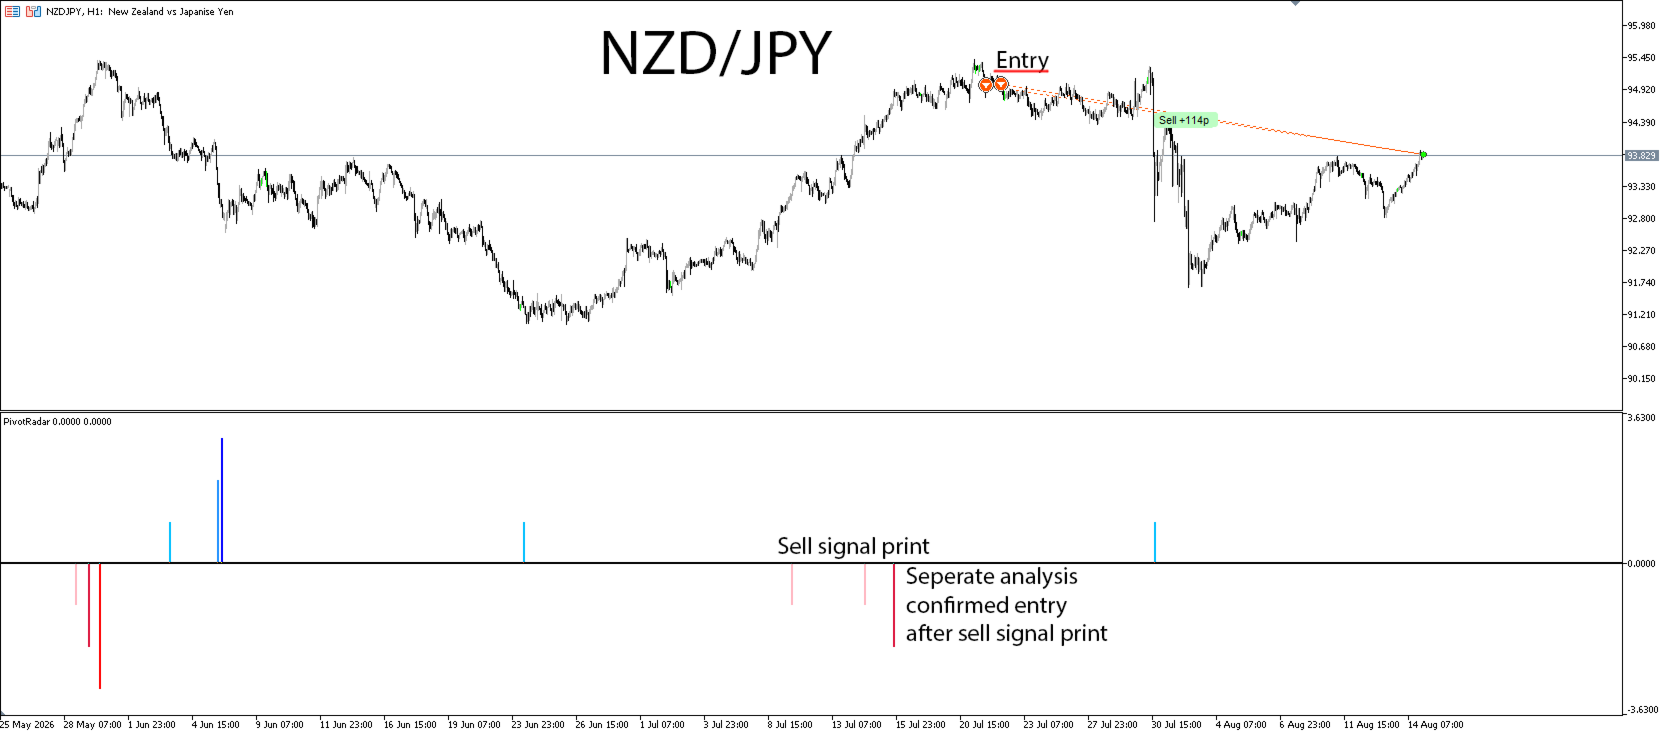
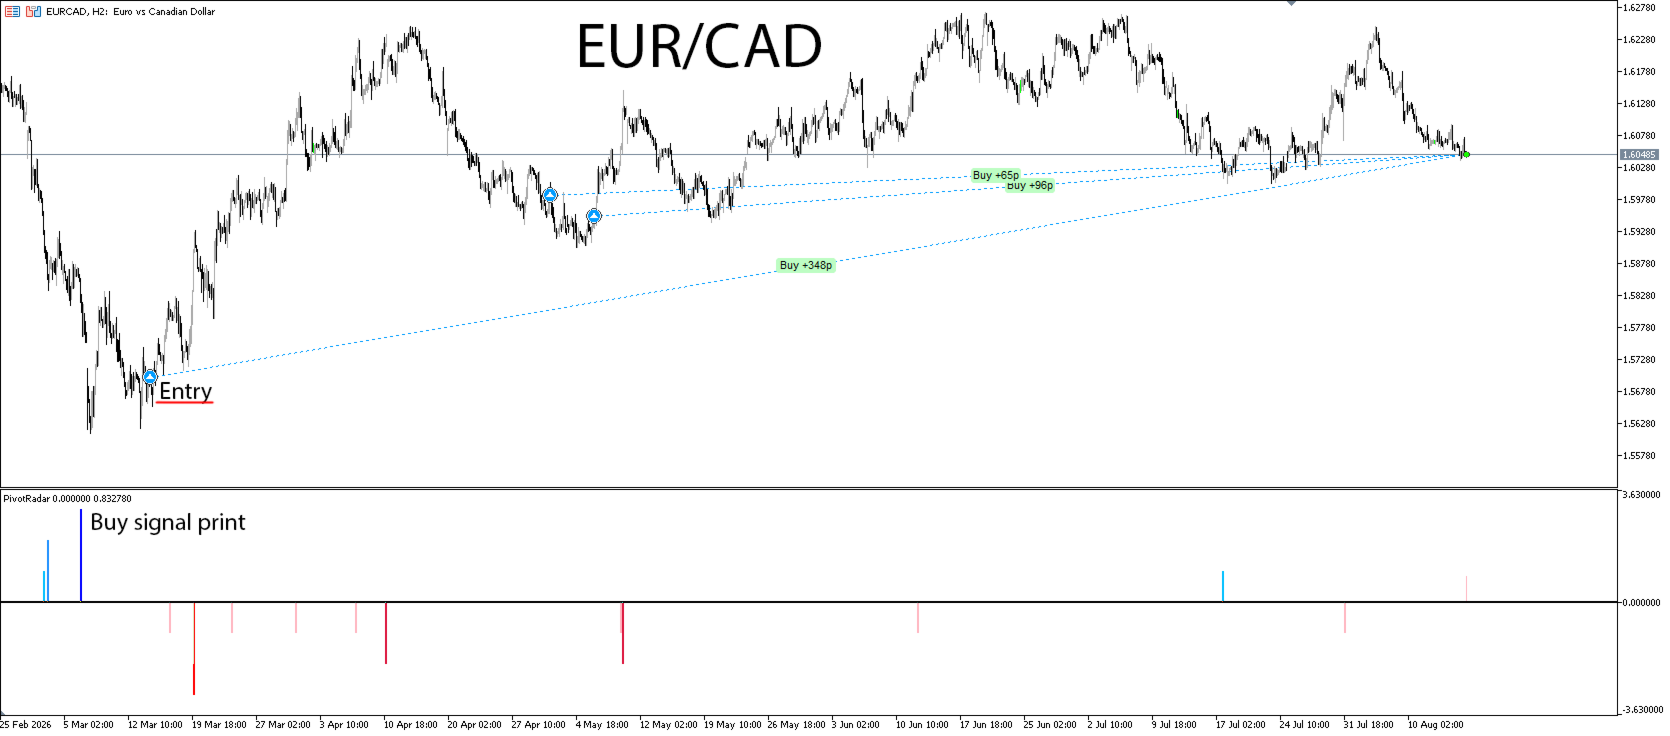
Built for discretion. Signals appear as clean, adjustable-width markers in a dedicated indicator window, color-coded by severity — so at a glance you know not just that something happened, but how significant it was.
What you get
Independent buy-side and sell-side signal tracking, each with its own three-tier escalation
Fully adjustable signal colors, so it fits whatever chart theme you already use
Adjustable signal width and direction (flip either side up or down to suit your layout)
Built with forex and indices in mind, and works on other instruments too — futures, stocks, ETFs, and beyond — provided you manually adjust the settings to fit that instrument's own price behavior (see "Honest limitations" below)
Configurable week-start day, for traders whose trading week doesn't begin Monday
A dedicated, uncluttered signal window that stays out of your way until it has something to say
How traders use it
PivotRadar isn't a standalone "buy here, sell here" system, and we won't pretend it is. It's a structural warning layer — a way to know, without staring at the chart all week, that price has worked its way into a zone worth paying attention to. Most traders use it alongside their own confirmation tools: price action, a trend filter, or their own support/resistance analysis. Think of it as the thing that taps you on the shoulder and says "look here now" — not the thing that makes the decision for you.
The three-tier structure exists because not every touch of a zone is equally significant. A shallow first-tier signal might just be noise inside a broader trend. A third-tier extreme signal is a genuinely rare, high-conviction event worth real attention. PivotRadar lets you calibrate how seriously to take each one, rather than treating every alert the same.
This is not a scalping tool. Because zones reset weekly and each tier only fires once, PivotRadar isn't going to hand you a stream of signals throughout the day, every day — if you're in and out of the market on a minute-by-minute basis, this isn't built for that rhythm. It's designed with swing and positional trading in mind, where a handful of well-placed weekly signals is the point, not a limitation. That said, shorter-term opportunities can still be taken when a signal does occur — plenty of traders will see a tier fire and use it as the trigger for a faster-turnaround trade — but always in conjunction with your own methods and analysis, not as a standalone entry signal on its own.
Reading a signal in context
PivotRadar tells you where price has reached, not what kind of move got it there — that second part is on you, and it's the difference between using this tool well and using it badly.
The tool is at its most powerful after price has already made an extended move — not at the start of one. A buy signal that prints after a selloff off the weekly highs is a genuinely different situation than a buy signal that prints while price is in the middle of a steep, established downtrend. Both can technically trigger the same tier — PivotRadar only measures distance from the weekly anchor, not the character of the trend that got price there. Telling those two situations apart is exactly the "your own judgment about the broader trend" piece we mean when we say to use this alongside your own analysis, not instead of it.
The pattern to look for: after an extended rally, a pulldown into the zone can produce a legitimate buy signal — you're watching a pullback inside strength, not a fresh breakdown. The mirror is true for sells: after an extended decline, a bounce into the zone can produce a legitimate sell signal — a rally inside weakness, not the start of a new uptrend. In both cases, the signal means more because it's happening against a move that's already run its course, not at the front edge of a fresh one.
What this tool is not for: treating every buy signal as a reason to immediately expect (or chase) a sell signal shortly after, or flipping straight from a long to a short the moment the opposite side fires. A signal on one side doesn't cancel or predict a signal on the other — read each one in its own trend context, not as a ping-pong pair.
Honest limitations
No indicator predicts the market, and we're not going to claim this one does. PivotRadar tells you where price has moved to relative to its own weekly structure — it doesn't know why, and it doesn't manage your risk for you. Use it with a stop loss. Use it with your own judgment about the broader trend.
PivotRadar is built and tuned with forex and indices in mind — that's where its default settings are calibrated to behave well out of the box. It works on other instruments too, including futures, stocks, and ETFs, but every market moves differently, and the defaults won't automatically fit an instrument they weren't built around. If you're running this on anything outside forex and indices, plan to manually adjust the relevant settings to match that instrument's own price behavior before trusting it — and backtest on your own instruments and timeframes before trading it with size, since behavior genuinely varies across different markets' volatility profiles.


SETTINGS

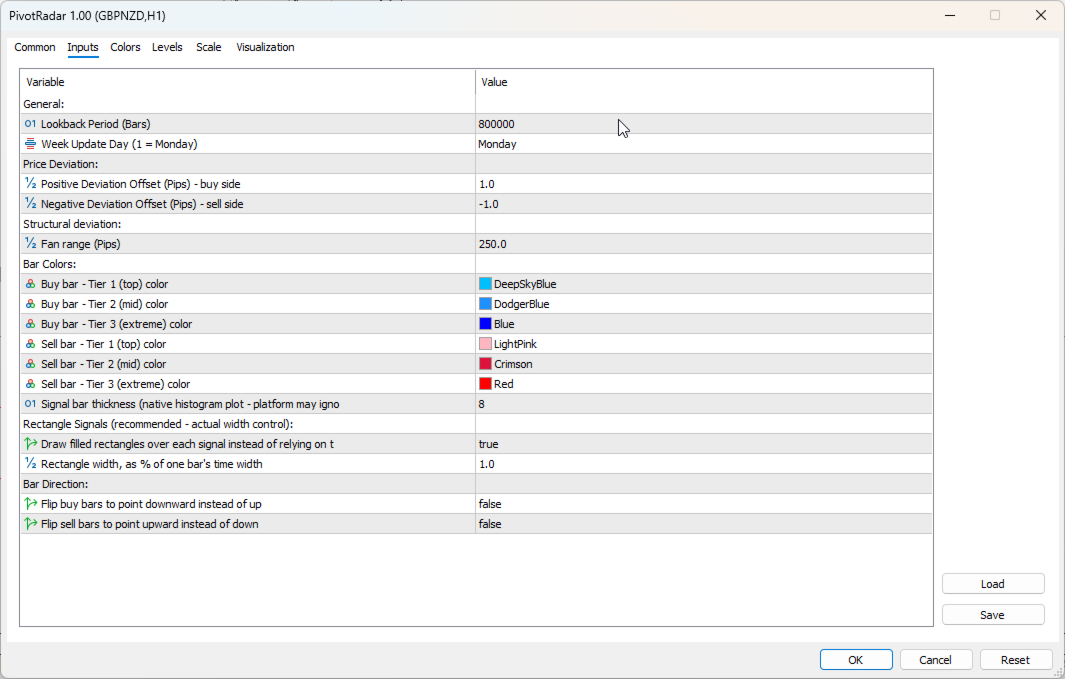
PivotRadar — Settings Guide

A quick reference for what each setting does. Everything here can be adjusted from the Inputs.

Lookback Period

How far back PivotRadar scans, in bars, when it first loads on a chart — this is what lets it rebuild every past weekly zone and signal across your available chart history, not just what happens from today forward.

Default: 800,000 bars — deep enough to cover essentially any amount of history your broker provides.

When to touch it: Rarely. Lower it only if you're on a very long history chart and want a faster initial load, and don't care about seeing older signals.

Week Update Day

Sets which day of the week PivotRadar treats as the start of a new cycle — this is the moment both the buy-side and sell-side zones reset fresh for the week ahead.

Default: Monday.

When to touch it: If your instrument's trading week effectively starts on a different day in your broker's server time, or you simply prefer to align the reset to a different day for your own planning.

Price Deviation

Two settings — one for the buy side, one for the sell side — that control how closely the tool's internal reference point tracks price. This is one of two settings governing how sensitive PivotRadar is before anything can be considered for a signal.

Default: 1 pip on both sides.

When to touch it: Advanced use only. This is a core sensitivity setting, not a cosmetic one — test any change thoroughly on your own instrument and timeframe before trusting it, ideally in the Strategy Tester before going live with it.

Fan Range

Sets how wide a zone PivotRadar watches around each week's anchor point, in pips. This is the second core sensitivity setting, and it's the one most likely to need adjusting per instrument.

Default: 250 pips.

When to touch it: This is the setting to tune first if you move PivotRadar to a different instrument. Every market has its own natural weekly range — a fast-moving pair or index can blow through a zone sized for a calmer one, while that same zone might be nearly unreachable on something slower. There's no universal right number here; back-test on your specific instrument before committing to a new value.

Bar Tiers

Controls the appearance of the three severity tiers on each side — Tier 1 (shallow), Tier 2 (mid), Tier 3 (extreme) — independently for buy and sell. Includes color per tier, overall bar width, and (recommended) the rectangle-signal width percentage, which gives more reliable thickness control than the native bar width setting alone.

Default: Light-to-dark blue for buy (shallow to extreme), light-to-dark red for sell.

When to touch it: Entirely cosmetic — adjust freely to match your chart theme. The tier structure itself (which signal counts as which severity) doesn't change; only how it looks does.

Bar Direction

Two on/off switches that flip which way each side's bars point. By default, buy signals point upward and sell signals point downward.

When to touch it: Personal preference only — some traders prefer both sides pointing the same direction, or the reverse of the default layout. Purely visual; has no effect on when or why a signal fires.


推荐产品
Fibozonesv1pro
Ignacio Souza Hermida
FiboMaster Pro — Automatic Fibonacci with Entry, SL & TP Automatic swing detection and Fibonacci levels with entry, stop loss, and take profit zones, drawn on any instrument and timeframe. FiboMaster Pro automatically detects the most recent swing high and swing low on your chart and draws the full Fibonacci retracement along with reference entry, stop loss, and two take profit levels — no manual drawing required. HOW IT WORKS The indicator scans the last N candles (configurable), identifies the
Smart Pivot Points
Alexandr Saprykin
MetaTrader 5 智能枢轴点指标 — 清晰的交易水平线 智能枢轴点指标是一款适用于 MetaTrader 5 的专业指标,可自动计算并在图表上显示一整套关键交易水平线。它将纷繁的价格走势转化为清晰的结构化图表,突出显示支撑位、阻力位、价格平衡点和潜在目标区域。该工具专为重视清晰度的交易者而设计,适用于任何市场:外汇、加密货币(比特币、以太坊)、股指、股票和大宗商品(XAUUSD)。 该指标是您可靠的分析助手,可节省计算时间并为您的分析增添客观性。它不会提供市场信号或替您做决定,而是为您做出明智的交易决策提供高质量的信息基础。 主要功能和优势 即用型价格坐标系统:无需再手动绘制水平线。五条清晰的线条会立即显示在图表上:中心水平线(平衡点)、支撑位、阻力位、买入目标位和卖出目标位。 完全自定义显示内容:您可以决定显示哪些信息。轻松启用或禁用级别组和价格标签,根据您的策略定制图表,并保持工作区整洁。 完全灵活的计算方式:选择任意时间周期进行计算——从用于超短线交易的分钟级(M5、M15)到用于波段交易的日线(D1)和周线(W1)。通过指定要使用的历史数据周期数来调整分析
Fibonacci Pullback EA
Rodrigo Alejandro Stemann Henriquez
Fibonacci Pullback EA detects the latest valid swing via symmetric pivots and projects a configurable Fibonacci level across that range. When the previous closed candle wicks into that level and confirms on close , the EA places an order with SL at the swing extreme plus a points buffer , and TP at the opposite swing extreme. Designed originally for EURUSD M30 and USDJPY M30 , yet fully configurable. Signal logic Determines the latest bearish or bullish swing using symmetric pivots. Computes a F
Liquidity Map
Alex Amuyunzu Raymond
Liquidity Map  Overview The Liquidity Map indicator is an advanced visualization tool based on ICT Smart Money Concepts . It automatically identifies daily Buy Zones , Sell Zones , and Liquidity Levels , showing where price is likely to reverse or continue based on institutional order flow. It calculates key levels from the daily session — such as the previous day’s high, low, and midpoint — then derives a premium (sell bias) and discount (buy bias) structure. When price trades into these mapped
SMA Fibonacci EA
Christoph Kreher
Simple EA with 1 SMA and Fibonacci. The Expertadvisor opens positions in the direction of the trend when price levels have exceeded or fallen below the Fibonacci levels. It depends on the market in question and which parameters to use. The EA is programmed in such a way that optimization runs consume little time. A news filter and filter by day of the week are built in.
Mogalef Bands MT5
Victor Tengo Quiles
Mogalef 带状区间 — 动态区间结构与目标区域(MT5) Mogalef 带状区间是一款可视化结构指标,用“分阶段移动的动态区间”来描述市场。它不依赖单点“信号”,而是提供结构化的背景水平,用于: 识别价格当前主要“运作/消化”的区域(操作区), 定位可能的延伸区域(目标区), 通过更稳定、不过度追随的更新方式来过滤噪音(带惯性)。 本指标适合偏主观/半系统的交易者:需要清晰的结构水平来做可重复的决策(按背景入场、按结构管理、在概率区域出场)。 图表上你会看到什么 指标会绘制一组带状水平来框定不同阶段的价格行为: 中部区域(平衡区):   市场更容易在此“工作/整理/盘整”。 外侧带(极值区):   价格更“拉伸”的区域,更常出现反应、停顿或末端延伸。 中间带(±1x):   用于观察延续、回撤与仓位管理的中间层级。 重要说明:   本指标不追求对每一根影线都反应。逻辑更偏向稳定性,避免在噪音环境中“追价”。 实战解读(如何使用) 区间行情(来回交易) 当价格在带内来回震荡、结构被尊重时,常见用法是: 将中部区域视为平衡参考, 将外侧带视为工作/反应区域:价格更可能减速、吸收或
HenGann
Ehsan Kariminasab
Hengann Sq, using artificial intelligence, mathematical algorithms, Fibonacci, 9 Gann and Fibonacci square strategy, which enables us to have win rate of 200% profit per month. Initial investment for minimum capital of $100 to $1000, you be able to adjust the volume, date, hour, day and profit limit. adjustable profit limit in both buy and sell positions. Able to place orders in all time frames from 5 minutes to a week. further adjustment enables you to open the position according your desir
Automatically plots the 'Golden Fibonacci Ratio’ between the High and Low of the previous day... ...Highs and Lows are great Support and Resistance zones. Breakouts of Fibonacci levels are key points for entry and exit of trades. Pink lines indicate that the previous day's Candle closed lower. Blue colored lines indicate that the previous day's Candle closed higher.
DM IND Exclusive
Sergio Vidal Prado
Indicador Para Opções Binarias. Indicator for Binary Options Usa dois gales. Instalar em mt5 Esse indicador é para ser usado no tempo de vela de 5 minutos e em M5. Este também funciona em M1, porém é mais eficiente em M5. Só descompactar e copiar os arquivos na pasta de dados do seu MT5. Arquivos indicator na pasta MQL5 - Indicator. Baixe também a Media Movel totalmente gratis: https://www.mql5.com/pt/market/product/50400 Esse Indicador é para a próxima vela. Apareceu a seta, só aguardar a próx
Risk Calculator MT5
Manuel Guillermo Sanchez Castro
This is an advanced Expert Advisor (EA) for MetaTrader 5 that acts as a visual and interactive panel. Its main purpose is to calculate risk/reward, manage open positions, and execute trades precisely directly from the chart. Key Functions: Interactive Panel: An on-screen graphical interface that can be dragged, minimized, and customized (dark/light themes), with bilingual support (ES/EN). Risk/Reward Calculation: Allows defining position sizing based on fixed risk (Cash), account percentage (%),
mql4 version:  https://www.mql5.com/en/market/product/44606   Simple indicator to calculate profit on fibonacci retracement levels with fixed lot size, or calculate lot size on fibonacci levels with fixed profit. Add to chart and move trend line to set the fibonacci retracement levels. Works similar as default fibonacci retracement line study in Metatrader. Inputs Fixed  - select what value will be fix, lot or profit Fixed value  - value that will be fix on all levels Levels  - levels for which
CChart
Rong Bin Su
在外汇和金融市场中,快速反应和精准的决策至关重要。然而,常规的 MetaTrader 5 终端最低只支持 1 分钟图表,限制了交易者对市场波动的敏感度。为了解决这一问题,我们推出了全新的 秒级图表 K 线指标 ,让您在副图中轻松查看和分析 1 秒至 30 秒的市场动态。 主要功能 支持多种秒级周期 :该指标允许您选择以下周期,满足不同交易策略的需求: S1 : 1 秒 S2 : 2 秒 S3 : 3 秒 S4 : 4 秒 S5 : 5 秒 S10 : 10 秒 S15 : 15 秒 S20 : 20 秒 S30 : 30 秒 实时更新 :秒级图表将实时更新,确保您在每一刻都能获取到最新的市场信息,帮助您做出及时的交易决策。 用户友好的界面 :该指标在副图中显示,直观易用,您可以轻松切换不同的时间周期,快速分析市场走势。 适用人群 短线交易者 :适合高频交易和短线策略的交易者,通过秒级图表捕捉瞬息万变的市场机会。 技术分析师 :为技术分析提供更细致的数据支持,帮助您识别潜在的买入和卖出信号。 如何使用 将指标添加到您的图表上。 选择您希望观察的秒级时间周期。 实时监控市场动向,利用丰富
UNIVERSAL RISK TRADE MANAGER MT5 Control Your Risk. Protect Your Capital. Trade with Confidence. Successful trading is not only about finding the right entry. It is about controlling how much you can lose when the market moves against you. Universal Risk Trade Manager MT5 is a professional risk-management and trade-execution assistant designed to calculate position sizes, protect trading capital, and manage open trades directly from a clear, easy-to-use chart panel. Whether you trade Forex, Gold
Double Fractal Entry Bot trades automatically using fractal breakouts or rebounds. It detects precise entry points, places SL and TP based on market structure, and includes logic to manage risk and avoid false signals. Simple, smart, and powerful. This product is also available for MetaTrader 4 =>  https://www.mql5.com/en/market/product/143609 Double Fractal Entry Bot is an intelligent trading robot based on the proven logic of the Double Fractal Entry indicator. It analyzes price using upper a
Master Dow Jones EA
Sergio Tiscar Ortega
Investment Philosophy Master Dow Jones EA is a high-precision algorithmic trading system specifically engineered for the Dow Jones Industrial Average (DJ30/US30) . Unlike generic trading systems, this algorithm exploits the structural bullish bias inherent in the top 30 U.S. blue-chip companies by operating exclusively on the Long Side . This specialization significantly reduces exposure to erratic short-side volatility and aligns the strategy with long-term institutional capital flows. Strategy
TradeManagerRR Visualizer MT5   是一个交易管理工具,旨在帮助交易者轻松地在图表上可视化他们的止损(SL)和获利(TP)水平。此初始版本提供了一个简单的图形表示,显示SL和TP区域以及入场价格。请注意,目前的版本仅专注于图形显示SL和TP区域的图形标记。 当前版本的特点: SL和TP区域显示:   清晰地显示止损和获利水平,支持自定义颜色。 可移动入场价格:   允许在图表上移动入场价格,以查看SL和TP水平的变化。 风险/回报比率计算:   动态显示基于设定水平的风险/回报比率。 使用方法: 设置入场价格:   点击图表以设置您的入场价格。 调整SL和TP水平:   移动SL和TP区域,以调整风险和回报水平。 查看区域:   SL和TP区域将以不同的颜色显示,以方便可视化。 即将推出:   更新版本将在几天内发布,提供更多功能和改进,以实现更有效的交易管理。 请求:   如果您觉得 TradeManagerRR Visualizer MT5 有用,请在产品页面上进行评分。您的反馈对我们非常重要,有助于改进我们的工具。
Swing Master EA
Ihor Otkydach
4.39 (79)
每位買家皆可享專屬好禮: 購買此機器人的買家將獲贈   GRABBER BOT :本活動限時優惠,請把握機會! 给大家带来一款狠角色EA,基于我的手动交易系统 Algo Pumping 打造。我狠狠打磨了这套策略,加了很多实用干货、滤网和黑科技,现在正式上线这款交易机器人,它可以: 按照高级版Algo Pumping Swing Trading算法操盘, 自动挂好Stop Loss止损,护住你的资金池, 无论是Prop Firm挑战赛,还是自己玩实盘,都能轻松搞定, 不搞马丁、不暴力加仓,操作稳得一批, 主打M15周期(后续会开放H1和H4哦), 一次性管理15个货币对:AUDCAD、AUDCHF、AUDUSD、AUDSGD、CADCHF、EURGBP、EURNZD、EURUSD、GBPAUD、GBPCAD、GBPCHF、GBPUSD、NZDUSD、USDCAD、USDCHF, 不玩突破流(不追单,不挨打), 对服务器延迟和执行速度要求不高,小账户一样能跑得飞起, 最低入场资金只需200美金起步, 支持各种杠杆:1:30、1:50、1:100、1:200、1:500、甚至1:1000
FibonacciPRO
Antonio Gutemberg Frota
Fibonacci Pro Fibonacci Pro is an automatic Fibonacci indicator for MetaTrader 5 designed to identify the current market movement and draw clean retracement and extension levels directly on the chart. It detects the relevant swing high and swing low of the active move, then plots key Fibonacci levels with clear labels, making it easier to analyze pullbacks, continuation zones, and potential reaction areas. Main Features Automatic Fibonacci drawing based on the current market movement Detects swi
FREE
"Manual channel drawing? Not anymore. Let the market structure reveal itself automatically." "Track long-term price zones 24/7, in real-time." Real Trader Pain Points Identifying pivot points manually takes   huge time   and   effort Difficult to adapt to   high volatility   and pinpoint   reliable channels Copy Ideas "Markets never sleep. Why should your analysis stop?" "Dozens of assets a day—how do you keep up?" Core Claim AutoChannels   automatically reads market structure , reducin
Fibonacci MT5
Konstantin Chechnev
Fibonacci MT5 是一个基于斐波那契水平的自动化交易智能顾问。它会在指定的K线数量中确定价格的最低点和最高点,绘制斐波那契水平,并在当前价格达到选定水平时开仓。EA 可以按照趋势或逆趋势进行交易,并可根据设定的参数调整。同时,它还允许设置平仓水平、风险管理和时间过滤。 特征 自动检测局部极值和斐波那契水平的构建。   基于斐波那契水平的可定制的开仓和平仓条件。   灵活的风险管理选项:止损,止盈,限制订单量和数量。 通用设置 Lot Size:开仓手数。 Max Open Buy Orders:最大买单数量。 Max Open Sell Orders:最大卖单数量。 Magic Number:EA订单的唯一标识符。 风险管理 Use Stop Loss:启用止损。 Stop Loss (pips):止损点数。 Use Take Profit:启用止盈。 Take Profit (pips):止盈点数。 时间过滤 Use Time Filter:启用时间过滤。 Start Trading Hour:开始交易的时间(小时)。 End Trading Hour:结束交易的
NEXA Donchian Break 1. 产品概述 NEXA Donchian Break 是一款自动交易专家顾问(Expert Advisor), 基于 Donchian 通道识别 价格突破区域 , 并仅在满足附加技术条件时执行交易。 本产品以 学习与研究目的免费发布 , 旨在帮助用户通过参数设置,理解 突破逻辑、趋势过滤以及止损 / 止盈结构之间的关系。 本产品 不保证也不承诺任何交易结果 。 实际表现可能因市场环境、经纪商条件以及用户参数设置而有所不同。 2. 策略结构说明 本 EA 提供两种可选的策略模式。 策略模式 V1 Donchian 通道突破识别 使用 Momentum 指标确认方向 使用 ADX 指标过滤趋势强度 初始止损基于 ATR 计算 在满足条件后,可切换为结构性(Swing)止损 策略模式 V2 Donchian 通道突破识别 使用 MACD 柱状图判断趋势加速 使用 OBV 斜率过滤成交量方向 可选使用 ADX 作为附加趋势过滤 止损基于 Donchian 通道的相反边界 不同策略模式采用不同的过滤组合, 用户可通过对比学习不同的突破确认方法。
FREE
Gordian Knot 1
Hidenori Tanaka
This EA is a simple automated trading system for the Meta Trader 5 platform. It uses parabolic SAR to automatically adjust lot size based on market trends. By this, the EA does not take a large amount of risk, but instead steadily accumulates profits. Main Features The EA does not use the martingale method for lot size adjustment. If a position is taken before the forex market closes, the position will be carried over to the weekend. This EA is designed to hold multiple positions at the same t
Bar Sequential
Maximiliano Frisione Figueroa
This indicator can help you clearly identify trend changes in both bullish and bearish markets. The indicator compares the closing price of the last candle with the closing price of the candle "X" periods ago (input parameter). In an uptrend, an initial number '1' is plotted if a candle closes higher than the closing of a candle "X" periods ago. In a downtrend, an initial number '1' is plotted if a candle closes below the closing of a candle "X" periods ago. Subsequent numbers are plotted when e
FREE
BALOGUN SMC ELITE — Professional Smart Money Concepts Indicator KEY FEATURES: Strict BUY/SELL Alternation — Only 1 BUY followed by 1 SELL (no signal spam) Non-Repainting Signals — Signals confirmed on closed bars only Zone-Limited NO TRADE Markers — Clear visual zones showing when NOT to trade Multi-Factor Confluence Scoring — 0-100% quality score per setup Professional Dashboard — Real-time trend, confluence, and signal status Multi-Channel Alerts — Popup, Push, Email, and S
Phoenix Fibonacci
Nigel Nii Darku Narnor Darko
This indicator, often referred to as an Auto-Fibonacci Retracement Tool, is a technical analysis script designed to identify potential support and resistance levels based on the "Golden Ratio." Unlike the standard manual tool, this version automatically scans a specific lookback period (e.g., the last 100 candles) to find the absolute Swing High and Swing Low, drawing the levels for you in real-time. How to Use it for Trading 1. Entering a BUY Trade (Long) You use the Fibonacci levels to find "
FREE
HTF Open Markers + ICT Silver Bullet Zones — Usage & Strategy Guide What it draws Session 1 / Session 2 lines : vertical lines at the open of every bar on two independently configurable higher timeframes (defaults: H4 and D1), including a projected line for the rest of today's not-yet-opened bars on sub-daily timeframes, so you can see where the next candle will open before it happens. ICT Silver Bullet zones : shaded rectangles over the three classic ICT kill-zone windows, converted from New Yo
FREE
Prometheus Gen 1
Humphrey Mangera
PREDATOR PULSE AI TRADER Premium · By Prometheus Neural Systems Most trading indicators are built once, calibrated on historical data, and left to run. They don't adapt. They don't learn. When the market changes — and it always does — they keep firing the same signals based on conditions that no longer exist. Predator Pulse was built on a different idea. Two Engines Working Together The foundation is a 60-feature institutional microstructure engine. Every bar, it analyses sixty distinct aspects
ENGLISH VERSION (for MQL5 Market) Product Description: RSI Trend & Volatility Dashboard (Multi-Timeframe Filter) This professional dashboard provides traders with an ultimate market overview inside a single chart. It continuously monitors the trend direction across 5 timeframes simultaneously: M5, M15, M30, H1, and D1 [MQL5]. No more tedious chart switching or multi-window clutter – see everything from quick scalping moves to global institutional daily trends in real-time [MQL5]. Key Adva
Harness the power of the universe's most perfect number. Golden Retracement is an Expert Advisor meticulously engineered to identify and trade precise reversals at key Fibonacci retracement levels. It automatically detects significant market swings and calculates the golden ratio levels (38.2%, 50.0%, 61.8%), waiting for the price to "bounce" with a powerful confirmation. This bot brings mathematical elegance and disciplined execution to your trading, helping you capitalize on deep corrections a
FREE
QTS Gold Guardian AI 机构级黄金短线交易系统,采用神经网络驱动。具备智能对冲、资金保护和波动率适应功能。无需使用危险的马丁格尔策略。 QTS Gold Guardian AI 是 XAUUSD(黄金)短线交易的终极解决方案,旨在应对波动剧烈的市场环境。与爆仓的传统短线交易系统不同,QTS 的首要目标是保本。 主要功能: 神经网络逻辑:运用先进的逻辑技术,在 M5/H1 时间框架内检测微趋势。 智能恢复:采用智能对冲系数,在不影响保证金的情况下,有效抵消亏损交易。 资金保护:内置硬止损机制。如果回撤达到临界水平,EA 将暂停交易以保护账户(这对自营交易公司至关重要!)。 新闻过滤:自动避免在重大新闻发布期间进行交易。 动态间隙:根据实时市场波动率(ATR)调整网格间距。 ️ 推荐: 交易品种:XAUUSD(黄金)。 时间周期:M15 或 H1。 最低入金:100 美元(美分)或 1000 美元(标准)。 账户类型:推荐低点差/ECN 账户。 VPS:强烈建议使用 VPS 以实现 24/7 全天候运行。 注意:此 EA 已通过严格的
该产品的买家也购买
UZFX {SSS} 超短线智能信号 v4.0 MT5 是一款无重绘的高性能交易指标,专为在快速波动的市场中需要精准、实时信号的超短线交易者、日内交易者和波段交易者设计。该指标由 (UZFX-LABS) 开发,融合了价格行为分析、趋势确认和智能过滤技术,可在所有货币对和时间周期内生成高概率的买卖信号、预警信号以及趋势延续机会。 别再对交易犹豫不决了,开始遵循这一专为追求清晰、精准和纪律性市场执行的交易者设计的结构化信号系统吧。 我的建议* 最佳时间周期:15分钟及以上。 {H1} 是我的最爱。而且效果令人惊叹……!! 更新后的主要功能 • 自动买入和卖出信号检测 • 先进的反转识别逻辑 • 潜在市场反转前的早期预警信号 • 趋势延续确认信号 • 内置风险管理功能,包含入场点、止损点、TP1、TP2和TP3水平 • 完全可自定义的风险回报比 • 实时警报、声音提醒和移动端推送通知 • 带交易建议的专业信息面板 • 适用于所有MT5交易品种和时间周期 • 界面简洁、轻量且用户友好 为什么交易者选择 UZFX SSS? 大多数交易者亏损的原因在于入场过晚、平仓过早,或者缺乏明确的交
ARICoins
Temirlan Kdyrkhan
ARICoin is a powerful trading companion designed to generate high-probability entry signals with dynamic TP/SL/DP levels based on volatility. Built-in performance tracking shows win/loss stats, PP1/PP2 hits, and success rates all updated live. Key Features: Buy/Sell signals with adaptive volatility bands Real-time TP/SL/DP levels based on ATR Built-in MA Filter with optional ATR/StdDev volatility Performance stats panel (Success, Profit/Loss, PP1/PP2) Alerts via popup, sound, push, or email Cust
PrimeScalping
Temirlan Kdyrkhan
PrimeScalping is a powerful trading companion designed to generate high-probability entry signals with dynamic TP/SL/DP levels based on volatility. Built-in performance tracking shows win/loss stats, PP1/PP2 hits, and success rates — all updated live. Key Features: Buy/Sell signals with adaptive volatility bands Real-time TP/SL/DP levels based on ATR Built-in MA Filter with optional ATR/StdDev volatility Performance stats panel (Success, Profit/Loss, PP1/PP2) Alerts via popup, sound, push, or e
TrendMaestro5
Stefano Frisetti
note: this indicator is for METATRADER4, if you want the version for METATRADER5 this is the link:  https://www.mql5.com/it/market/product/108106 TRENDMAESTRO ver 2.5 TRENDMAESTRO recognizes a new TREND from the start, he never makes mistakes. The certainty of identifying a new TREND is priceless. DESCRIPTION TRENDMAESTRO identifies a new TREND in the bud, this indicator examines the volatility, volumes and momentum to identify the moment in which there is an explosion of one or more of these da
OrderFlow Absorption – 專業級MT5買賣差與吸收訊號指標 釋放真正訂單流分析的力量,OrderFlow Absorption 是MetaTrader 5上最強大的買賣差(Delta)直方圖與吸收訊號指標。專為想看清每一個價格波動背後真相的交易者設計,這個工具揭示了隱藏的買賣壓力與推動市場的吸收事件。 功能特色 買賣差直方圖視覺化:   以清晰的色彩直方圖即時顯示買方與賣方壓力。 吸收訊號偵測:   先進邏輯自動辨識多空吸收事件,及早預警潛在反轉。 圖表標記:   吸收訊號直接標示於主圖表,方便視覺辨識。 彈出式警報:   新吸收訊號出現時即時通知。 自訂門檻:   過濾弱訊號,專注高勝率機會。 資源管理:   高效運算,適用於大型圖表也能流暢運行。 全品種兼容:   適用於任何商品與週期,包括外匯、指數、商品等。 簡易整合:   參數簡單,快速上手與調整。 OrderFlow Absorption 的邏輯說明 OrderFlow Absorption 採用專利演算法,能在沒有完整Tick數據的情況下,估算每根K棒的買賣壓力(Delta)。它分析成交量、價格行為、K
SmartScalping
Temirlan Kdyrkhan
SmartScalping is a powerful trading companion designed to generate high-probability entry signals with dynamic TP/SL/DP levels based on volatility. Built-in performance tracking shows win/loss stats, PP1/PP2 hits, and success rates — all updated live. Key Features: Buy/Sell signals with adaptive volatility bands Real-time TP/SL/DP levels based on ATR Built-in MA Filter with optional ATR/StdDev volatility Performance stats panel (Success, Profit/Loss, PP1/PP2) Alerts via popup, sound, push, or e
ScalpPoint
Temirlan Kdyrkhan
ScalpPoint is a powerful trading companion designed to generate high-probability entry signals with dynamic TP/SL/DP levels based on volatility. Built-in performance tracking shows win/loss stats, PP1/PP2 hits, and success rates — all updated live. Key Features: Buy/Sell signals with adaptive volatility bands Real-time TP/SL/DP levels based on ATR Built-in MA Filter with optional ATR/StdDev volatility Performance stats panel (Success, Profit/Loss, PP1/PP2) Alerts via popup, sound, push, or emai
TrendProMaster
Temirlan Kdyrkhan
MasterTrend Indicator for MT5 A powerful trend-following and signal-evaluation tool MasterTrend   is a custom MT5 indicator that combines Moving Averages and ATR-based risk/reward logic to generate clear buy/sell signals. It visualizes dynamic SL/TP levels, evaluates past trade outcomes, and displays win/loss statistics in a clean on-chart panel. Key features include: Buy/Sell signals based on MA crossovers ATR-based SL/TP1/TP2/TP3 levels with visual lines and labels Signal outcome tracking wit
ARIPoint
Temirlan Kdyrkhan
1 (1)
ARIPoint is a powerful trading companion designed to generate high-probability entry signals with dynamic TP/SL/DP levels based on volatility. Built-in performance tracking shows win/loss stats, PP1/PP2 hits, and success rates all updated live. Key Features: Buy/Sell signals with adaptive volatility bands Real-time TP/SL/DP levels based on ATR Built-in MA Filter with optional ATR/StdDev volatility Performance stats panel (Success, Profit/Loss, PP1/PP2) Alerts via popup, sound, push, or email Cu
MasterTrend
Temirlan Kdyrkhan
MasterTrend Indicator for MT5 A powerful trend-following and signal-evaluation tool MasterTrend   is a custom MT5 indicator that combines Moving Averages and ATR-based risk/reward logic to generate clear buy/sell signals. It visualizes dynamic SL/TP levels, evaluates past trade outcomes, and displays win/loss statistics in a clean on-chart panel. Key features include: Buy/Sell signals based on MA crossovers ATR-based SL/TP1/TP2/TP3 levels with visual lines and labels Signal outcome tracking wit
Naked Forex Tweezer Pro Indicator Tweezer Pro Indicator is a pattern recognition indicator for Forex, Stocks, Indices, Futures, Commodities and Cryptos. The standard Tweezer is a two bar pattern. Our enhanced version is a multi-bar pattern. We filter the patterns for you so that you only get the     best and most effective patterns   and ignore the noise. The Tweezer pattern is a simple and effective pattern to trade. The strategy that comes with the Tweezer is based on price action. The Twe
Transaction Speed MT5
Ivan Stefanov
5 (4)
当然,以下是翻译成中文(简体)的版本: 该指标标出市场中显现出 交易兴趣 的区域,并随后显示 订单积累区域 。它的工作方式类似于大规模的订单簿。 这是为 大资金 打造的指标,性能卓越。市场中有任何兴趣,你都能通过它清晰看到。 (这是一个 完全重写的自动化版本 —— 不再需要手动分析。) 交易速度 是一个全新的概念指标,它显示了市场上大订单 何时 、 何地 聚集,并揭示了其背后的意义。它可以在 非常早期 就检测到趋势的变化。 在外汇市场,所谓的“交易量”实际上是误导性的,因为那指的是价格在单位时间内的变化,因此真正的名称应是“交易速度”。 一切都取决于我们如何思考、如何行动、如何分析。 改变分析范式至关重要。 该指标完全重构了外汇市场上“交易量”的概念,用逻辑方式重新定义并应用,从而成为一个 独特而精准的工具 。 使用方法: 默认情况下,指标处于 自动模式 ,可独立用于任何时间周期。如果你希望切换到手动模式,只需点击 Auto / Manual Mode 按钮即可。 在 手动模式 下,所有计算从 2025年1月1日 开始。你可以根据需要更改该日期,以查看不同的分析结果。 最优数据周期
AriX
Temirlan Kdyrkhan
1 (4)
AriX Indicator for MT5 A powerful trend-following and signal-evaluation tool AriX is a custom MT5 indicator that combines Moving Averages and ATR-based risk/reward logic to generate clear buy/sell signals. It visualizes dynamic SL/TP levels, evaluates past trade outcomes, and displays win/loss statistics in a clean on-chart panel. Key features include: Buy/Sell signals based on MA crossovers ATR-based SL/TP1/TP2/TP3 levels with visual lines and labels Signal outcome tracking with real-time stat
看清市场真正在做什么。   在您眼前实时观察三大市场阶段(收缩、扩张、趋势),并在趋势阶段的早期阶段抓住更优的入场点。   不要再猜测。开始像机构和聪明钱那样解读市场。   Apex Market Structure Pro(MT5 版)是一款精准的聪明钱分析工具,它剥离噪音,向您展示每根 K 线之下的真实结构:流动性、结构转变、吸   筹区域与趋势偏向,全部呈现在一个简洁、专业的图层中。专为厌倦了滞后指标、准备以清晰视角交易的严肃交易者打造。   重要提示:本指标专为 Heikin Ashi(平均足)K 线设计。使用前请将图表切换为 Heikin Ashi,以释放其全部威力。全部分析都围绕 Heikin   Ashi 的价格流构建。正是在这里,Apex Market Structure Pro 发挥出最佳表现。   交易者为何选择 Apex Market Structure Pro:   流动性,一览无遗: 瞬间看清止损池所在之处。卖方与买方流动性会被自动标注。实时关注尚未被扫的价位,捕捉价格攫取流动性并反转的精确时   刻。在聪明钱交易的地方交易。   会说话的结构:
OmniSync Projection
Antonio-alin Teculescu
5 (1)
Chronos Fractal Engine is an innovative price projection indicator for MetaTrader 5, designed to transform your technical analysis by intelligently identifying and projecting historical price patterns. Built upon an advanced correlation algorithm and the fractal principles of the market, this powerful tool visualizes potential future price movements, giving you a unique edge in your trading decisions. What is Chronos Fractal Engine? At its core, the Chronos Fractal Engine employs a sophisticat
Meravith MT5
Ivan Stefanov
5 (3)
做市商工具。 Meravith 将: 分析所有时间周期并显示当前正在运行的趋势。 标注流动性区域(成交量均衡区),即多头与空头成交量相等的位置。 在您的图表上直接显示来自不同时间周期的所有流动性水平。 生成并展示基于文本的市场分析供您参考。 根据当前趋势计算目标位、支撑位和止损位。 计算交易的风险回报比。 根据您的账户余额计算仓位大小,并估算潜在利润。 在市场出现重大变化时,Meravith 还会发出警告。 指标的主要线条: 多头/空头成交量衰竭线 —— 作为目标位使用。 趋势线 —— 指示市场趋势方向。根据市场是多头还是空头而改变颜色,并作为趋势支撑。其颜色主要反映市场情绪。 成交量均衡线(Eq)—— Eq(Volume Equilibrium)是系统的核心。它表示买卖双方成交量的平衡点,即市场流动性所在位置。向上突破 Eq 表示多头倾向,向下突破 Eq 表示空头倾向。突破后,应等待回调——当价格回到相反趋势的偏离线或衰竭线附近时。 使用方法:只需将其添加到图表中。 Meravith 可以分析一切——趋势和回调。 趋势线与某条成交量衰竭线之间的距离越大,说明该方向的成交量越高。 趋势
==================================================================== SMC Pro v6.1 APEX AI — XAUUSD Gold Empire MetaTrader 5 指标 · Smart Money Concepts · 预测智能引擎 ==================================================================== SMC Pro v6.1 APEX AI 是一套专业的 Smart Money Concepts 指标系统,专为 MetaTrader 5 上的 XAUUSD(黄金)打造。 它将完整的 SMC 框架——Order Blocks、Liquidity sweeps(流动性扫荡)、Fair Value Gaps、Break of Structure、Change of Character——与 8 个全新的 AI 驱动模块相结合,直接在图表上呈现精准的可视化信号、预测轨迹线、彩色的 SL/TP 风险回报框,以及三级自适应 TP Ladde
“ Dynamic Scalper System MT5 ”指标专为在趋势波内进行剥头皮交易而设计。 已在主要货币对和黄金上进行测试,并可与其他交易工具兼容。 提供顺势短线建仓信号,并提供额外的价格变动支持。 指标原理: 大箭头决定趋势方向。 在趋势波内,我们采用一种生成小箭头形式的剥头皮交易信号的算法。 红色箭头代表看涨方向,蓝色箭头代表看跌方向。 敏感的价格变动线会沿着趋势方向绘制,并与小箭头信号协同作用。 信号运作方式如下:当线在适当时刻出现时,将形成入场信号;在出现线时,持仓;线完成后,平仓。 建议的操作时间范围为M1 - H4。 箭头在当前K线上方形成,如果下一根K线已开仓,则不会重新绘制上一根K线上方的箭头。 输入参数 Trend Wave Period - 趋势方向(大箭头)的周期,改变趋势波的时间间隔。值 1 表示趋势方向的最长持续时间,参数值越大,持续时间越短。 Scalper Arrows Period - 信号箭头(小箭头)的计算周期,改变入场信号的生成频率。值 3 表示最频繁的生成频率,参数值越大,箭头频率越低,准确度越高。 这些参数可以根据不同
VTrende Pro
Andrii Diachenko
5 (1)
VTrende Pro - MTF indicator for trend trading with a display panel for MT5 *** Videos can be translated into any language using subtitles (video language - Russian) Although the signals of the VTrende Pro indicator can be used as signals of a full-fledged trading system, it is recommended to use them in conjunction with the Bill Williams TS. VTrende Pro is an extended version of the VTrende indicator. Difference between Pro version and VTrende: - Time zones - Signal V - signal 1-2 waves -    S
This indicator automatically detects internal & swing market structure, Fibonacci Retracement and Fibo Levels. Features Full internal & swing market structure labeling in real-time Fibonacci Retracement Fibonacci Levels After purchasing the indicator, the full source code is provided, and via indicator buffers it can be easily integrated into your Expert Advisors (EAs) for automated trading strategies.
Euro Escalper
Cristofher Robles
Euro Escalper— Zhuan Ye Ji Gou Ji Tou Pi Zhi Biao Euro Escalper shi yi kuan gao xing neng jiao yi zhi biao, zhuan wei xu yao ji gou ji jing zhun ru chang de jiao yi zhe she ji. Shi yong yu he cheng zhi shu (Deriv), wai hui ji MetaTrader 5 shang de ren he zi chan. Jie he le ji yu Fibonacci de liu dong xing qu yu, nei zhi SuperTrend yin qing he shi shi zhuan ye kong zhi mian ban. Zhu Yao You Shi Wu Chong Hui: Xin hao jian tou jin zai K xian shou pan shi chu xian, yong yuan bu hui yi dong huo xiao
CGE Trading Suite
Carl Gustav Johan Ekstrom
5 (2)
Institutional-Grade Analytics for MT5 The full analytical edge of a professional trading desk, built into your MT5 chart. CGE Trading Suite is an indicator system of 20 integrated modules covering market structure, timing, momentum, volume and capital flow, combined into a single chart-based workspace. Why CGE Trading Suite? The suite empowers traders with structure, confidence, and consistent performance across all markets and time frames. Hover over any signal or tool on the chart to instant
Meravith Scanner
Ivan Stefanov
5 (3)
MERAVITH SCANNER 是一款适用于 MetaTrader 5 的专业金融市场指标,将多种分析工具整合为一个统一的系统。它基于专有的成交量加权平均价格(VWAP)方法自动完成所有计算,完全消除主观判断。 该指标适用于所有资产类别(外汇、股票、指数、大宗商品、加密货币)以及从 M1 到 Monthly 的所有时间周期。其核心原理是价格跟随成交量。MERAVITH 识别机构资金成交量的集中区域,并从该集中区域中推导出数学上精确的价格水平。它不预测,不推测。它只计算。 使用 MERAVITH SCANNER,您可以在 2–3 分钟内扫描全部 28 个主要外汇货币对的所有时间周期。您也可以扫描任何您选择的市场——例如,大约 100 只股票约需 10 分钟。 该指标计算耗尽水平、平衡线、偏差、统计水平以及目标投射。 图表元素 Origin Point 标记所有计算的起始位置。指标会自动将其放置在最佳位置。红色标签(TOP)表示市场高点并带有看跌倾向。绿色标签(BOTTOM)表示市场低点并带有看涨倾向。 Sentiment Line 是一条动态曲线,反映基于成交量加权计算得出的市场情绪。
Big Player Range
Thalles Nascimento De Carvalho
5 (3)
BigPlayerRange — 适用于沪深300和美元人民币的最佳MT5指标 探索 BigPlayerRange 的强大功能,它被认为是用于 沪深300、上证指数、USD/CNH 等资产的 MetaTrader 5 最佳指标 。该工具能精准识别机构主力的关键区域,帮助交易者进行高精度的技术分析。 指标工作原理: BigPlayerRange 绘制两个水平区域,通过成交量分析反映市场能量: 绿色区域 :买方防守位置,支撑价格。 红色区域 :卖方压制位置,形成阻力。 使用策略: 收盘价突破绿色区域上方 :可能开启上涨趋势,目标为上方区间。 收盘价跌破红色区域下方 :暗示下跌压力增强,目标为下方支撑。 价格停留在区间内 :行情震荡,等待突破信号。 核心优势: 机构活动区域识别 :提前发现主力进出场信号。 自动计算的目标价格 :提供两个明确的止盈位置。 回调概率分析 :优化风险控制,提升稳定性。 参数个性化设置: 自定义交易时间与成交量类型(Tick或真实成交量)。 使用机构逻辑提升日内交易效率。 推荐搭配
SMC Institutional Suite
Catur Cipto Nugroho
SMC Institutional Suite v3.7 Professional Smart Money Concept Indicator for MetaTrader 5 What is New in Version 3.7 - Visual Stability Update This release focuses entirely on one goal: making every zone, label, and line on your chart rock-solid stable. There is no more flickering, no more zones disappearing on a new candle, and no more duplicate drawings. Order Block (OB) zones no longer flicker or disappear. Once drawn, they stay permanently on the chart. Equal Highs and Equal Lows (EQH / EQL)
Gold Xausd Hunter
Metin Erkamoglu
5 (1)
MATADOR GOLD XAUUSD M5 Scalp Signals for MT5 MATADOR GOLD is a decision-support indicator for MetaTrader 5, designed for traders who analyze short-term Gold movement on the M5 timeframe. The indicator does not open, close, or manage trades automatically. It provides buy and sell signal guidance so the user can make their own trading decisions according to their risk plan, broker conditions, and trade management rules. Main purpose MATADOR GOLD is built to help traders avoid noisy signal flow and
Footprint 是一款用于分析订单流 (Order Flow) 和成交量的指标。 它有助于在聚类层面识别市场结构,寻找活动增加的关键区域,并直接在图表上使用过滤器,无需不断打开设置窗口。 Footprint 指标功能 Bid x Ask, Delta 聚类图表; 图表上的控制面板; 用于调整过滤器的滑块; Absorption; Initiative; Stacked Imbalances; Big Trades; dPOC / Dynamic Point of Control; Delta; 侧边市场轮廓 (Market Profile); 累计 Delta (Cumulative Delta)。 核心优势 在密集的 Tick 流上快速计算和渲染数据; 图表内管理 — 主要模式和过滤器可直接在图表上切换,无需打开设置; 通过过滤突出显示重要的价格水平和聚类; 视觉信号高亮:吸收、主动性、失衡和大单交易; 按日、周或当前可见范围显示的侧边轮廓; 包含总成交量、Delta 和累计 Delta 的面板。 Footprint 帮助您确定: 重要成交量集中的位置; 主动性压力出现的位置;
ZIVA Signal Intelligence
Hassan Abdullah Hassan Al Balushi
ZIVA Signal Intelligence An Adaptive, Modular Market Intelligence System ZIVA Signal Intelligence is not positioned as a conventional trading indicator. It is a fully integrated, proprietary market intelligence system engineered to deliver structured, high-precision interpretation of price behavior within a controlled analytical environment. Developed through an independent architectural approach, ZIVA does not rely on, derive from, or replicate existing indicators. It represents a standalone
First time on MetaTrader, introducing IQ Star Lines - an original Vedic Astrology based indicator. "Millionaires don't use astrology, billionaires do" . - J.P. Morgan, Legendary American financier and banker. Welcome to  the new and updated  IQ Star Lines , the ultimate fusion of ancient planetary harmonic cycles and modern quantitative trading. published for the   first time on Metatrader. This is an indicator built by the developer, who has spent almost 2 decades trading while studying Vedic
筛选:
无评论
回复评论