PivotRadar

How it works
A fresh read, every week. At the start of each trading week, PivotRadar re-anchors its zones to that week's opening structure. Nothing carries over stale from the week before — every week starts clean.
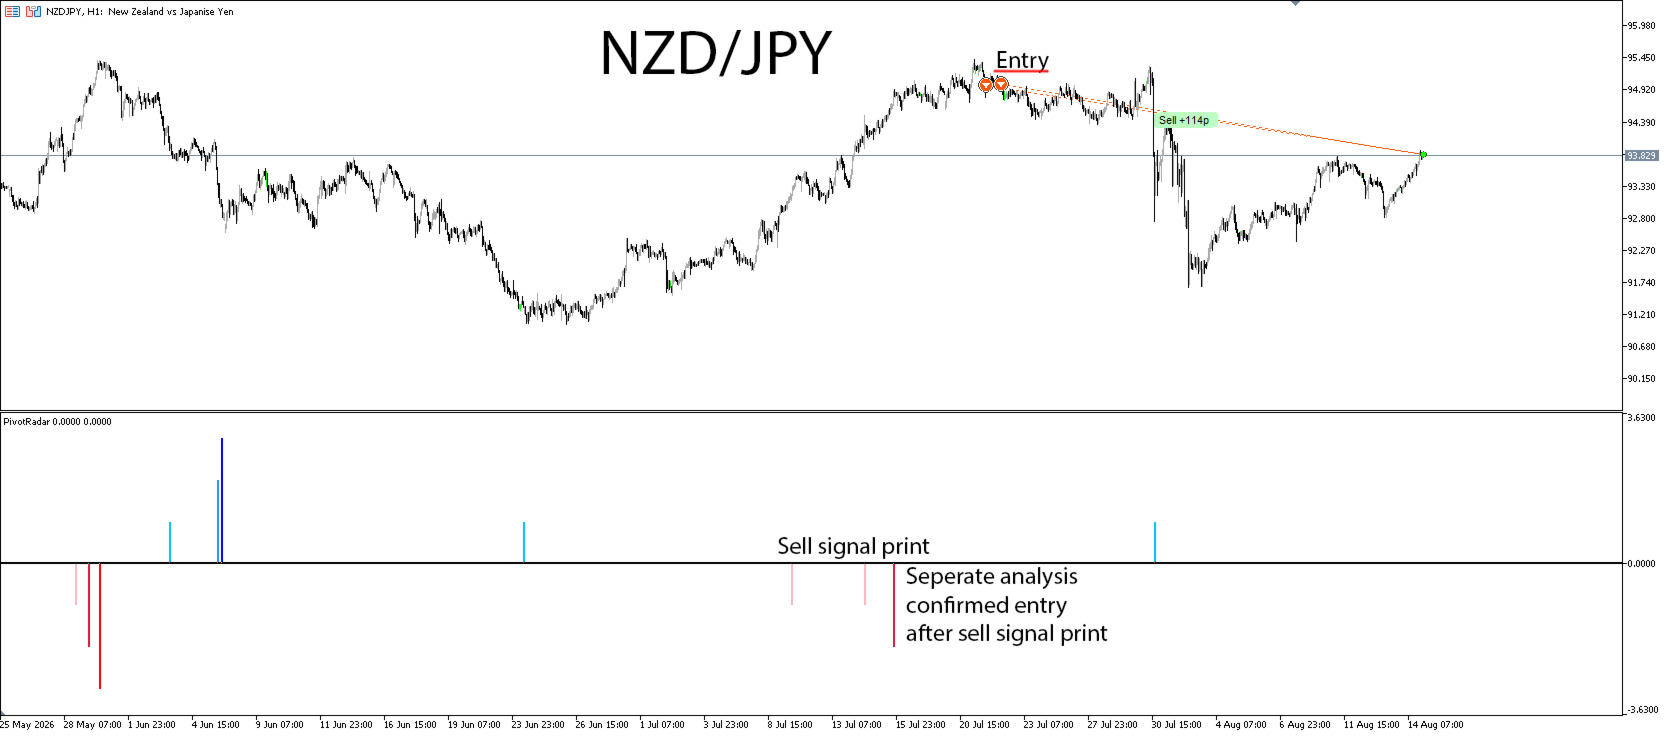
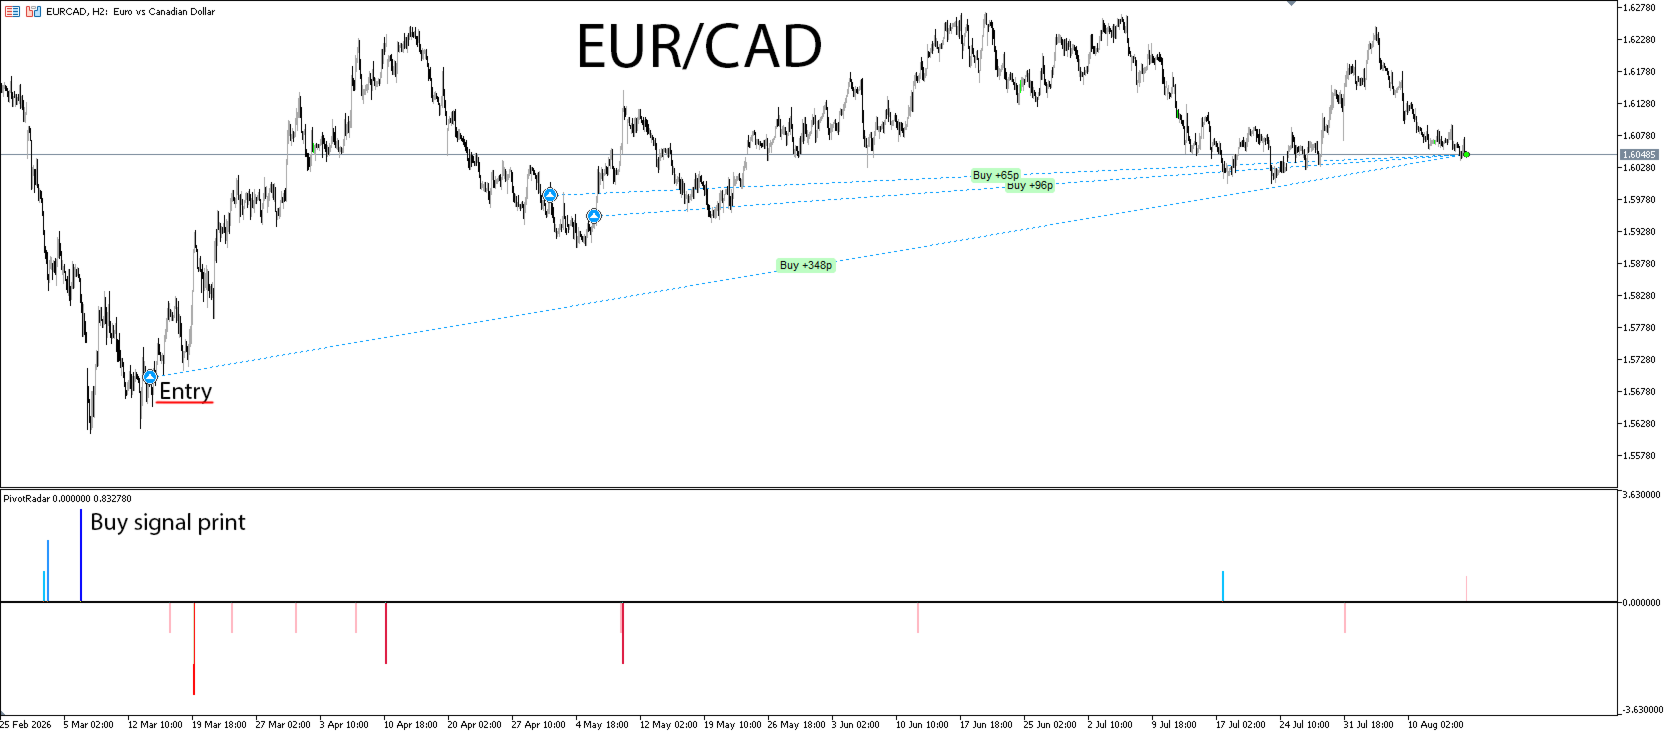
Three graduated tiers, both directions. As price works deeper into a zone, PivotRadar tracks it through three escalating tiers — a shallow first warning, a stronger mid-level signal, and an extreme-zone alert. This works for both potential upside and downside reversals, tracked independently, so you get a genuine two-sided read on the market rather than a one-directional bias.
Fires once, not on repeat. Each tier only signals the first time it's reached in a given week. You won't get flooded with the same alert firing over and over while price sits in a zone — one clean signal per tier, per week, per direction.
Built for discretion. Signals appear as clean, adjustable-width markers in a dedicated indicator window, color-coded by severity — so at a glance you know not just that something happened, but how significant it was.
What you get
Independent buy-side and sell-side signal tracking, each with its own three-tier escalation
Fully adjustable signal colors, so it fits whatever chart theme you already use
Adjustable signal width and direction (flip either side up or down to suit your layout)
Built with forex and indices in mind, and works on other instruments too — futures, stocks, ETFs, and beyond — provided you manually adjust the settings to fit that instrument's own price behavior (see "Honest limitations" below)
Configurable week-start day, for traders whose trading week doesn't begin Monday
A dedicated, uncluttered signal window that stays out of your way until it has something to say
How traders use it
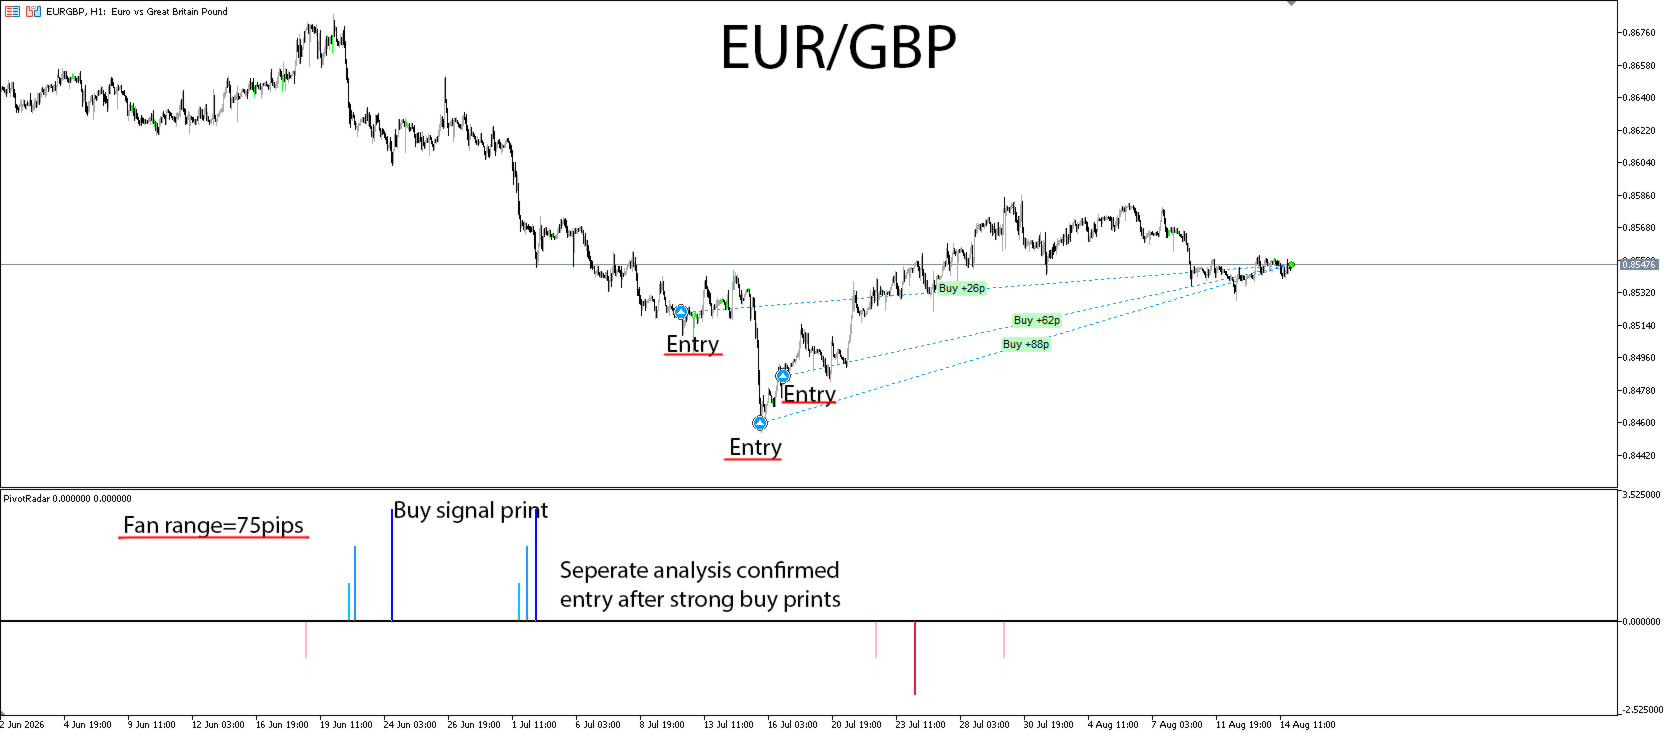
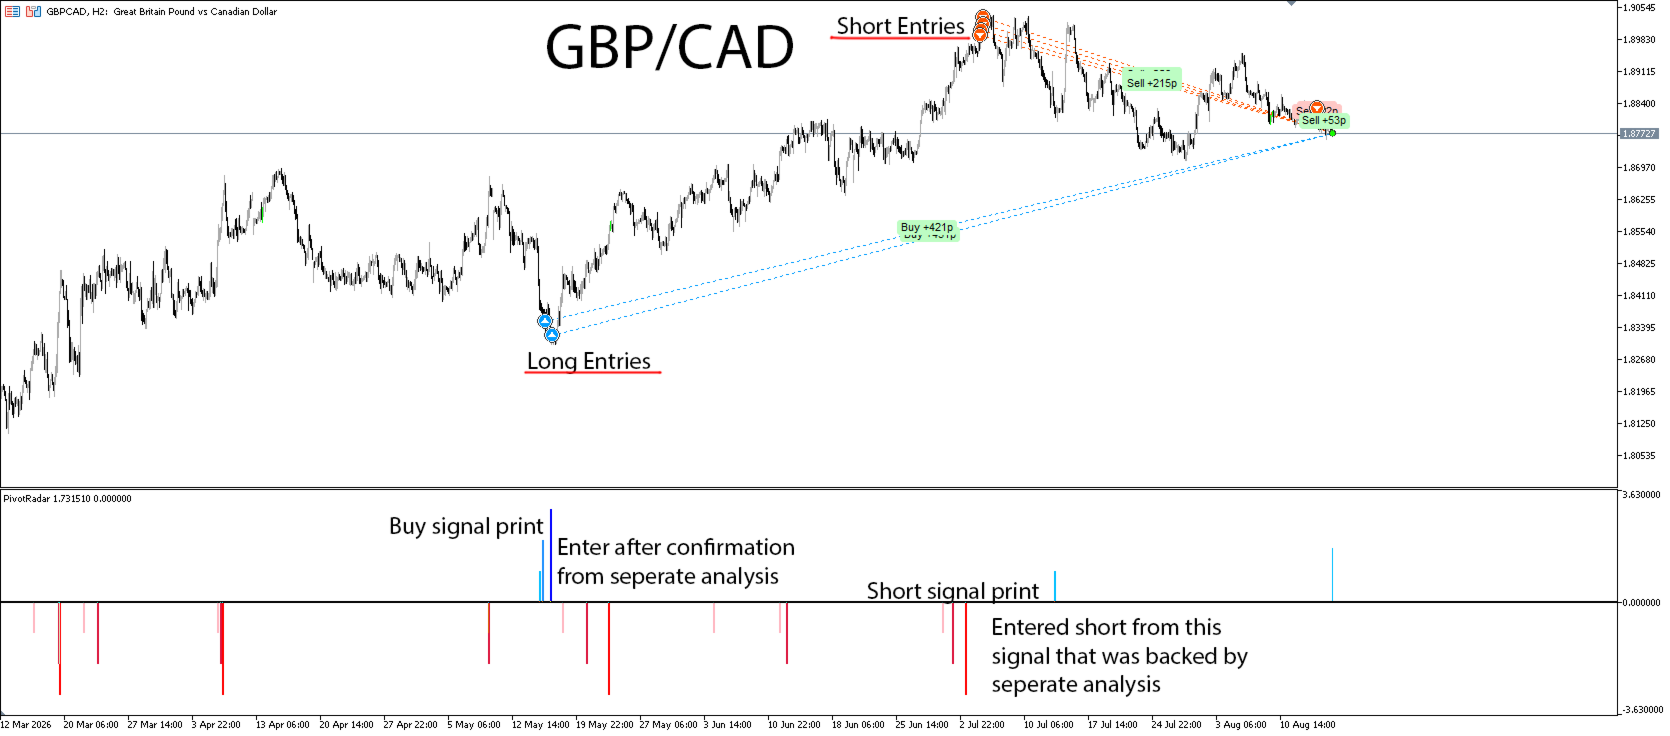
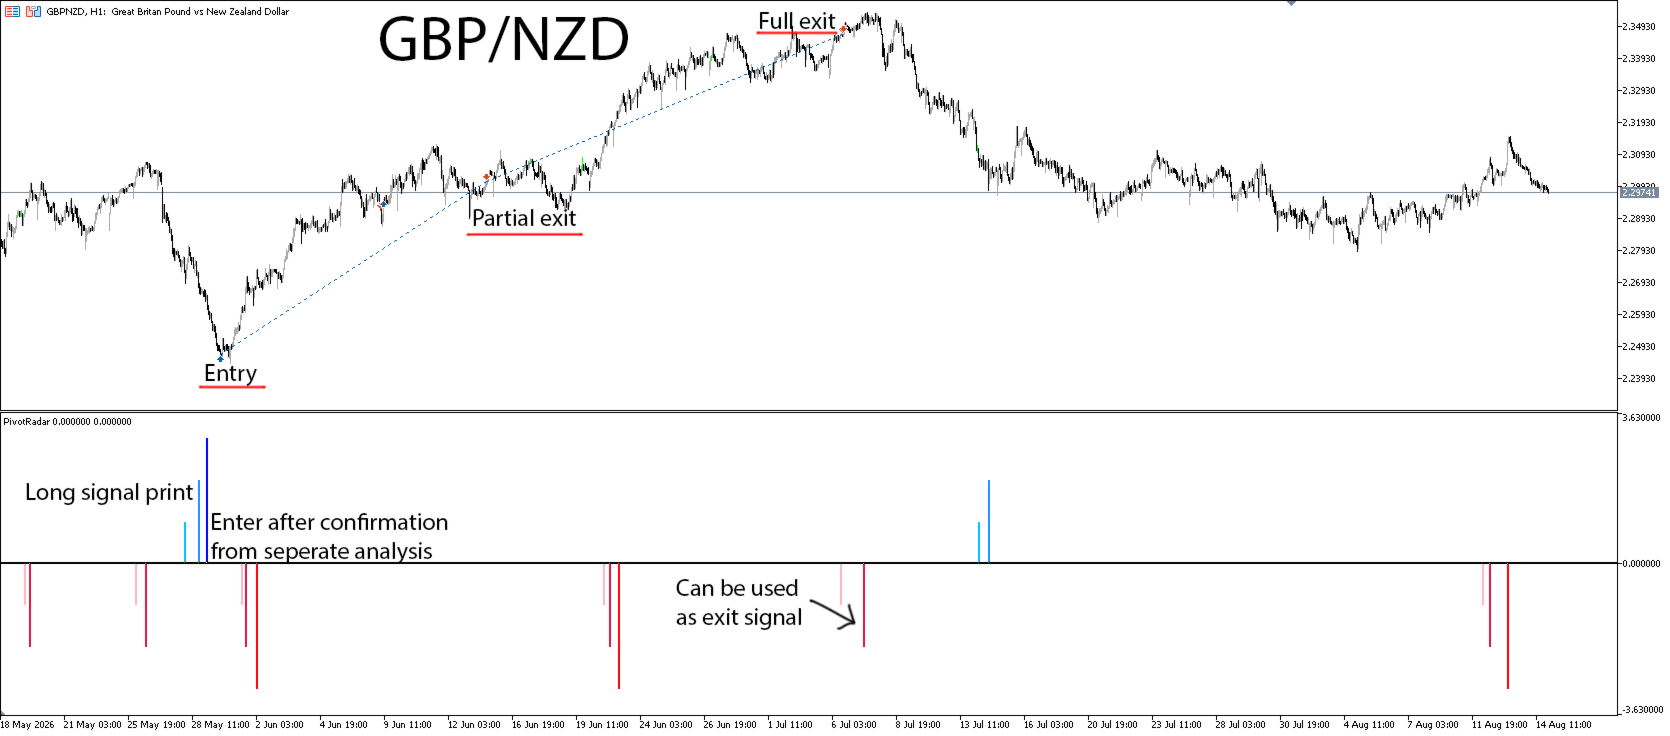
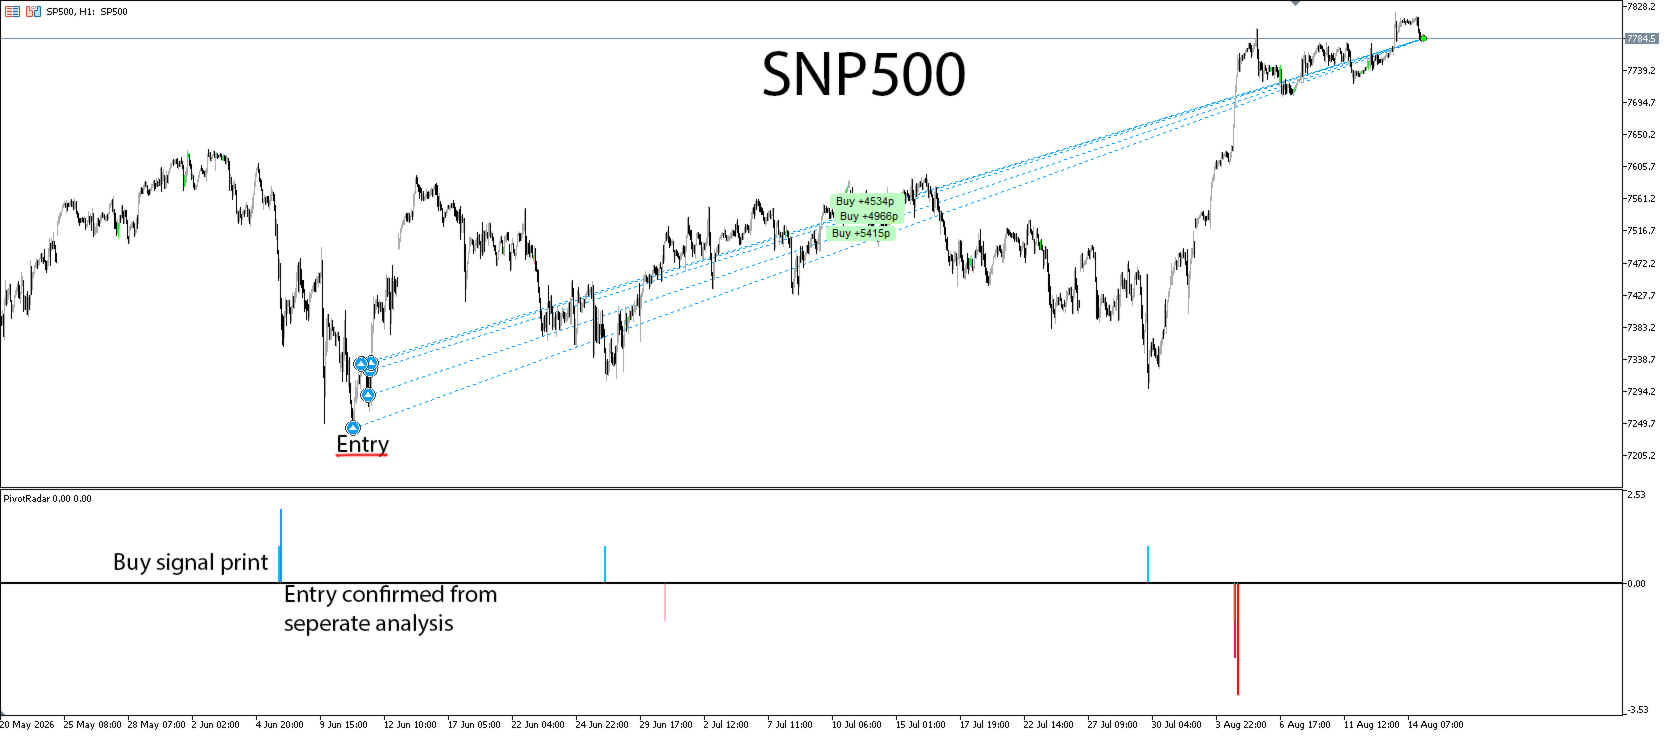
PivotRadar isn't a standalone "buy here, sell here" system, and we won't pretend it is. It's a structural warning layer — a way to know, without staring at the chart all week, that price has worked its way into a zone worth paying attention to. Most traders use it alongside their own confirmation tools: price action, a trend filter, or their own support/resistance analysis. Think of it as the thing that taps you on the shoulder and says "look here now" — not the thing that makes the decision for you.
The three-tier structure exists because not every touch of a zone is equally significant. A shallow first-tier signal might just be noise inside a broader trend. A third-tier extreme signal is a genuinely rare, high-conviction event worth real attention. PivotRadar lets you calibrate how seriously to take each one, rather than treating every alert the same.
This is not a scalping tool. Because zones reset weekly and each tier only fires once, PivotRadar isn't going to hand you a stream of signals throughout the day, every day — if you're in and out of the market on a minute-by-minute basis, this isn't built for that rhythm. It's designed with swing and positional trading in mind, where a handful of well-placed weekly signals is the point, not a limitation. That said, shorter-term opportunities can still be taken when a signal does occur — plenty of traders will see a tier fire and use it as the trigger for a faster-turnaround trade — but always in conjunction with your own methods and analysis, not as a standalone entry signal on its own.
Reading a signal in context
PivotRadar tells you where price has reached, not what kind of move got it there — that second part is on you, and it's the difference between using this tool well and using it badly.
The tool is at its most powerful after price has already made an extended move — not at the start of one. A buy signal that prints after a selloff off the weekly highs is a genuinely different situation than a buy signal that prints while price is in the middle of a steep, established downtrend. Both can technically trigger the same tier — PivotRadar only measures distance from the weekly anchor, not the character of the trend that got price there. Telling those two situations apart is exactly the "your own judgment about the broader trend" piece we mean when we say to use this alongside your own analysis, not instead of it.
The pattern to look for: after an extended rally, a pulldown into the zone can produce a legitimate buy signal — you're watching a pullback inside strength, not a fresh breakdown. The mirror is true for sells: after an extended decline, a bounce into the zone can produce a legitimate sell signal — a rally inside weakness, not the start of a new uptrend. In both cases, the signal means more because it's happening against a move that's already run its course, not at the front edge of a fresh one.
What this tool is not for: treating every buy signal as a reason to immediately expect (or chase) a sell signal shortly after, or flipping straight from a long to a short the moment the opposite side fires. A signal on one side doesn't cancel or predict a signal on the other — read each one in its own trend context, not as a ping-pong pair.
Honest limitations
No indicator predicts the market, and we're not going to claim this one does. PivotRadar tells you where price has moved to relative to its own weekly structure — it doesn't know why, and it doesn't manage your risk for you. Use it with a stop loss. Use it with your own judgment about the broader trend.
PivotRadar is built and tuned with forex and indices in mind — that's where its default settings are calibrated to behave well out of the box. It works on other instruments too, including futures, stocks, and ETFs, but every market moves differently, and the defaults won't automatically fit an instrument they weren't built around. If you're running this on anything outside forex and indices, plan to manually adjust the relevant settings to match that instrument's own price behavior before trusting it — and backtest on your own instruments and timeframes before trading it with size, since behavior genuinely varies across different markets' volatility profiles.


SETTINGS

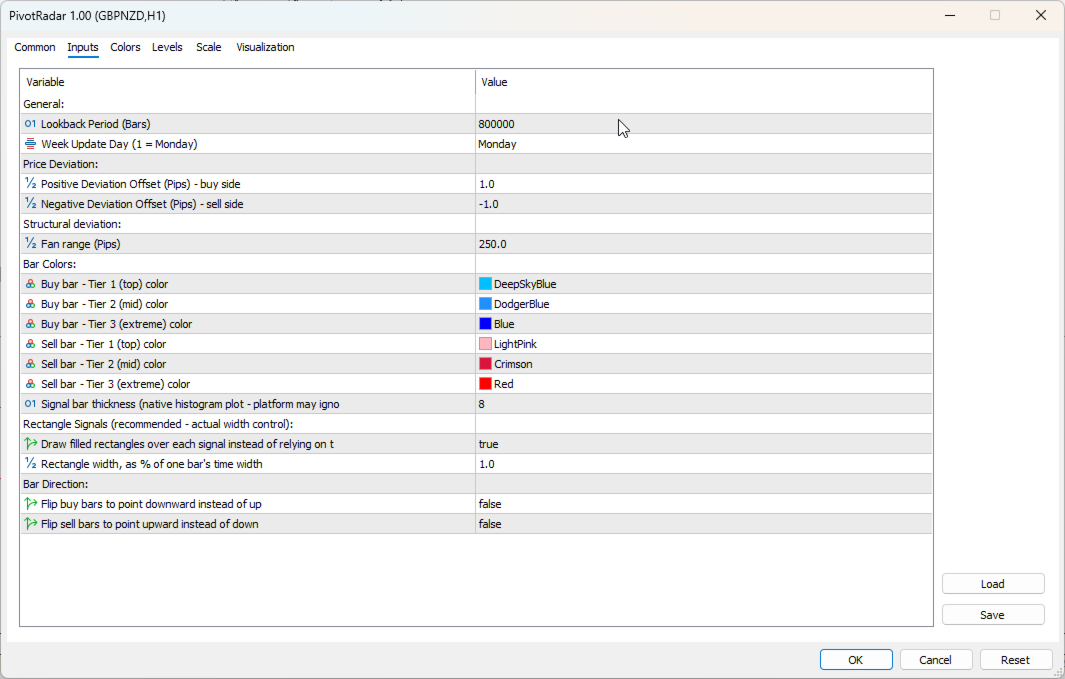
PivotRadar — Settings Guide

A quick reference for what each setting does. Everything here can be adjusted from the Inputs.

Lookback Period

How far back PivotRadar scans, in bars, when it first loads on a chart — this is what lets it rebuild every past weekly zone and signal across your available chart history, not just what happens from today forward.

Default: 800,000 bars — deep enough to cover essentially any amount of history your broker provides.

When to touch it: Rarely. Lower it only if you're on a very long history chart and want a faster initial load, and don't care about seeing older signals.

Week Update Day

Sets which day of the week PivotRadar treats as the start of a new cycle — this is the moment both the buy-side and sell-side zones reset fresh for the week ahead.

Default: Monday.

When to touch it: If your instrument's trading week effectively starts on a different day in your broker's server time, or you simply prefer to align the reset to a different day for your own planning.

Price Deviation

Two settings — one for the buy side, one for the sell side — that control how closely the tool's internal reference point tracks price. This is one of two settings governing how sensitive PivotRadar is before anything can be considered for a signal.

Default: 1 pip on both sides.

When to touch it: Advanced use only. This is a core sensitivity setting, not a cosmetic one — test any change thoroughly on your own instrument and timeframe before trusting it, ideally in the Strategy Tester before going live with it.

Fan Range

Sets how wide a zone PivotRadar watches around each week's anchor point, in pips. This is the second core sensitivity setting, and it's the one most likely to need adjusting per instrument.

Default: 250 pips.

When to touch it: This is the setting to tune first if you move PivotRadar to a different instrument. Every market has its own natural weekly range — a fast-moving pair or index can blow through a zone sized for a calmer one, while that same zone might be nearly unreachable on something slower. There's no universal right number here; back-test on your specific instrument before committing to a new value.

Bar Tiers

Controls the appearance of the three severity tiers on each side — Tier 1 (shallow), Tier 2 (mid), Tier 3 (extreme) — independently for buy and sell. Includes color per tier, overall bar width, and (recommended) the rectangle-signal width percentage, which gives more reliable thickness control than the native bar width setting alone.

Default: Light-to-dark blue for buy (shallow to extreme), light-to-dark red for sell.

When to touch it: Entirely cosmetic — adjust freely to match your chart theme. The tier structure itself (which signal counts as which severity) doesn't change; only how it looks does.

Bar Direction

Two on/off switches that flip which way each side's bars point. By default, buy signals point upward and sell signals point downward.

When to touch it: Personal preference only — some traders prefer both sides pointing the same direction, or the reverse of the default layout. Purely visual; has no effect on when or why a signal fires.


Prodotti consigliati
Fibozonesv1pro
Ignacio Souza Hermida
FiboMaster Pro — Automatic Fibonacci with Entry, SL & TP Automatic swing detection and Fibonacci levels with entry, stop loss, and take profit zones, drawn on any instrument and timeframe. FiboMaster Pro automatically detects the most recent swing high and swing low on your chart and draws the full Fibonacci retracement along with reference entry, stop loss, and two take profit levels — no manual drawing required. HOW IT WORKS The indicator scans the last N candles (configurable), identifies the
Smart Pivot Points per MetaTrader 5: Livelli chiari per un trading intelligente Smart Pivot Points è un indicatore professionale per MetaTrader 5 che calcola e visualizza automaticamente un set completo di livelli di trading chiave sul grafico. Trasforma il caos dell'andamento dei prezzi in una mappa chiara e strutturata, evidenziando supporto, resistenza, equilibrio dei prezzi e potenziali zone target. Progettato per i trader che apprezzano la chiarezza, lo strumento funziona su qualsiasi merc
Liquidity Map
Alex Amuyunzu Raymond
Liquidity Map  Overview The Liquidity Map indicator is an advanced visualization tool based on ICT Smart Money Concepts . It automatically identifies daily Buy Zones , Sell Zones , and Liquidity Levels , showing where price is likely to reverse or continue based on institutional order flow. It calculates key levels from the daily session — such as the previous day’s high, low, and midpoint — then derives a premium (sell bias) and discount (buy bias) structure. When price trades into these mapped
SMA Fibonacci EA
Christoph Kreher
Simple EA with 1 SMA and Fibonacci. The Expertadvisor opens positions in the direction of the trend when price levels have exceeded or fallen below the Fibonacci levels. It depends on the market in question and which parameters to use. The EA is programmed in such a way that optimization runs consume little time. A news filter and filter by day of the week are built in.
Mogalef Bands MT5
Victor Tengo Quiles
Mogalef Bands — Dynamic Range Structure & Target Zones (MT5) Mogalef Bands is a visual market-structure indicator that models price as a dynamic range that shifts in stages. Instead of relying on isolated “signals”, it provides contextual levels to: identify where price is currently “working” (operating zone), locate potential extension areas (targets), and filter market noise through a non-impulsive, stable update logic (with inertia). It is designed for discretionary traders who want clear lev
HenGann
Ehsan Kariminasab
Hengann Sq, using artificial intelligence, mathematical algorithms, Fibonacci, 9 Gann and Fibonacci square strategy, which enables us to have win rate of 200% profit per month. Initial investment for minimum capital of $100 to $1000, you be able to adjust the volume, date, hour, day and profit limit. adjustable profit limit in both buy and sell positions. Able to place orders in all time frames from 5 minutes to a week. further adjustment enables you to open the position according your desir
Automatically plots the 'Golden Fibonacci Ratio’ between the High and Low of the previous day... ...Highs and Lows are great Support and Resistance zones. Breakouts of Fibonacci levels are key points for entry and exit of trades. Pink lines indicate that the previous day's Candle closed lower. Blue colored lines indicate that the previous day's Candle closed higher.
DM IND Exclusive
Sergio Vidal Prado
Indicador Para Opções Binarias. Indicator for Binary Options Usa dois gales. Instalar em mt5 Esse indicador é para ser usado no tempo de vela de 5 minutos e em M5. Este também funciona em M1, porém é mais eficiente em M5. Só descompactar e copiar os arquivos na pasta de dados do seu MT5. Arquivos indicator na pasta MQL5 - Indicator. Baixe também a Media Movel totalmente gratis: https://www.mql5.com/pt/market/product/50400 Esse Indicador é para a próxima vela. Apareceu a seta, só aguardar a próx
mql4 version:  https://www.mql5.com/en/market/product/44606   Simple indicator to calculate profit on fibonacci retracement levels with fixed lot size, or calculate lot size on fibonacci levels with fixed profit. Add to chart and move trend line to set the fibonacci retracement levels. Works similar as default fibonacci retracement line study in Metatrader. Inputs Fixed  - select what value will be fix, lot or profit Fixed value  - value that will be fix on all levels Levels  - levels for which
Fibonacci MT5
Konstantin Chechnev
Fibonacci EA MT5 is an Expert Advisor for automating trading based on Fibonacci levels. It determines the minimum and maximum prices over a specified number of bars, builds Fibonacci levels, and opens trades when the current price reaches the selected levels. The EA can trade with the trend or against it, depending on the given parameters. It also allows you to configure levels for closing trades, risk management, and time filters. Features Automatic detection of local extremes and the construct
Fibo Nova
Talal N Z Aljarusha
‖ Fibo Nova ‖ Fibonacci Strategy Indicator Turn Fibonacci into a Complete Trading Plan Fibo Nova transforms structured Fibonacci opportunities into a clear visual setup — from Entry Zone and Stop Loss to TP1, TP2 and TP3. ENTRY Automatically highlighted Fibonacci Entry Zone RISK Clear Stop Loss reference and invalidation TARGETS TP1 • TP2 • TP3 mapped directly on the chart Stronger Zones. More Than Fibonacci. Fibo Nova combines Fibonacci precision, market structure and setup quality insid
CChart
Rong Bin Su
Overview In the fast-paced world of forex and financial markets, quick reactions and precise decision-making are crucial. However, the standard MetaTrader 5 terminal only supports a minimum of 1-minute charts, limiting traders' sensitivity to market fluctuations. To address this issue, we introduce the Second-Level Chart Candlestick Indicator , allowing you to effortlessly view and analyze market dynamics from 1 second to 30 seconds on a sub-chart. Key Features Support for Multiple Second-Level
UNIVERSAL RISK TRADE MANAGER MT5 Control Your Risk. Protect Your Capital. Trade with Confidence. Successful trading is not only about finding the right entry. It is about controlling how much you can lose when the market moves against you. Universal Risk Trade Manager MT5 is a professional risk-management and trade-execution assistant designed to calculate position sizes, protect trading capital, and manage open trades directly from a clear, easy-to-use chart panel. Whether you trade Forex, Gold
Double Fractal Entry Bot trades automatically using fractal breakouts or rebounds. It detects precise entry points, places SL and TP based on market structure, and includes logic to manage risk and avoid false signals. Simple, smart, and powerful. This product is also available for MetaTrader 4 =>  https://www.mql5.com/en/market/product/143609 Double Fractal Entry Bot is an intelligent trading robot based on the proven logic of the Double Fractal Entry indicator. It analyzes price using upper a
Mtf Rsi Fusion
Hadi Pourkerman
5 (1)
MTF RSI Fusion è un oscillatore per MetaTrader 5 che combina un indice di forza relativa (RSI) base con fino a due fonti RSI opzionali. Ogni fonte ha intervallo temporale, periodo e prezzo applicato configurabili. Le fonti aggiuntive hanno pesi e modalità di combinazione separati. Mostra la linea Fusion RSI, colori di tendenza opzionali e zone adattive di ipercomprato e ipervenduto basate sull’intervallo medio reale (ATR). La direzione può utilizzare candele di intervalli superiori, pendenza di
Aurum Reversion Pro MT5
Olaoluwa Oluwaseun Bamitale
Aurum Reversion Pro Aurum Reversion Pro is a professionally developed Expert Advisor designed for traders who want a structured, automated approach to trading Gold (XAUUSD) . Built with a strong focus on automation, flexibility and risk management, Aurum Reversion Pro combines intelligent trade management with configurable protection features to provide a streamlined trading experience. The EA is optimized for XAUUSD (Gold) and is recommended for the M15 (15-minute) timeframe . For best operatin
Master Dow Jones EA
Sergio Tiscar Ortega
Investment Philosophy Master Dow Jones EA is a high-precision algorithmic trading system specifically engineered for the Dow Jones Industrial Average (DJ30/US30) . Unlike generic trading systems, this algorithm exploits the structural bullish bias inherent in the top 30 U.S. blue-chip companies by operating exclusively on the Long Side . This specialization significantly reduces exposure to erratic short-side volatility and aligns the strategy with long-term institutional capital flows. Strategy
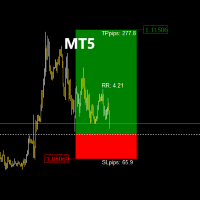
The   TradeManagerRR Visualizer MT5   is a trade management indicator designed for traders who want to easily visualize their Take Profit (TP) and Stop Loss (SL) levels on a chart. This initial version provides a simple graphical representation that displays SL and TP zones as well as the entry price. Please note that this current version focuses solely on the graphical display of SL and TP zones as figures on the chart. Current Version Features: SL and TP Zones Display:   Clear visualization of
Fibonacci Retracement EA
Choawana Malaikitsanachalee
Fibonacci Retracement EA for MetaTrader 5 Fibonacci Retracement EA is an Expert Advisor that shows Fibonacci-based trading logic directly on your chart. It builds a Fibonacci box from recent candles, shows where it is waiting to enter, and manages each trade with break-even and trailing stop rules. It was built to help traders learn and test a rule-based approach. Please test it on a demo account before using real money. How It Works 1. Fibonacci box: the EA finds the high and low of recent
FibonacciPRO
Antonio Gutemberg Frota
Fibonacci Pro Fibonacci Pro is an automatic Fibonacci indicator for MetaTrader 5 designed to identify the current market movement and draw clean retracement and extension levels directly on the chart. It detects the relevant swing high and swing low of the active move, then plots key Fibonacci levels with clear labels, making it easier to analyze pullbacks, continuation zones, and potential reaction areas. Main Features Automatic Fibonacci drawing based on the current market movement Detects swi
FREE
SLL Struct
Akarat Premprat
SLL Struct is a market structure and cycle Fibonacci indicator for MetaTrader 5. It is designed to help traders visualize confirmed price swings, identify Bull and Bear market structure, classify breakout behavior, and display cycle-based Fibonacci extension levels directly on the chart. Main features: • Confirmed Swing High and Swing Low structure • Bull and Bear market structure visualization • Complete and Neck Break classification • Divergence-aware structure classification • Candidate c
"Manual channel drawing? Not anymore. Let the market structure reveal itself automatically." "Track long-term price zones 24/7, in real-time." Real Trader Pain Points Identifying pivot points manually takes   huge time   and   effort Difficult to adapt to   high volatility   and pinpoint   reliable channels Copy Ideas "Markets never sleep. Why should your analysis stop?" "Dozens of assets a day—how do you keep up?" Core Claim AutoChannels   automatically reads market structure , reducin
NEXA Donchian Break 1. Panoramica del prodotto NEXA Donchian Break è un Expert Advisor automatizzato progettato per identificare zone di breakout dei prezzi basate sul Canale di Donchian ed eseguire operazioni solo quando vengono soddisfatte condizioni tecniche aggiuntive. Questo prodotto è distribuito gratuitamente per finalità educative e di ricerca , consentendo agli utenti di comprendere la relazione tra la logica di breakout, i filtri di trend e la struttura di stop loss e take profit attra
FREE
Gordian Knot 1
Hidenori Tanaka
This EA is a simple automated trading system for the Meta Trader 5 platform. It uses parabolic SAR to automatically adjust lot size based on market trends. By this, the EA does not take a large amount of risk, but instead steadily accumulates profits. Main Features The EA does not use the martingale method for lot size adjustment. If a position is taken before the forex market closes, the position will be carried over to the weekend. This EA is designed to hold multiple positions at the same t
BALOGUN SMC ELITE — Professional Smart Money Concepts Indicator KEY FEATURES: Strict BUY/SELL Alternation — Only 1 BUY followed by 1 SELL (no signal spam) Non-Repainting Signals — Signals confirmed on closed bars only Zone-Limited NO TRADE Markers — Clear visual zones showing when NOT to trade Multi-Factor Confluence Scoring — 0-100% quality score per setup Professional Dashboard — Real-time trend, confluence, and signal status Multi-Channel Alerts — Popup, Push, Email, and S
Phoenix Fibonacci
Nigel Nii Darku Narnor Darko
This indicator, often referred to as an Auto-Fibonacci Retracement Tool, is a technical analysis script designed to identify potential support and resistance levels based on the "Golden Ratio." Unlike the standard manual tool, this version automatically scans a specific lookback period (e.g., the last 100 candles) to find the absolute Swing High and Swing Low, drawing the levels for you in real-time. How to Use it for Trading 1. Entering a BUY Trade (Long) You use the Fibonacci levels to find "
FREE
HTF Open Markers + ICT Silver Bullet Zones — Usage & Strategy Guide What it draws Session 1 / Session 2 lines : vertical lines at the open of every bar on two independently configurable higher timeframes (defaults: H4 and D1), including a projected line for the rest of today's not-yet-opened bars on sub-daily timeframes, so you can see where the next candle will open before it happens. ICT Silver Bullet zones : shaded rectangles over the three classic ICT kill-zone windows, converted from New Yo
FREE
PREDATOR PULSE AI TRADER Premium · By Prometheus Neural Systems Most trading indicators are built once, calibrated on historical data, and left to run. They don't adapt. They don't learn. When the market changes — and it always does — they keep firing the same signals based on conditions that no longer exist. Predator Pulse was built on a different idea. Two Engines Working Together The foundation is a 60-feature institutional microstructure engine. Every bar, it analyses sixty distinct aspects
ENGLISH VERSION (for MQL5 Market) Product Description: RSI Trend & Volatility Dashboard (Multi-Timeframe Filter) This professional dashboard provides traders with an ultimate market overview inside a single chart. It continuously monitors the trend direction across 5 timeframes simultaneously: M5, M15, M30, H1, and D1 [MQL5]. No more tedious chart switching or multi-window clutter – see everything from quick scalping moves to global institutional daily trends in real-time [MQL5]. Key Adva
Gli utenti di questo prodotto hanno anche acquistato
Azimuth Pro
Ottaviano De Cicco
5 (7)
Azimuth Pro V2: Synthetic Fractal Structure and Confirmed Entries for MT5 Overview Azimuth Pro is a multi-level swing structure indicator by Merkava Labs . Four nested swing layers, swing-anchored VWAP, ABC pattern detection, three-timeframe structural filtering, and closed-bar confirmed entries — one chart, one workflow from micro-swings to macro-cycles. This is not a blind signal product. It is a structure-first workflow for traders who care about location, context, and timing. 1. What Change
SQN Max indicator for MT5 by ITC
Renaud Herve Francois Candel
Sqn Max Indicator Sqn Max is an exclusive indicator to trade the market with high effectiveness. The indicator is based on price action, volatility and trend. This indicator is as simple as possible but not too simple. The indicator can generate alerts to ease the trading process. You don't have to stay all day in front of your screen. The indicator can be used with any class of assets and with any time frame. It is possible to achieve better results trading our list of selected assets. We achi
Naked Forex Tweezer Pro Indicator Tweezer Pro Indicator is a pattern recognition indicator for Forex, Stocks, Indices, Futures, Commodities and Cryptos. The standard Tweezer is a two bar pattern. Our enhanced version is a multi-bar pattern. We filter the patterns for you so that you only get the     best and most effective patterns   and ignore the noise. The Tweezer pattern is a simple and effective pattern to trade. The strategy that comes with the Tweezer is based on price action. The Twe
Fx Levels Premium Indicator Support and Resistance are important concepts in trading. Fx Levels Premium was created to easily draw important levels of support and resistance for the active trader. The indicator will give you all important levels (support/resistance) to watch for a wide range of assets. Trading without these levels on your chart is like driving a car for a long journey without a roadmap. You would be confused and blind. Support and resistance levels should be used as guideline
Boba Analysis Suite
Trade Ready Solutions LLC
5 (2)
Boba Analysis Suite Boba Analysis Suite è un indicatore di analisi per MetaTrader 5. Riunisce la struttura del mercato, le zone di prezzo rilevanti e il contesto generale del mercato in un’unica visualizzazione del grafico. Sviluppato sulla base dell’esperienza pratica come trader e formatore di trading, supporta un processo di analisi strutturato: valutare la direzione del mercato, individuare livelli importanti e analizzare congiuntamente più intervalli temporali. Analisi nel contesto del merc
ScalpPoint
Temirlan Kdyrkhan
ScalpPoint is a powerful trading companion designed to generate high-probability entry signals with dynamic TP/SL/DP levels based on volatility. Built-in performance tracking shows win/loss stats, PP1/PP2 hits, and success rates — all updated live. Key Features: Buy/Sell signals with adaptive volatility bands Real-time TP/SL/DP levels based on ATR Built-in MA Filter with optional ATR/StdDev volatility Performance stats panel (Success, Profit/Loss, PP1/PP2) Alerts via popup, sound, push, or emai
Naked Forex Kangaroo Tail Pro Indicator Kangaroo Tail Pro Indicator is a pattern recognition indicator for Forex, Stocks, Indices, Futures, Commodities and Cryptos. The Kangaroo Tail is a multi-bar pattern. The Kangaroo Tail pattern is very effective and is very simple to trade. The strategy that comes with the Kangaroo Tail is based on price action. The indicator does what it was designed for: displaying Kangaroo Tail patterns.     Don't expect to follow the up and down arrows and make mone
The Oracle Pro
Ottaviano De Cicco
5 (1)
The Oracle Pro: Synthetic Multi-Timeframe Bias Engine for MT5 The Oracle Pro is a premium multi-timeframe bias engine for MetaTrader 5, built for demanding and professional traders. It answers one question with discipline: what is the directional bias on each timeframe right now, how strong is it, and how much do the timeframes agree? Everything is computed on closed bars only - no repainting. The Oracle Pro is a multi-factor consensus system. It combines proprietary indicators and optimized alg
ARIPoint
Temirlan Kdyrkhan
1 (4)
ARIPoint is a powerful trading companion designed to generate high-probability entry signals with dynamic TP/SL/DP levels based on volatility. Built-in performance tracking shows win/loss stats, PP1/PP2 hits, and success rates all updated live. Key Features: Buy/Sell signals with adaptive volatility bands Real-time TP/SL/DP levels based on ATR Built-in MA Filter with optional ATR/StdDev volatility Performance stats panel (Success, Profit/Loss, PP1/PP2) Alerts via popup, sound, push, or email Cu
Zain Gold Scalping
Ahmed Gamal Abdel Nasser Mohamed
Uno strumento completo di analisi della price action basato su una doppia logica di ingresso indipendente – ciascuna confermata da una banda di volatilità – e integrato da un set configurabile di nove filtri di conferma opzionali, che consentono di modulare con precisione il comportamento dei segnali, rendendoli più conservativi o più aggressivi. Strategia Fondamentale Due configurazioni di ingresso indipendenti, ciascuna delle quali si attiva solo quando il prezzo esce da una banda di volatil
CGE Trading Suite
Carl Gustav Johan Ekstrom
5 (3)
Institutional-Grade Analytics for MT5 The full analytical edge of a professional trading desk, built into your MT5 chart. A full guided tour walks you through every feature step by step. Standard retail platforms lack the depth required for professional market analysis. The CGE Trading Suite bridges this gap, transforming MetaTrader 5 into a comprehensive workspace. By integrating 18 proprietary modules into a single, unified chart interface, the suite eliminates fragmented analysis. It provide
SMC Sniper Pro MT5
Jordan Steven R Machell
SMC Sniper Pro MT5 SMC Sniper Pro by QuantFlow Labs is a chart indicator for liquidity-based intraday analysis. It combines session ranges, tracked liquidity sweeps and three selectable entry models in one configurable workspace. It displays setup context and entry references; it does not open, manage or close trades. Three selectable entry models Model 1 - Inverse Fair Value Gap breakout: after an eligible liquidity sweep, the indicator waits for a confirmed close through the relevant fair valu
VTrende Pro
Andrii Diachenko
5 (1)
VTrende Pro - MTF indicator for trend trading with a display panel for MT5 *** Videos can be translated into any language using subtitles (video language - Russian) Although the signals of the VTrende Pro indicator can be used as signals of a full-fledged trading system, it is recommended to use them in conjunction with the Bill Williams TS. VTrende Pro is an extended version of the VTrende indicator. Difference between Pro version and VTrende: - Time zones - Signal V - signal 1-2 waves -    S
QNC Scalper
Yordiana Enggelina Seko
Here is a professional and engaging description for the Indikator QNC Scalper tool in English, tailored for traders and platforms: Indikator QNC Scalper Unlock precision trading in fast-paced markets with the Indikator QNC Scalper —an advanced technical analysis tool engineered specifically for scalpers and day traders. Whether you are trading forex, crypto, or indices, this indicator cuts through market noise to deliver clear, high-probability entry and exit signals. Key Features Real-Time M
OrderFlow Absorption – Indicatore professionale di Delta e Segnali di Assorbimento per MT5 Sblocca la potenza della vera analisi del flusso degli ordini con OrderFlow Absorption – l’indicatore definitivo di istogramma delta e segnali di assorbimento per MetaTrader 5. Progettato per i trader che vogliono vedere cosa succede davvero dietro ogni movimento di prezzo, questo strumento rivela la pressione nascosta di acquisto/vendita e gli eventi di assorbimento che muovono il mercato. Caratteristiche
TrendMaestro5
Stefano Frisetti
Attenzione alle truffe, questo indicatore e' distribuito esclusivamente su MQL5.com nota: questo indicatore e' per METATRADER5, se vuoi la versione per  METATRADER4 questo e' il link:   https://www.mql5.com/it/market/product/108106 TRENDMAESTRO ver 2.5 TRENDMAESTRO   riconosce un nuovo TREND sul nascere, non sbaglia mai. La sicurezza di identificare un nuovo TREND non ha prezzo. DESCRIZIONE TRENDMAESTRO identifica un nuovo TREND sul nascere, questo indicatore prende in esame la volatilita' i
OmniSync Projection
Antonio-alin Teculescu
5 (1)
Chronos Fractal Engine is an innovative price projection indicator for MetaTrader 5, designed to transform your technical analysis by intelligently identifying and projecting historical price patterns. Built upon an advanced correlation algorithm and the fractal principles of the market, this powerful tool visualizes potential future price movements, giving you a unique edge in your trading decisions. What is Chronos Fractal Engine? At its core, the Chronos Fractal Engine employs a sophisticat
Title:FX-AIEA Supply and Demand Zone Indicator (MT5) — Technical Overview Version: 2.51 | Platform: MetaTrader 5 Introduction Supply and demand zones are considered a core manifestation of institutional order flow, providing a more direct reflection of buying and selling pressure than traditional support/resistance levels. This indicator attempts to automate the identification of high-probability supply and demand zones using an adaptive ZigZag algorithm, reducing the subjectivity and time asso
Orderflow Big Trade Svela la pressione nascosta nelle candele con le mappe di calore del Delta stimato Ti stai perdendo l'attività critica che si svolge all'interno delle candele standard? Orderflow Big Trade utilizza avanzati algoritmi di ponderazione basati sul range e sul prezzo di chiusura per stimare la pressione di acquisto e vendita su livelli di prezzo raggruppati. Invece di affidarsi solo al volume grezzo, trasforma le dinamiche della Price Action in una chiara mappa visiva del Delta
ORB Seeker MT5
Marcela Goncalves De Oliveira
Prezzo speciale per limitare la disponibilità e mantenere l'interesse per il prodotto! Solo $599! Dopo l'acquisto, contattami per ricevere in omaggio l'EA ORB Seeker e i file di configurazione personalizzati e ottimizzati. Individua con sicurezza le eruzioni cutanee durante le sessioni di allenamento! ORB Seeker MT5 è un indicatore ORB (Opening Range Breakout) professionale, pensato per i trader che desiderano precisione, semplicità, flessibilità e una struttura grafica chiara. Traccia automat
Zain Gold ScalpingV5
Ahmed Gamal Abdel Nasser Mohamed
Zain Gold Scalping V5 is a technical analysis indicator for MetaTrader 5 designed for Forex and Gold markets. It provides chart-based market information, trend analysis, signal conditions, and an on-screen dashboard to help traders analyze price movement across multiple timeframes. Main Features The indicator supports multiple timeframes, including M1, M5, M15, M30, H1 and higher timeframes. It can be used with Gold (XAUUSD), Forex currency pairs, indices and other supported instruments. The in
The indicator is designed to close positions on the market in time. For example: to take profits ahead of schedule if the price has not reached TakeProfit, and the market is turning around. The indicator analyzes the momentum, not the trend. He does not give any information about the trend. The indicator is well suited for finding divergence. The Ershov 38 Parrots indicator dynamically adjusts to the market and detects price movement impulses of medium and high amplitude. It almost does not rea
First time on MetaTrader, introducing IQ Star Lines, an original Vedic Astrology Based Intraday Trading Indicator. We don't offer free or bonus indicators in exchange of reviews from you. You won't need any free products with this indicator to make it work. ;) Enjoy! Welcome to the new and updated  IQ Star Lines , the ultimate fusion of ancient planetary cycles and modern quantitative trading, published for the first time on Metatrader. This is an indicator built by the developer, who has spent
AriX
Temirlan Kdyrkhan
1 (4)
AriX Indicator for MT5 A powerful trend-following and signal-evaluation tool AriX is a custom MT5 indicator that combines Moving Averages and ATR-based risk/reward logic to generate clear buy/sell signals. It visualizes dynamic SL/TP levels, evaluates past trade outcomes, and displays win/loss statistics in a clean on-chart panel. Key features include: Buy/Sell signals based on MA crossovers ATR-based SL/TP1/TP2/TP3 levels with visual lines and labels Signal outcome tracking with real-time stat
Meravith Scanner
Ivan Stefanov
5 (3)
MERAVITH SCANNER è un indicatore professionale per i mercati finanziari su MetaTrader 5, che integra più strumenti di analisi in un unico sistema. Esegue tutti i calcoli automaticamente utilizzando una metodologia proprietaria basata sul prezzo medio ponderato per il volume (VWAP), eliminando completamente l’interpretazione soggettiva. L’indicatore funziona su tutte le classi di asset (Forex, Azioni, Indici, Commodities, Criptovalute) e su tutti i timeframe, da M1 a Mensile. Il principio fondame
Boom & Crash & PainX & GainX Ultimate Spike Detector Trade Spikes With Confidence — Not Guesswork Catching spikes should be one of the most profitable strategies in synthetic markets. But for most traders, it becomes one of the most frustrating. You enter too early… price goes against you. You wait for a spike… it never comes. You finally catch one… but don’t know whether to hold or close. You make profit… then give it all back because there’s no exit plan. This is exactly the problem the Ultim
In poche parole Questo indicatore combina due esperti — l'RSI e il MACD — in un unico sistema. Invece di guardare due grafici separati e fare ipotesi, prende la decisione per te: quando entrambi gli indicatori sono d'accordo, disegna una freccia (acquisto o vendita). La cosa più importante: le frecce non vengono ridipinte . Una volta apparse, rimangono dove sono. Puoi fare backtest e operare in tempo reale con piena fiducia. Cosa significa "Combo" Normalmente, un trader guarda l'RSI (che misura
Meravith MT5
Ivan Stefanov
5 (3)
MERAVITH è un indicatore multi-timeframe di volume e liquidità per MetaTrader 5 che mostra il trend, le zone di supporto e resistenza, l'ingresso, gli obiettivi e lo stop loss su ogni timeframe. Ti dà una mappa completa della liquidità del mercato, uno strumento di liquidità in stile hedge fund, e fa ogni calcolo automaticamente con un metodo proprietario di prezzo medio ponderato per il volume, così non c'è interpretazione soggettiva. Funziona su Forex, oro (XAUUSD), indici e cripto, su ogni ti
Cycles Plotter
Edoardo Centorame
Cycles Plotter Indicatore di Cicli Personalizzabili con Medie Mobili e Data di Inizio Il Cycles Plotter è un indicatore tecnico avanzato che traccia due cicli sinusoidali completamente personalizzabili, solo dietro input dell’utente. Non genera cicli automaticamente: tutti i cicli vengono calcolati esclusivamente in base ai parametri impostati dall’utente, offrendo ai trader uno strumento visivo per studiare le oscillazioni di prezzo e i potenziali cambi di tendenza, senza produrre segnali o pre
Filtro:
Nessuna recensione
Rispondi alla recensione