Ershov 38 parrots MT5

The indicator is designed to close positions on the market in time.
For example: to take profits ahead of schedule if the price has not reached TakeProfit, and the market is turning around.
The indicator analyzes the momentum, not the trend. He does not give any information about the trend.
The indicator is well suited for finding divergence.
The Ershov 38 Parrots indicator dynamically adjusts to the market and detects price movement impulses of medium and high amplitude. It almost does not react to small price jumps.
The fundamental difference from classical oscillators is the dynamic overbought and oversold levels, which are considered independently of each other.
The indicator can warn about the following events:
- it's too late to enter the market,
- if you have an open deal, then you still need to hold it for some time,
- if you have an open deal, then you should close it right now,
- if you want to open a trade, the indicator may prohibit entry into the trade due to the high risk of a reversal.

Terms of Use:
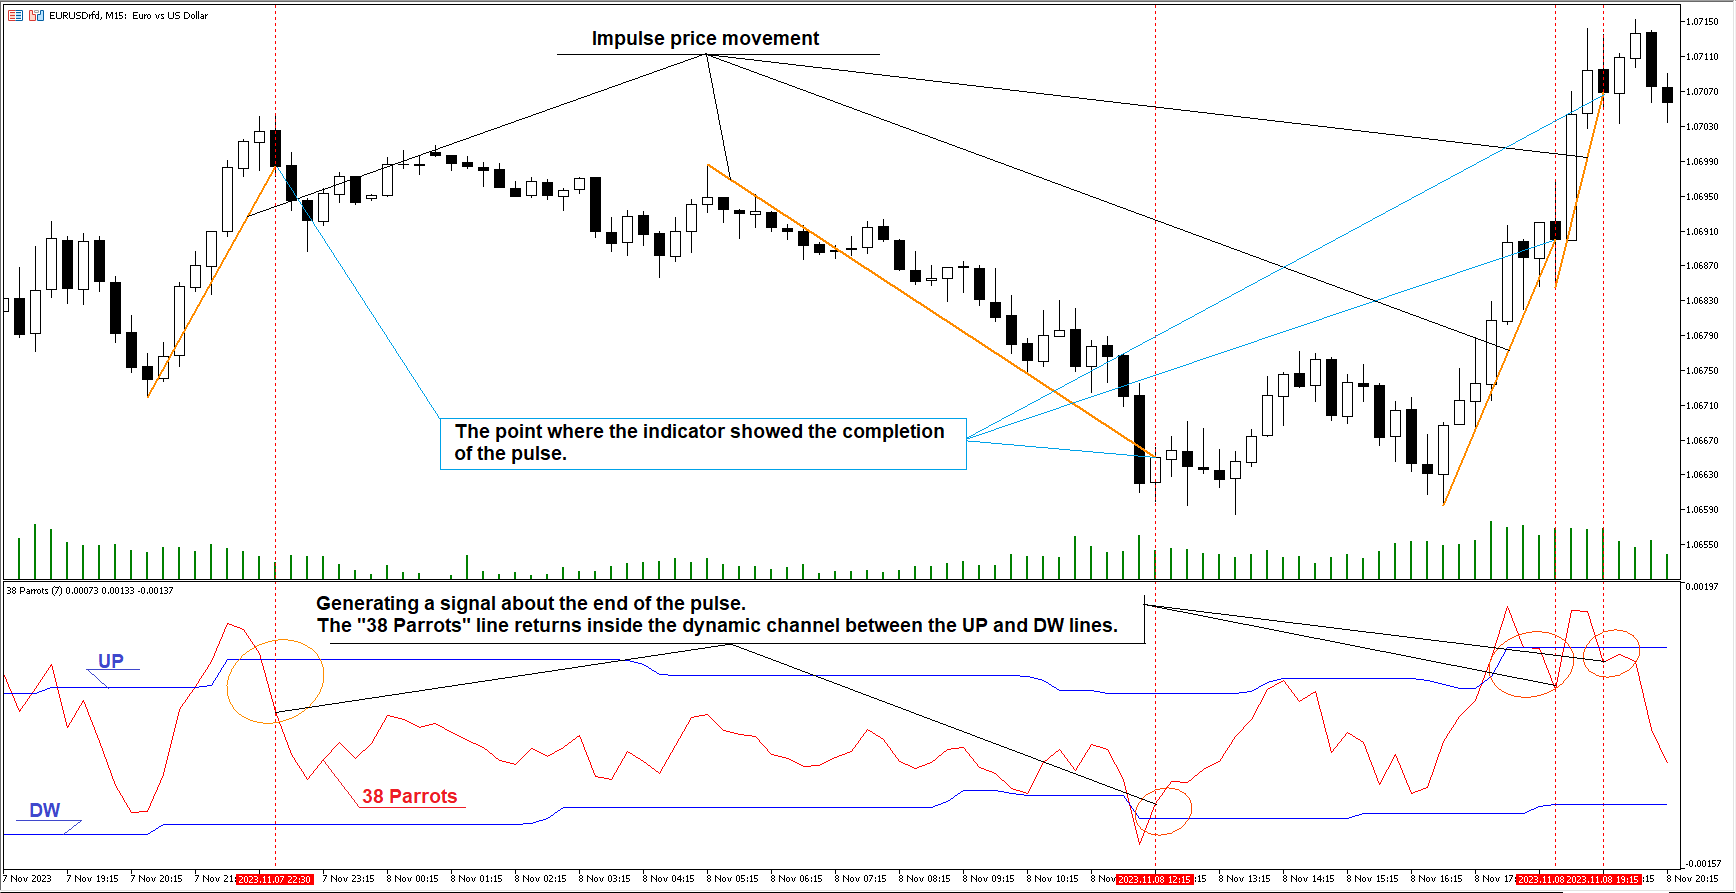
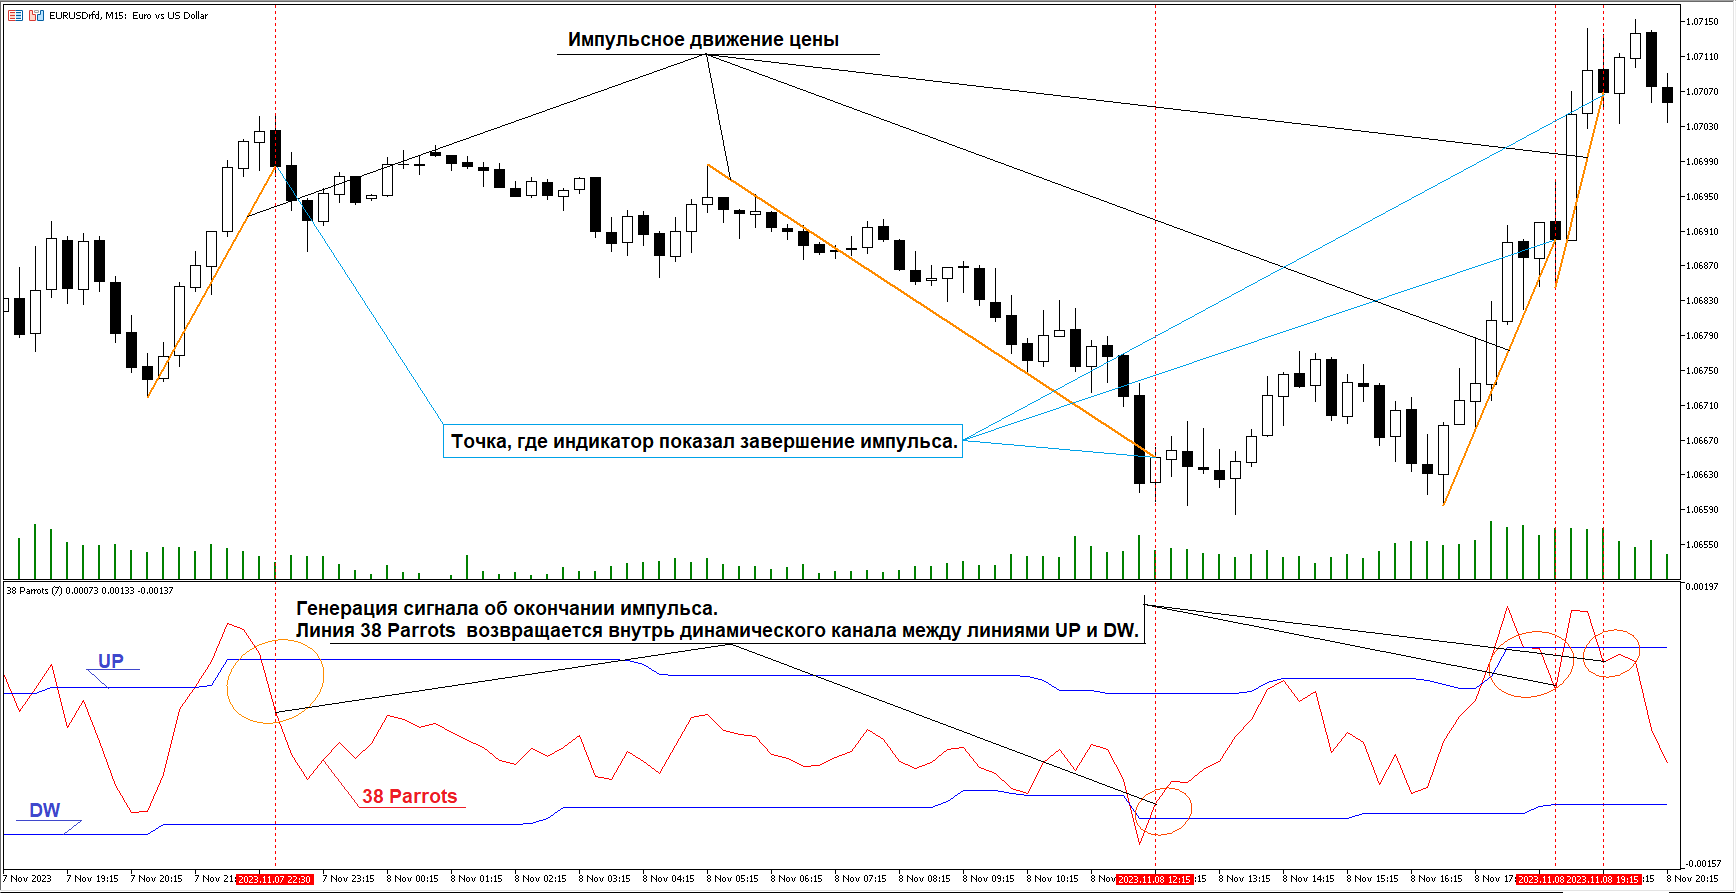
1) It doesn't matter which trading system you use. If you are trading according to the trend, it is convenient to enter the market when the 38 Parrots line is between DW and UP.
2) If 38 Parrots > UP, it is better to hold purchases if they are already made. Most likely, the growth will stop soon (within one impulse).
If 38 Parrots < DW, it is better to hold sales if they are already made. Most likely, the fall will stop soon (within a single impulse).

3) If 38 Parrots > UP, it is better not to make new purchases. Most likely, the growth will stop soon (within one impulse).
If 38 Parrots < DW, then it is better not to make new sales. Most likely, the fall will stop soon (within a single impulse).
4) If purchases were opened. After a while, you saw 38 Parrots > UP , this is a sign that you will need to close the position soon. When returning the 38 Parrots line in the interval between DW and UP, it is better to close purchases. The pulse is most likely completed.
If sales were opened. After a while, you saw 38 Parrots < DW , this is a sign that you will need to close the position soon. When returning the 38 Parrots line in the interval between DW and UP, it is better to close sales. The pulse is most likely completed.
All of the above is clearly shown in the screenshot.
The indicator is very effective in order to exit open positions in time. Has a high probability of working out. But, like all indicators, it cannot give an absolute guarantee.
おすすめのプロダクト
is a versatile analytical tool designed for both advanced traders and beginners. It combines classic trend line analysis with automatic Fibonacci level plotting to deliver precise market entries and structural clarity. Built as an intuitive and clean on-screen dashboard, this indicator simplifies multi-timeframe analysis without cluttering your main workspace. Technical Analysis and Entry Points The indicator automates the most critical aspects of price action and structural trading: Trend L

The Exclusivissimo FAB4 (Fabulous Four) Indicator is an institutional-grade chart analysis tool designed for MetaTrader 5. Built for professional traders who demand precision, this indicator automatically maps the most critical liquidity zones and momentum shifts in the market, keeping your chart clean and your entries surgical. Whether you are trading Forex, Indices, or Stocks, the FAB4 Indicator provides a complete institutional roadmap right on your screen, highlighting true market intent wit
Indicator Description Opportunity Identification Indicator — Smart Money This indicator was developed to assist in identifying moments when prices may be reaching areas of greater interest , seeking possible signals in market behavior associated with the concept of “smart money” (Smart Money) , widely discussed in financial literature and market studies. The proposal is to create a bridge between technical analysis and fundamental analysis . The indicator uses technical analysis and price behavi
Monk MT5
Nestor Alejandro Chiariello
モンク戦略、堅実で非常に安定した長期戦略。 私の戦略には、安全で長期的なエントリーパターンがあり、ライブマーケット中に発生しているニュースやフェスティバルを常に参照し、最大のリスク保護とグリッドの長期的な回復を備えており、さまざまなインテリジェントな内部メソッドを備えています。 、1 つのチャート設定で構成できる場合、1 回のクリック、低リスク/中/高、動的などの AI の快適な適応構成を確立できるようにする チャート上で EA を開始します。 現在のチャートに関係なく、アドバイザーは常にすべてのシンボルを同時に取引します。 ニュースを読んでフィルタリングするには、シンボルごとに 1 つのチャートを配置する必要があります。 任意のシンボルと任意の時間枠のチャートでアドバイザー モンクを開始できます。 現在のチャートに関係なく、アドバイザーはすべてのシンボルの月次、週次、日次チャートのデータを同時に分析します。 プロパティのいくつかの特徴 テイクプロフィットは完全に動的で、シングルとリカバリーの両方、スマート テイク プロフィット、ハイデン テイク プロフィットなど ストッ
TIF – Trend Integrity Filter Trade With the Trend. Filter the Noise. TIF (Trend Integrity Filter) is a professional trend-analysis indicator designed to help traders identify the dominant market direction and filter out lower-quality trades that go against the prevailing trend. TIF can be used as a standalone trend filter or combined with your existing trading strategy, entry indicator, price action system or Expert Advisor. KEY FEATURES Trend Integrity Analysis Helps identify the cur
Ai Scalper Pro
Dhiraj Shivprabhu Pattewar
1. Precision Entry Engine (The Edge) True-Swing Breakout Technology: The EA doesn't rely on lagging indicators. It maps live market structure, identifying localized "True Swings" (fractal highs and lows) to anticipate explosive momentum breakouts. Pre-Emptive Stacking: Anticipates major moves by placing resting Stop orders exactly at critical levels. When Gold breaks out, you are already in the trade. Daily Clean-Sweep: Every day at rollover (23:50), the bot automatically purges all resting o
Use only RAW Spread AC use SL 270 & TP 2700 1:30 risk Reward EA Key Advantages Automated, hands-free trading — no manual monitoring required once attached to the chart. Multi-layer signal confirmation — combines an RSI oscillator, Ichimoku Kinko Hyo, and a time filter before entering a trade, reducing false signals. Step trailing stop protection — profits are locked in gradually as price moves in your favor, rather than using a single static trailing distance. Built-in risk controls — fixed Stop
Smart Breakout Targets PRO for MT5 Smart Breakout Targets PROは、MetaTrader 5プラットフォーム向けに特別に開発された、インスティテューショナル(機関投資家)グレードのブレイクアウトトレードシステムです。短期のスキャルパー、デイトレーダー、そしてシステム的なスイングトレーダー向けに設計されており、市場の収縮と爆発的な価格拡大を特定するプロセスを完全に自動化します。 このシステムは、レンジのコンソリデーション(揉み合い)、局所的な流動性の蓄積、および差し迫ったボラティリティの拡大を常に監視します。検証されたブレイクアウトが発生すると、インジケーターは最適化されたエントリーポイント、ボラティリティに基づく自動ストップロス、および3つの異なるテイクプロフィットターゲットをリアルタイムでチャート上に直接計算・投影します。完全なノンリペイント(Non-Repainting)ロジックで構築されているため、シグナルはローソク足の確定時に厳密にロックされ、過去の正確性と信頼性の高いバックテストを保証します。 コアとなるトレード哲学
Linha de Variacao de Preco
Renato Fabio Santos Vasconcelos
ENGLISH VERSION PRICE VARIATION LINE – TAKE CONTROL OF THE MARKET! Turn the opening price into your strategic weapon Clearly see how many points or % the market moved Auto horizontal lines at the levels YOU define Mark entry, exit, target zones and explosive regions Clean, sharp, and professional layout Simple, powerful, and essential for any serious trader
Short description (one line): KeyLevels draws a dynamic grid of key price levels around the previous daily close — a base line plus two independent step-level grids — to highlight support and resistance zones on any chart. How it works The indicator anchors to a base price, which by default is the closing price of the previous completed daily (D1) candle. From that base it draws three sets of levels: Level 1 — Base line: a single, clearly visible anchor line at the base price (color and thick
Develop this indicator for periods of 30 minutes or more, focus on getting market trends right and making sure they are met. MFOP v8.1 gets straight to the point: it scans the market and tells you exactly when there is enough strength to enter a trade. This indicator doesn't do magic, it uses mathematical algorithms to filter out market noise, not enter into false breakouts and show you clear BUY (blue arrow) and SELL (red arrow) opportunities. It is designed and optimized specifically to take
**Semenov S Indicator — market structure without subjectivity** A professional indicator based on Smart Money Concept. It doesn’t give random signals — it shows real market structure and key areas where institutional activity is likely present. ---  What the indicator does * Identifies trend direction (including multi-timeframe context) * Automatically builds supply and demand zones (Order Blocks) * Detects key structural shifts:   * BOS (Break of Structure)   * CHOCH (Change of Character)
Trade Summary is a professional on-chart dashboard for MetaTrader 4 & 5 that provides a clear, real-time overview of your open trades. Monitor floating profit/loss, entry price, lot size, account risk, distance to stop loss, stop loss and take profit values, balance, and equity—all from one compact panel. Designed for traders who value speed and effective risk management, Trade Summary eliminates manual calculations and keeps essential information visible at a glance. It also includes a privacy
価格レベルごとの取引量の可視化。 計算期間を任意に設定できます:2本の垂直線の間、または固定時間間隔を設定。 ヒストグラムのレベルは相対的です:より幅広いバーは取引量が多いことを意味します。 分布の極端値はサポートとレジスタンスレベルとして使用できます。 すべてのスタイル、サイズ、色はカスタマイズ可能です。 多機能ユーティリティ : 66以上の機能を含む  |   質問があれば私に連絡   |  MT4バージョン インジケーターの設定で、次のように構成できます: ヒストグラムのスタイル: 視覚モード:  バー / 線 /  輪郭 / 方向 (各レベルの価格方向に依存する色のバー)。 ヒストグラムの位置:  チャート境界 / 時間範囲内 / 時間範囲外 : 左/右。 2つのヒストグラムカラー。 ヒストグラムの幅。 ヒストグラムのサイズ (% チャート幅)。 計算設定: 範囲境界のタイプ:  チャートの2線間 /  指定された最近の分 /  右境界前の指定された分 。 範囲の持続時間、分単位 (タイプ2および3の場合)。 ボリュームデータソース: 価格ティック  (ブローカーで利用可
Introduction to Fractal Pattern Scanner Fractal Indicator refers to the technical indicator that makes use of the fractal geometry found in the financial market. Fractal Pattern Scanner is the advanced Fractal Indicator that brings the latest trading technology after the extensive research and development work in the fractal geometry in the financial market. The most important feature in Fractal Pattern Scanner is the ability to measure the turning point probability as well as the trend probabil
DuhokTrend
Ismael Nayif Ismael Ismael
How to Add a Product Description (MetaTrader Market) To add the product description effectively in MetaTrader's Market, follow these steps: 1. Log into the MetaTrader Market: Go to your MQL5 account . Navigate to the "Seller's Dashboard" or "Products" section. Select your product, DuhokTrend . 2. Writing the Description: To enhance the product's rating, write a detailed and structured description : Template for Product Description: DuhokTrend - Advanced Indicator for Trend Analysis Overview:
Limitless MT5 is a universal indicator suitable for every beginner and experienced trader. works on all currency pairs, cryptocurrencies, raw stocks Limitless MT5 - already configured and does not require additional configuration And now the main thing Why Limitless MT5? 1 complete lack of redrawing 2 two years of testing by the best specialists in trading 3 the accuracy of correct signals exceeds 80% 4 performed well in trading during news releases Trading rules 1 buy signal - the ap
マーケットスコアリングシステム – 高度なマルチタイムフレーム取引インジケーター プロフェッショナル向けの市場分析システム。テクニカル指標、機械学習パターン認識、複数タイムフレームの同時確認を組み合わせ、高精度な取引シグナルを生成します。 主な特徴 マルチタイムフレーム分析: M5、H1 など複数の時間軸でシグナルを確認し、勝率を向上 スマートスコアリングエンジン: 過去 25 本のローソク足を加重分析し、トレンド・レンジ・不確実性スコアを算出 マーケットインテンション検出: 過去 6 本のローソク足とボリュームから、リアルタイムで買い/売り圧力を分析 グローバルスコア(0–100): 総合シグナル強度を示す指標。カラー付きプログレスバーを表示 ATR ベースのリスク管理: 動的なストップロス、テイクプロフィット、トレーリングストップ ADX トレンド強度フィルター: DI+/DI- を利用し、強トレンドかレンジ相場かを判定 ボリュームコンテキスト分析: 急激なボラティリティと静かな蓄積フェーズを識別 機械学習システム: パターン認識と結果追跡により、シグナルを自動適応
Ultimate Double Top & Bottom (Pro Volume Matrix) Stop trading retail breakouts. Start trading Institutional Traps. The   Ultimate Double Top & Bottom   is not a standard, lagging pattern scanner. It is a highly advanced, non-repainting structural engine equipped with a proprietary   3-Leg Volume Matrix . Designed exclusively for Smart Money Concepts (SMC) and order flow traders, this indicator mathematically dissects the tick volume inside M and W patterns to reveal true institutional intent:  
SUPER DOBLE SUAVISADOR es un indicador técnico para MetaTrader 5 diseñado para suavizar el movimiento del precio y mostrar de forma más clara los cambios de tendencia. Su objetivo principal es reducir el ruido del mercado y ayudar al trader a identificar mejor los movimientos alcistas y bajistas. El indicador trabaja como una línea tipo zigzag suavizada, donde los tramos de subida se muestran en color Agua  y los tramos de bajada en color Magenta , facilitando una lectura visual rápida del compo
このインジケーターは実践的なトレードに最適な自動波動分析のインジケーターです! 場合... 注:   Tang Lun (Tang Zhong Shuo Zen) の命名規則の影響で、私は波のグレーディングに西洋の名前を使用することに慣れていません。基本的な波を ペン 、二次波のバンドを セグメント と名付けました。同時に、 セグメント にはトレンドの方向が指定されます (この命名方法は将来のノートで使用されます。最初に言っておきます)。ただし、アルゴリズムは曲がりくねった理論とはほとんど関係がないため、付けるべきではありません。これは、私の市場分析 によって要約された、絶えず変化する複雑な運用ルール を反映しています。 バンドは標準化され、人によって異なることがないよう定義されており、市場参入を厳密に分析する上で重要な役割を果たす人為的な干渉の描画方法が排除されています。 このインジケーターを使用することは、取引インターフェイスの美しさを改善することと同等であり、元の K ライン取引を放棄し、取引の新しいレベルに連れて行きます。また、宣伝の観点から顧客の認識も向上します。 イ
KT Market Structure EA は、当社の人気インジケーター KT Market Structure インジケーター をベースに開発された、完全自動型のエキスパートアドバイザーです。インジケーターから直接、構造のブレイク(BOS)とキャラクターの変化(CHoCH)のシグナルを取得し、取引の自動化を支援する多彩な機能を備えています。  これらのシグナルと追加分析を組み合わせることで、効率的でスマートな取引を実現します。EAにはすべての依存ファイルが組み込まれているため、別途ダウンロードの必要はありません。 特徴 市場構造に基づいた自動売買: 市場構造のパターンに従って完全自動で取引を行います。長時間チャートを見られないトレーダーに最適です。 柔軟なカスタマイズと最適化: 様々な市場や時間足に合わせて設定を変更できる高い柔軟性を持ちます。 取引継続の自動復元: MetaTrader の再起動やクラッシュ後も、取引が自動的に復元されます。 リスク管理機能: ロットサイズ、ストップロス、最大ドローダウンなど、リスクを管理するための設定が豊富に用意されています。 リアルタイムシグ
Canal de Máximos y Mínimos en Escalera Indicador avanzado para MT5 diseñado para analizar el rango diario del precio y construir niveles dinámicos en forma de escalera. El indicador calcula los máximos y mínimos reales de cada día, obtiene una distancia promedio histórica y la divide según el valor configurado en INPUT_Distancia . Con esa distancia genera niveles superiores e inferiores que sólo aparecen cuando el precio los alcanza. La línea amarilla representa el centro del canal. Desde ese pu
Vectorscalper
Mahamadou Issaka Bello Poutcha
VectorScalper - Professional MTF Trend Scalper VectorScalper is a high-performance Expert Advisor (EA) engineered for traders who seek precision in aggressive scalping environments. It leverages a sophisticated Multi-Timeframe (MTF) trend analysis to ensure that every entry aligns with the dominant market momentum across multiple horizons.Unlike basic scalpers, VectorScalper uses a rigorous filtering system.
# MT5用スクイーズ・モメンタム・インジケーター MetaTrader 5向けにプロが開発した強力な**スクイーズ・モメンタム・インジケーター**で、爆発的な市場チャンスを掴みましょう。 この高度なボラティリティ・モメンタム・インジケーターは、トレーダーが大きな市場変動が起こる前の低ボラティリティ期間を特定するのに役立ちます。ボリンジャーバンドとケルトナーチャネルの強みを組み合わせたこのインジケーターは、市場が「スクイーズ」状態にあり、ブレイクアウトの準備をしているタイミングを明らかにします。 内蔵のモメンタム・ヒストグラムにより、トレンドの方向とモメンタムの変化を容易に把握でき、トレーダーは自信と精度を持ってトレードを行うことができます。 ## 機能 * 高度なスクイーズ検出システム * プロフェッショナルなMT5実装 * 急激なブレイクアウト前にボラティリティスクイーズを検出 * 動的な色変化を伴うモメンタムヒストグラム * 市場状況を容易に把握できるスクイーズステータスドット * 以下の指標を組み合わせ: * ボリンジャーバンド * ケルトナーチャネル * 線
Brilliant Reversals MultiCurrency Scanner MT5は、複数の通貨ペアにおける潜在的な反転ポイントを特定しようとするトレーダーのために設計された最先端のトレーディングインジケーターです。高度なアルゴリズムを活用することで、このツールは瞬時に洞察を提供し、トレーディング戦略を最適化しようとする初心者と経験豊富なトレーダーの両方にとって非常に貴重です。 このインジケーターは、市場の状況に基づいてリアルタイムの売買シグナルを提供することで、トレーダーの意思決定を強化し、取引パフォーマンスを向上させます。包括的なダッシュボードとアラート機能を備えており、主要な通貨ペアを簡単に監視し、市場の機会に迅速に対応できます。 MQL製品のインストールガイド | MT4/MT5で購入したMQL製品の更新 | 一般的なトラブルシューティングガイド | インジケーター設定 / ガイド 主な特徴 バッファ統合: インジケーターの値をアクセス可能なバッファとして公開し、Expert Advisorがシグナルベースのトレーディングを効果的に利用できるようにします。 視覚的矢印シ
======================================== AST PENDULUM  ======================================== All advertised figures = the SAFE default configuration (backtest, clearly labeled). Martingale is an optional feature that is OFF by default. Signal:  https://www.mql5.com/de/signals/2383435 Set Datei:  https://www.mql5.com/de/market/product/189805/comments?source=Site +Profile#comment_60202495 ---------------------------------------- SHORT DESCRIPTION  ---------------------------------------- Fades
XFlow shows an expanding price channel that helps determine the trend and the moments of its reversal. It is also used when accompanying transactions to set take profit/stop loss and averages. It has practically no parameters and is very easy to use - just specify an important moment in the history for you and the indicator will calculate the price channel. DISPLAYED LINES ROTATE - a thick solid line. The center of the general price rotation. The price makes wide cyclical movements around the
Emotions are a weakness. QHO mathematics is the future of your trading! You know what really truly frustrating?  Information garbage and noise. All those legacy, lagging indicators on the charts look like an attempt to steer a rocket ship with a steam engine. They are useless. They look at the past while the market is already flying forward on next-gen tech. We created QHO. This is not just another indicator. This is pure mathematics crushing market chaos right on your chart. Imagine completely
Tomamos 5 medios móviles las unimos en una la cual suavizamos y volvemos a suavizar, resultando un mega suavizador de medios móviles suavizadas. Indicador de mql5 funciona en cualquier broker y para todos los tiempos, siendo el mas optimo el de 5, 15 a mas. Funciona mejor en grupo consigo misma osea poner uno de 14 y otro de 50 y 400,, así se observa mejor su desempeño.
このプロダクトを購入した人は以下も購入しています
ARICoin is a powerful trading companion designed to generate high-probability entry signals with dynamic TP/SL/DP levels based on volatility. Built-in performance tracking shows win/loss stats, PP1/PP2 hits, and success rates all updated live. Key Features: Buy/Sell signals with adaptive volatility bands Real-time TP/SL/DP levels based on ATR Built-in MA Filter with optional ATR/StdDev volatility Performance stats panel (Success, Profit/Loss, PP1/PP2) Alerts via popup, sound, push, or email Cust
PrimeScalping is a powerful trading companion designed to generate high-probability entry signals with dynamic TP/SL/DP levels based on volatility. Built-in performance tracking shows win/loss stats, PP1/PP2 hits, and success rates — all updated live. Key Features: Buy/Sell signals with adaptive volatility bands Real-time TP/SL/DP levels based on ATR Built-in MA Filter with optional ATR/StdDev volatility Performance stats panel (Success, Profit/Loss, PP1/PP2) Alerts via popup, sound, push, or e
note: this indicator is for METATRADER4, if you want the version for METATRADER5 this is the link:  https://www.mql5.com/it/market/product/108106 TRENDMAESTRO ver 2.5 TRENDMAESTRO recognizes a new TREND from the start, he never makes mistakes. The certainty of identifying a new TREND is priceless. DESCRIPTION TRENDMAESTRO identifies a new TREND in the bud, this indicator examines the volatility, volumes and momentum to identify the moment in which there is an explosion of one or more of these da
MasterTrend Indicator for MT5 A powerful trend-following and signal-evaluation tool MasterTrend   is a custom MT5 indicator that combines Moving Averages and ATR-based risk/reward logic to generate clear buy/sell signals. It visualizes dynamic SL/TP levels, evaluates past trade outcomes, and displays win/loss statistics in a clean on-chart panel. Key features include: Buy/Sell signals based on MA crossovers ATR-based SL/TP1/TP2/TP3 levels with visual lines and labels Signal outcome tracking wit
SmartScalping is a powerful trading companion designed to generate high-probability entry signals with dynamic TP/SL/DP levels based on volatility. Built-in performance tracking shows win/loss stats, PP1/PP2 hits, and success rates — all updated live. Key Features: Buy/Sell signals with adaptive volatility bands Real-time TP/SL/DP levels based on ATR Built-in MA Filter with optional ATR/StdDev volatility Performance stats panel (Success, Profit/Loss, PP1/PP2) Alerts via popup, sound, push, or e
ScalpPoint is a powerful trading companion designed to generate high-probability entry signals with dynamic TP/SL/DP levels based on volatility. Built-in performance tracking shows win/loss stats, PP1/PP2 hits, and success rates — all updated live. Key Features: Buy/Sell signals with adaptive volatility bands Real-time TP/SL/DP levels based on ATR Built-in MA Filter with optional ATR/StdDev volatility Performance stats panel (Success, Profit/Loss, PP1/PP2) Alerts via popup, sound, push, or emai
MasterTrend Indicator for MT5 A powerful trend-following and signal-evaluation tool MasterTrend   is a custom MT5 indicator that combines Moving Averages and ATR-based risk/reward logic to generate clear buy/sell signals. It visualizes dynamic SL/TP levels, evaluates past trade outcomes, and displays win/loss statistics in a clean on-chart panel. Key features include: Buy/Sell signals based on MA crossovers ATR-based SL/TP1/TP2/TP3 levels with visual lines and labels Signal outcome tracking wit
相場が本当は何をしているのかを見抜く。   3つの市場フェーズ(収縮・拡張・トレンド)を目の前でライブに捉え、トレンド・フェーズの初期段階でより優れたエントリーを取りましょう   。      当て推量はもう終わり。機関投資家やスマートマネーのように相場を読み始めましょう。   Apex Market Structure Pro(MT5版)は、ノイズを取り除き、あらゆるローソク足の下にある真の構造を見せる高精度のスマートマネー分析ツ   ールです。流動性、構造転換、蓄積ゾーン、トレンドバイアスを、ひとつのクリーンでプロフェッショナルなオーバーレイに集約します。遅行   指標に見切りをつけ、明晰さをもってトレードする準備のできた本気のトレーダーのために作られました。   重要:本インジケーターは Heikin Ashi(平均足)ローソク足での動作を前提に設計されています。使用前にチャートを Heikin Ashi   に設定し、その真価を解き放ってください。分析のすべては Heikin Ashi の価格の流れを軸に構築されています。Apex Market Structure Pr
AriX
Temirlan Kdyrkhan
1 (4)
AriX Indicator for MT5 A powerful trend-following and signal-evaluation tool AriX is a custom MT5 indicator that combines Moving Averages and ATR-based risk/reward logic to generate clear buy/sell signals. It visualizes dynamic SL/TP levels, evaluates past trade outcomes, and displays win/loss statistics in a clean on-chart panel. Key features include: Buy/Sell signals based on MA crossovers ATR-based SL/TP1/TP2/TP3 levels with visual lines and labels Signal outcome tracking with real-time stat
SMC Sweep Fvg MT5 — スマートマネーと同じ目線で、チャート上に市場を映す こんな経験はありませんか。価格がストップを巻き取り、反転し、まさに想定どおりの方向へ進む。方向は正しかった。間違えたのはエントリーだけです。 このインジケーターは、そうした場面を減らすために作られています。分析で最も重い部分——チャートのマークアップ——を引き受け、本当に重要な「判断」をあなたに残します。 チャートに表示されるもの マーケットストラクチャー — 実際の構造的高値・安値に HH / HL / LH / LL ラベルとレベルライン。トレンドが一目で分かり、推測は不要です。 インバランスゾーン(FVG) — 価格が急ぎ過ぎて通過し、後で戻りやすい領域。未埋めと既埋めのゾーンは別色で表示されます。 流動性の動き — 反転前に市場がレベルを巻き取る瞬間を追跡します。 トレード設計の完成形 — エントリー矢印、ストップロス、利益目標。すべて描画済みで、頭の中で計算する必要はありません。 トレンドフィルター — 上位足のラインで、主戦場の動きの側に立ち続けられます。 インジケーターは
VTrende Pro
Andrii Diachenko
5 (1)
VTrende Pro - MTF indicator for trend trading with a display panel for MT5 *** Videos can be translated into any language using subtitles (video language - Russian) Although the signals of the VTrende Pro indicator can be used as signals of a full-fledged trading system, it is recommended to use them in conjunction with the Bill Williams TS. VTrende Pro is an extended version of the VTrende indicator. Difference between Pro version and VTrende: - Time zones - Signal V - signal 1-2 waves -    S
CGE Trading Suite
Carl Gustav Johan Ekstrom
5 (2)
Institutional-Grade Analytics for MT5 The full analytical edge of a professional trading desk, built into your MT5 chart. Standard retail platforms lack the depth required for professional market analysis. The CGE Trading Suite bridges this gap, transforming MetaTrader 5 into a comprehensive workspace. By integrating 21 proprietary modules into a single, unified chart interface, the suite eliminates fragmented analysis. It provides definitive clarity across market structure, timing, momentum,
MERAVITH SCANNERは、MetaTrader 5用のプロフェッショナルな金融市場インジケーターで、複数の分析ツールを一つの統合システムにまとめています。独自の出来高加重平均価格(VWAP)手法を使用してすべての計算を自動で行い、主観的な解釈を完全に排除します。 このインジケーターは、すべての資産クラス(FX、株式、指数、商品、暗号通貨)およびM1から月足までのすべての時間軸で動作します。基本原理は「価格は出来高に従う」というものです。MERAVITHは機関投資家の出来高が集中するポイントを特定し、その集中から数学的に正確な価格レベルを導き出します。予測や投機は行わず、計算のみを行います。 MERAVITH SCANNERを使用すると、28の主要FX通貨ペアをすべての時間軸でわずか2~3分でスキャンできます。また、任意の市場をスキャンすることも可能です。例えば、約100銘柄の株式を約10分でスキャンできます。 インジケーターは、消耗レベル、均衡線、偏差、統計レベル、およびターゲット予測を算出します。 チャート要素 Origin Point :すべての計算が始まる起点です。イン
ZIVA Signal Intelligence
Hassan Abdullah Hassan Al Balushi
ZIVA Signal Intelligence An Adaptive, Modular Market Intelligence System ZIVA Signal Intelligence is not positioned as a conventional trading indicator. It is a fully integrated, proprietary market intelligence system engineered to deliver structured, high-precision interpretation of price behavior within a controlled analytical environment. Developed through an independent architectural approach, ZIVA does not rely on, derive from, or replicate existing indicators. It represents a standalone
Triple Crox Strategy v4.10 Triple Crox Strategy v4.10 Professional MetaTrader 5 Indicator 13 Patterns • Fibonacci • CLUSTER ML • Multi-Filter 1. Overview Advanced MT5 indicator combining 13 Pattern Detection , Fibonacci Analysis , CLUSTER Machine Learning and Multi-Filter system for precise signals on Forex, indices, commodities, crypto. 5-step pipeline: indicators → filter → patterns → signals → levels. 2. Trading Setup Heikin-Ashi colored bars. Buy/Sell arrows with Entry, TP1(1x ATR), TP2(2x
The Expert Advisor and the video are attached in the Discussion tab . The robot applies only one order and strictly follows the signals to evaluate the indicator efficiency. Pan PrizMA CD Phase is an option based on the Pan PrizMA indicator. Details (in Russian). Averaging by a quadric-quartic polynomial increases the smoothness of lines, adds momentum and rhythm. Extrapolation by the sinusoid function near a constant allows adjusting the delay or lead of signals. The value of the phase - wave s
Классификатор силы тренда. Показания на истории не меняет. Изменяется классификация только незакрытого бара. По идее подобен полной системе ASCTrend, сигнальный модуль которой, точнее его аппроксимация в несколько "урезанном" виде, есть в свободном доступе, а также в терминале как сигнальный индикатор SilverTrend . Точной копией системы ASCTrend не является. Работает на всех инструментах и всех временных диапазонах. Индикатор использует несколько некоррелируемых между собой алгоритмов для класси
FFx Universal Strength Meter PRO is more than a basic strength meter. Instead of limiting the calculation to price, it can be based on any of the 19 integrated strength modes + 9 timeframes. With the FFx USM, you are able to define any period for any combination of timeframes. For example, you can set the dashboard for the last 10 candles for M15-H1-H4… Full flexibility! Very easy to interpret... It gives a great idea about which currency is weak and which is strong, so you can find the best pai
The FFx Universal MTF alerter shows on a single chart all the timeframes (M1 to Monthly) with their own status for the chosen indicator. 9 indicators mode (MACD-RSI-Stochastic-MA-ADX-Ichimoku-Candles-CCI-PSAR). Each can be applied multiple times on the same chart with different settings. Very easy to interpret. Confirm your BUY entries when most of the timeframes are showing green color. And confirm your SELL entries when most of the timeframes are showing red color. 2 Alert Options : input to s
The FFx Watcher PRO is a dashboard displaying on a single chart the current direction of up to 15 standard indicators and up to 21 timeframes. It has 2 different modes: Watcher mode: Multi Indicators User is able to select up to 15 indicators to be displayed User is able to select up to 21 timeframes to be displayed Watcher mode: Multi Pairs User is able to select any number of pairs/symbols User is able to select up to 21 timeframes to be displayed This mode uses one of the standard indicators
FFx Patterns Alerter gives trade suggestions with Entry, Target 1, Target 2 and StopLoss .... for any of the selected patterns (PinBar, Engulfing, InsideBar, OutsideBar) Below are the different options available: Multiple instances can be applied on the same chart to monitor different patterns Entry suggestion - pips to be added over the break for the entry 3 different options to calculate the SL - by pips, by ATR multiplier or at the pattern High/Low 3 different options to calculate the 2 TPs -
MetaTrader 4 version available here : https://www.mql5.com/en/market/product/24881 FFx Basket Scanner is a global tool scanning all pairs and all timeframes over up to five indicators among the 16 available. You will clearly see which currencies to avoid trading and which ones to focus on. Once a currency goes into an extreme zone (e.g. 20/80%), you can trade the whole basket with great confidence. Another way to use it is to look at two currencies (weak vs strong) to find the best single pairs
MetaTrader 4 version available here: https://www.mql5.com/en/market/product/25793 FFx Pivot SR Suite PRO is a complete suite for support and resistance levels. Support and Resistance are the most used levels in all kinds of trading. Can be used to find reversal trend, to set targets and stop, etc. The indicator is fully flexible directly from the chart 4 periods to choose for the calculation: 4Hours, Daily, Weekly and Monthly 4 formulas to choose for the calculation: Classic, Camarilla, Fibonac
ClassicSBA
Umri Azkia Zulkarnaen
this indicator very simple and easy if you understand and agree with setup and rule basic teknical sba you can cek in link : please cek my youtube channel for detail chanel : an for detail info  contact me  basicly setup buy (long) for this indicator is Magenta- blue and green candle or magenta - green  and green candlestik and for setup sell (short) is Black - yellow - and red candle or black - red  and red candlestik
Indicador en base a la pendiente de la linea de precio, dibuja una línea de color cuando sube a base de los precios que previamente has sido procesados o linealizados, y cuando baja la pendiente la linea linealizada toma otro color. En este caso se a considerado 6 lineas de diferentes procesos desde pendientes largas hacia las cortas, observándose que cuando coincidan las pendientes se produce un máximo o mínimo, lo que a simple vista nos permitirá hacer una COMPRA O VENTA.
A scalping indicator based on mathematical patterns, which on average gives signals with relatively small SL, and also occasionally helps to catch big moves in the markets (more information in the video) This indicator has three main types of notifications: The first type warns of a possible/upcoming signal on the next bar The second type indicates the presence of a ready signal to enter the market/open a position The third type is for SL and TP levels - you will be notified every time price re
Fibonacci Múltiple 12, utiliza la serie fibonacci plasmado en el indicador fibonacci, aumentadolo 12 veces según su secuencia. El indicador fibonacci normalmente muestra una vez, el presente indicador se mostrara 12 veces empezando el numero que le indique siguiendo la secuencia. Se puede utilizar para ver la tendencia en periodos cortos y largos, de minutos a meses, solo aumentado el numero MULTIPLICA.
Recommended TimeFrame >= H1. 100% Non Repainted at any moment.  Use it carefully, only with Trend Direction. Trading Usage: 2 Variants: as Range System or as BreakOut System (Both Only With Trend Direction)::: (Always use StopLoss for minimise Risk); [1] as Range System: (Recommended) in UP TREND:  - BUY in Blue Line , then if price goes down by 50 points (on H1) open Second BUY.   Close in any Profit you wish: TrailingStop(45 points) or Close when Price touches upper Gold Line. in DOWN TREND
En base a cálculos matemáticos de determino una linea Horizontal que cruza a todas las señales de trading, mostrando los máximos y mínimos. La linea horizontal parte en dos las subidas y bajadas de las señales de trading, de tan manera que es fácil identificar los máximos y mínimos, y es inteligente por que es sensible a las subidas y bajadas, afín de no quedarse en un solo lado por siempre, trabaja excelentemente con otros indicadores suavizadores ya que les garantiza que en un intervalo de tie
this indicator is a Spike detector indicator, it is specially designed to trade Boom 1000, Boom 500, Crash 1000 and Crash 500 We recommend using it on Deriv Boom and Crash indices only Its setting is intuitive, familiar, easy to use it has notification functions; audible notifications and push notifications. this tool is simple to use, easy to handle This update is based on different strategies for spikes
フィルタ:
Varreck
29
Varreck 2023.11.29 15:25 
 

ユーザーは評価に対して何もコメントを残しませんでした

レビューに返信