How it works
A fresh read, every week. At the start of each trading week, PivotRadar re-anchors its zones to that week's opening structure. Nothing carries over stale from the week before — every week starts clean.
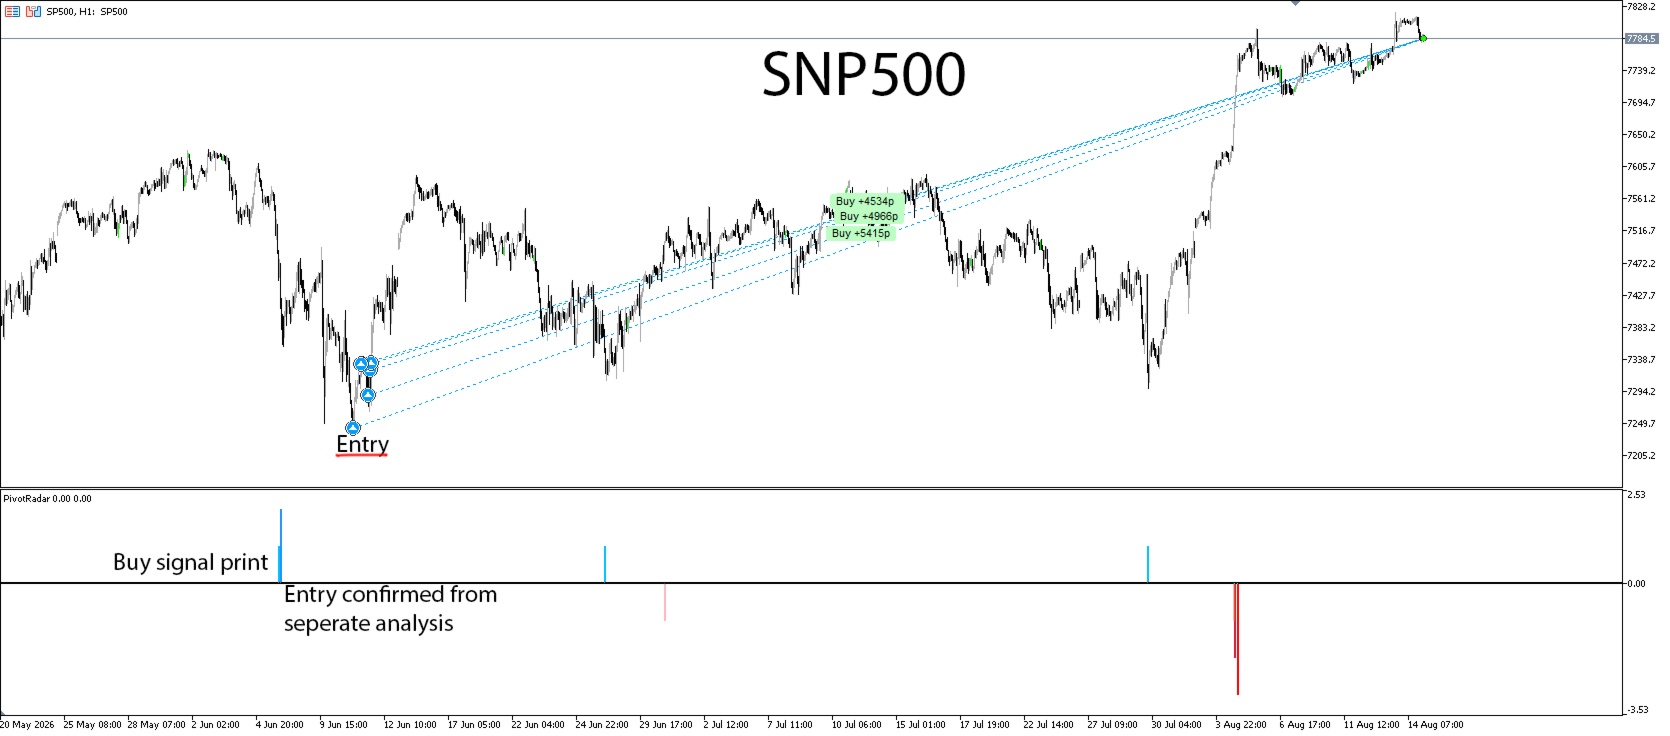
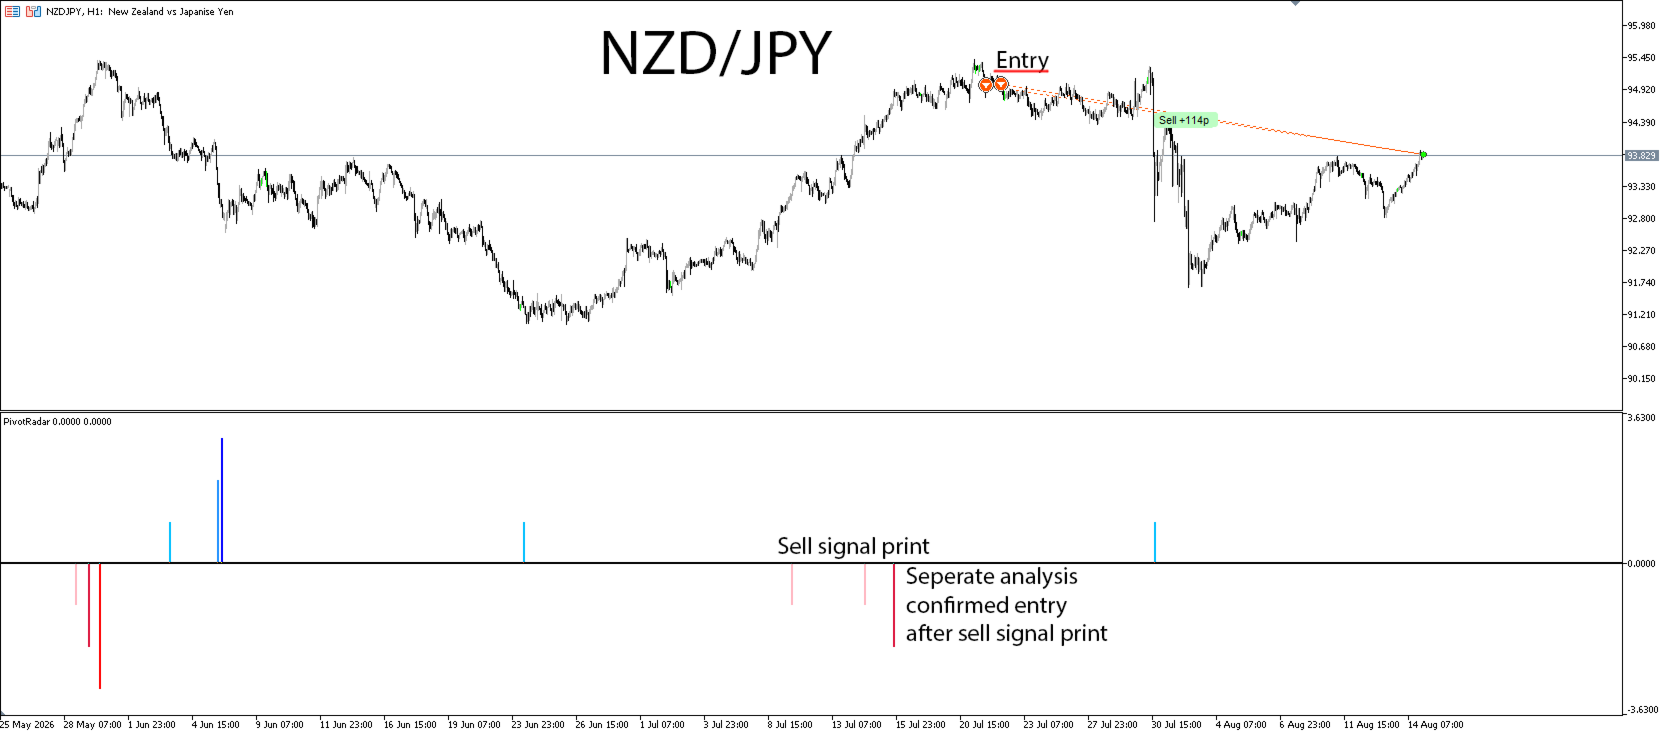
Three graduated tiers, both directions. As price works deeper into a zone, PivotRadar tracks it through three escalating tiers — a shallow first warning, a stronger mid-level signal, and an extreme-zone alert. This works for both potential upside and downside reversals, tracked independently, so you get a genuine two-sided read on the market rather than a one-directional bias.
Fires once, not on repeat. Each tier only signals the first time it's reached in a given week. You won't get flooded with the same alert firing over and over while price sits in a zone — one clean signal per tier, per week, per direction.
Built for discretion. Signals appear as clean, adjustable-width markers in a dedicated indicator window, color-coded by severity — so at a glance you know not just that something happened, but how significant it was.
What you get
Independent buy-side and sell-side signal tracking, each with its own three-tier escalation
Fully adjustable signal colors, so it fits whatever chart theme you already use
Adjustable signal width and direction (flip either side up or down to suit your layout)
Built with forex and indices in mind, and works on other instruments too — futures, stocks, ETFs, and beyond — provided you manually adjust the settings to fit that instrument's own price behavior (see "Honest limitations" below)
Configurable week-start day, for traders whose trading week doesn't begin Monday
A dedicated, uncluttered signal window that stays out of your way until it has something to say
How traders use it
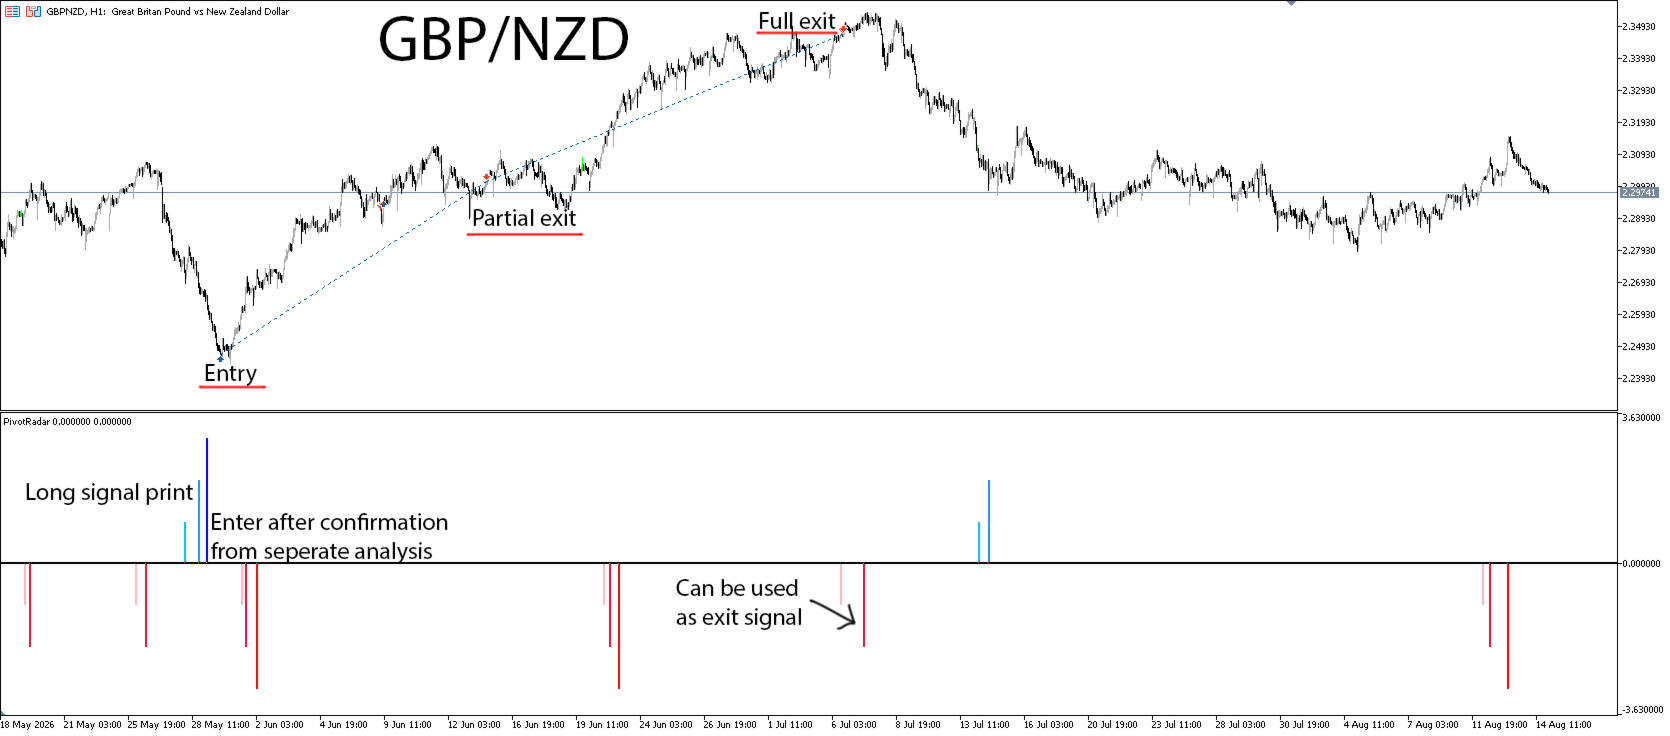
PivotRadar isn't a standalone "buy here, sell here" system, and we won't pretend it is. It's a structural warning layer — a way to know, without staring at the chart all week, that price has worked its way into a zone worth paying attention to. Most traders use it alongside their own confirmation tools: price action, a trend filter, or their own support/resistance analysis. Think of it as the thing that taps you on the shoulder and says "look here now" — not the thing that makes the decision for you.
The three-tier structure exists because not every touch of a zone is equally significant. A shallow first-tier signal might just be noise inside a broader trend. A third-tier extreme signal is a genuinely rare, high-conviction event worth real attention. PivotRadar lets you calibrate how seriously to take each one, rather than treating every alert the same.
This is not a scalping tool. Because zones reset weekly and each tier only fires once, PivotRadar isn't going to hand you a stream of signals throughout the day, every day — if you're in and out of the market on a minute-by-minute basis, this isn't built for that rhythm. It's designed with swing and positional trading in mind, where a handful of well-placed weekly signals is the point, not a limitation. That said, shorter-term opportunities can still be taken when a signal does occur — plenty of traders will see a tier fire and use it as the trigger for a faster-turnaround trade — but always in conjunction with your own methods and analysis, not as a standalone entry signal on its own.
Reading a signal in context
PivotRadar tells you where price has reached, not what kind of move got it there — that second part is on you, and it's the difference between using this tool well and using it badly.
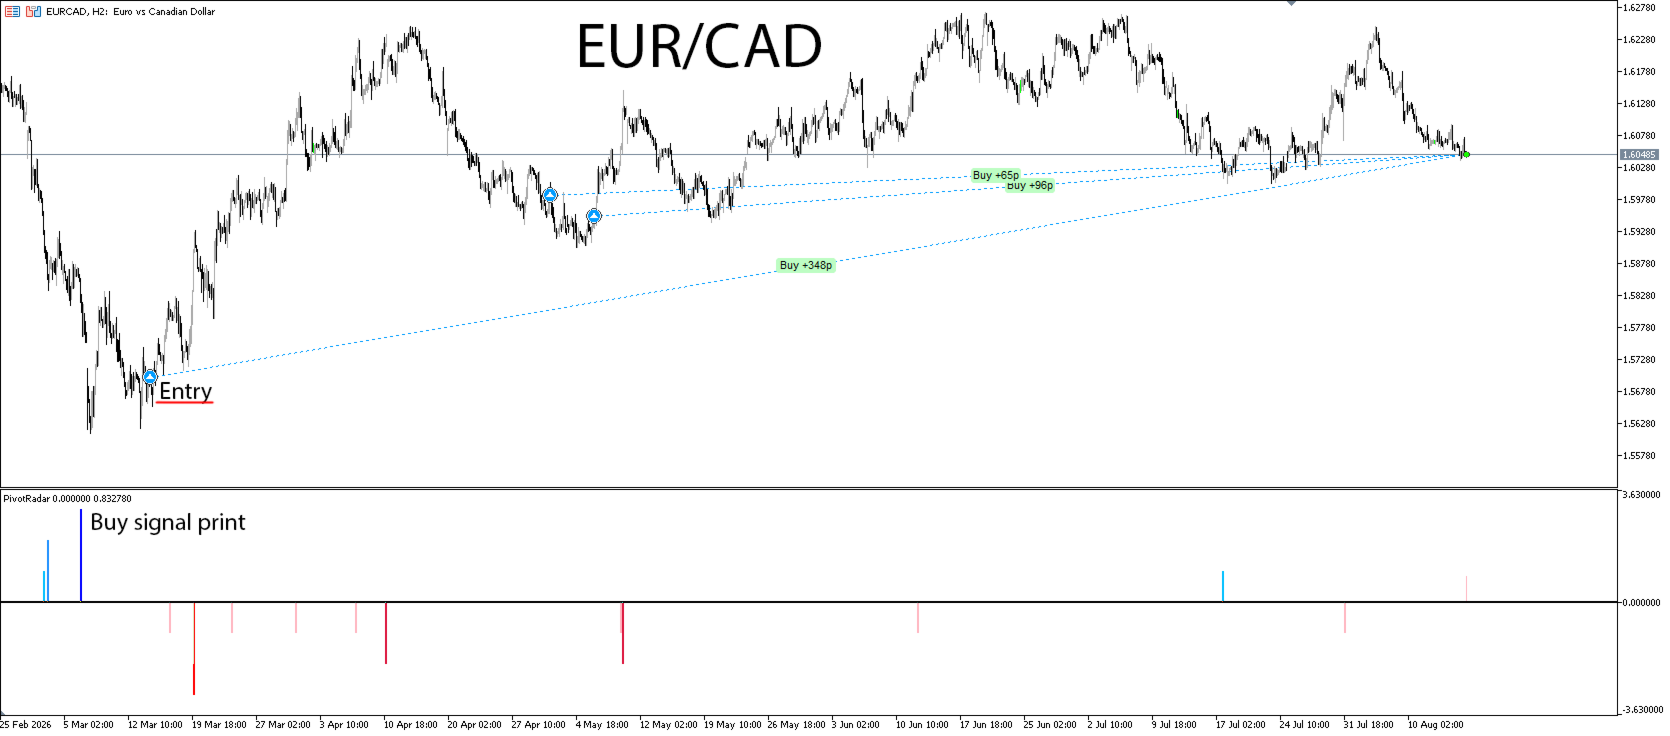
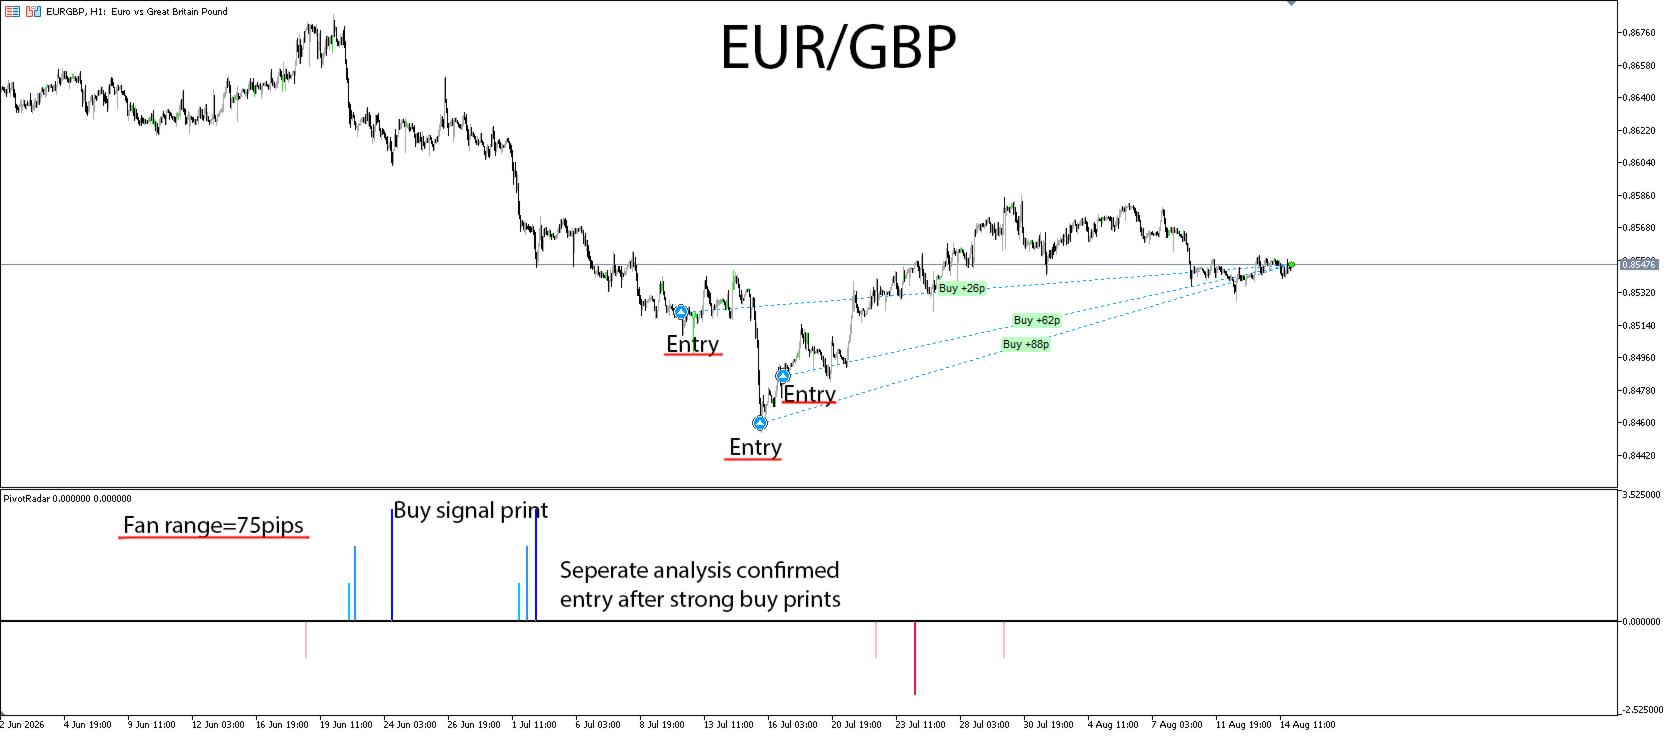
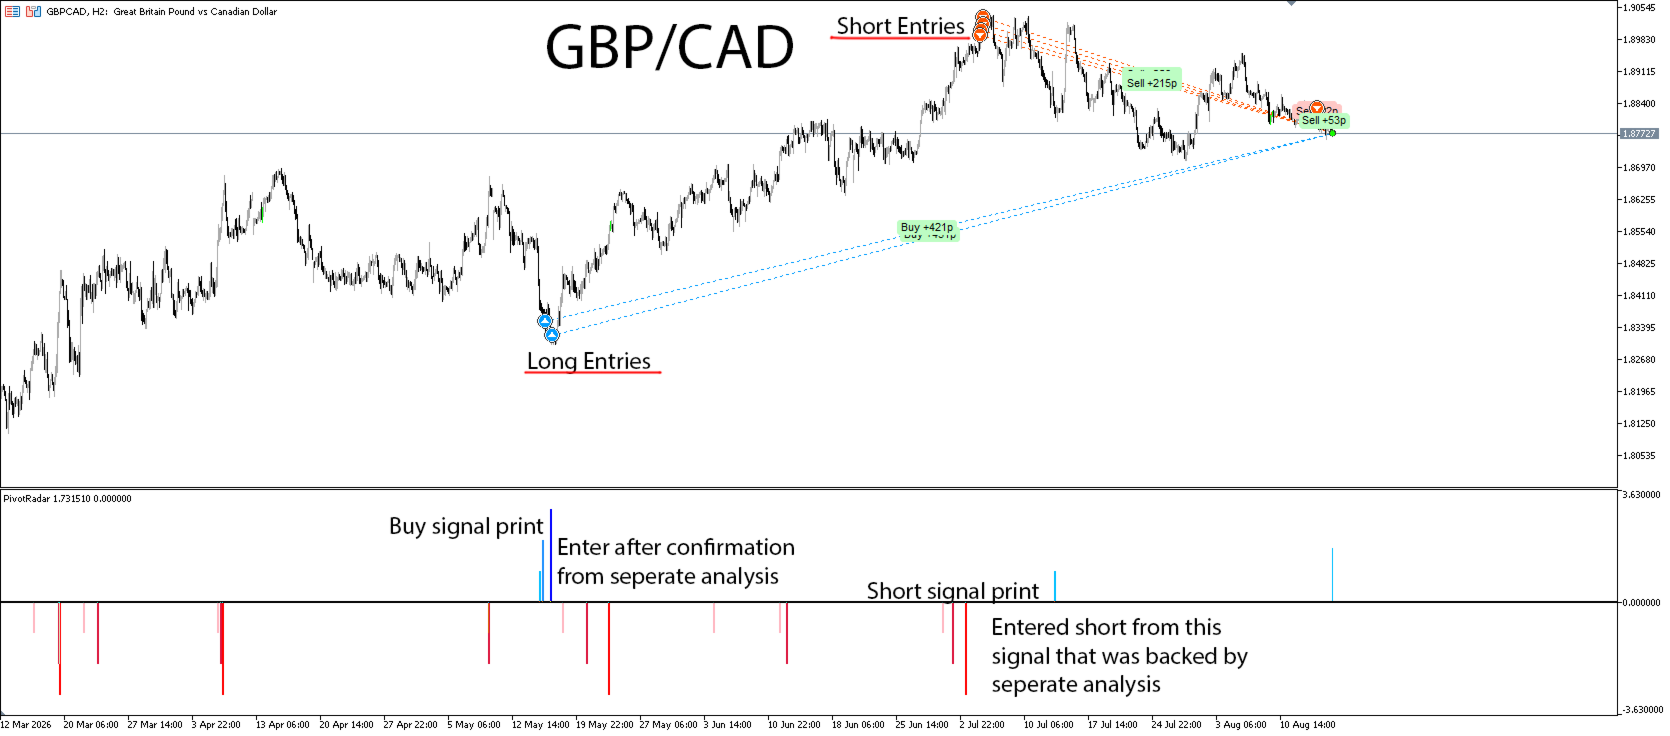
The tool is at its most powerful after price has already made an extended move — not at the start of one. A buy signal that prints after a selloff off the weekly highs is a genuinely different situation than a buy signal that prints while price is in the middle of a steep, established downtrend. Both can technically trigger the same tier — PivotRadar only measures distance from the weekly anchor, not the character of the trend that got price there. Telling those two situations apart is exactly the "your own judgment about the broader trend" piece we mean when we say to use this alongside your own analysis, not instead of it.
The pattern to look for: after an extended rally, a pulldown into the zone can produce a legitimate buy signal — you're watching a pullback inside strength, not a fresh breakdown. The mirror is true for sells: after an extended decline, a bounce into the zone can produce a legitimate sell signal — a rally inside weakness, not the start of a new uptrend. In both cases, the signal means more because it's happening against a move that's already run its course, not at the front edge of a fresh one.
What this tool is not for: treating every buy signal as a reason to immediately expect (or chase) a sell signal shortly after, or flipping straight from a long to a short the moment the opposite side fires. A signal on one side doesn't cancel or predict a signal on the other — read each one in its own trend context, not as a ping-pong pair.
Honest limitations
No indicator predicts the market, and we're not going to claim this one does. PivotRadar tells you where price has moved to relative to its own weekly structure — it doesn't know why, and it doesn't manage your risk for you. Use it with a stop loss. Use it with your own judgment about the broader trend.
PivotRadar is built and tuned with forex and indices in mind — that's where its default settings are calibrated to behave well out of the box. It works on other instruments too, including futures, stocks, and ETFs, but every market moves differently, and the defaults won't automatically fit an instrument they weren't built around. If you're running this on anything outside forex and indices, plan to manually adjust the relevant settings to match that instrument's own price behavior before trusting it — and backtest on your own instruments and timeframes before trading it with size, since behavior genuinely varies across different markets' volatility profiles.
SETTINGS
PivotRadar — Settings Guide
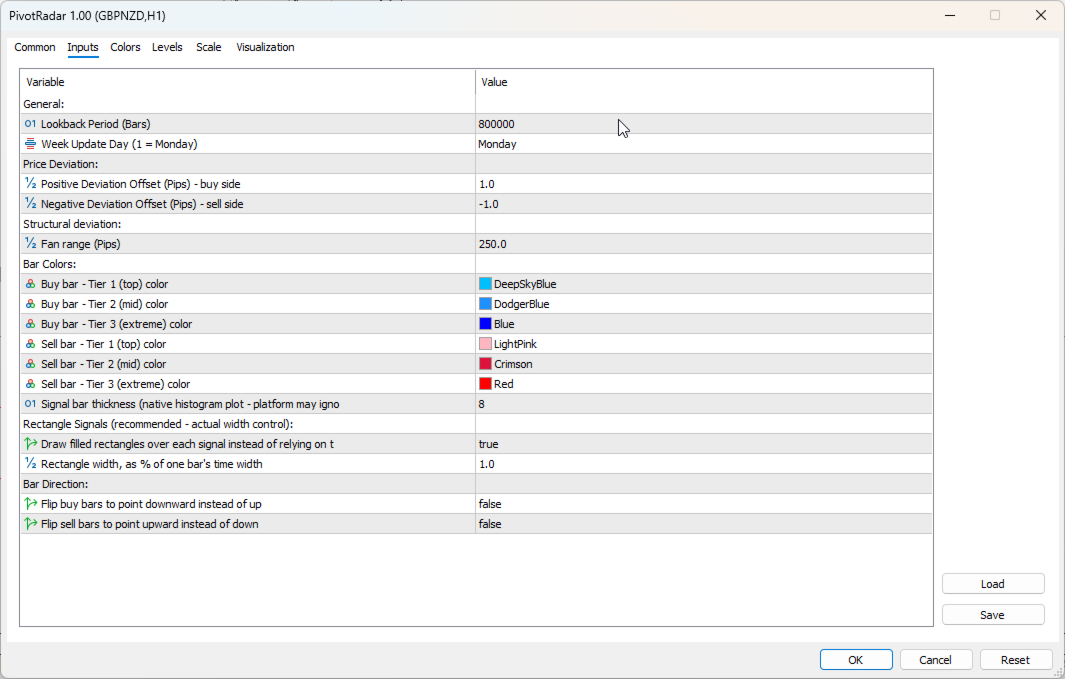
A quick reference for what each setting does. Everything here can be adjusted from the Inputs.
Lookback Period
How far back PivotRadar scans, in bars, when it first loads on a chart — this is what lets it rebuild every past weekly zone and signal across your available chart history, not just what happens from today forward.
Default: 800,000 bars — deep enough to cover essentially any amount of history your broker provides.
When to touch it: Rarely. Lower it only if you're on a very long history chart and want a faster initial load, and don't care about seeing older signals.
Week Update Day
Sets which day of the week PivotRadar treats as the start of a new cycle — this is the moment both the buy-side and sell-side zones reset fresh for the week ahead.
Default: Monday.
When to touch it: If your instrument's trading week effectively starts on a different day in your broker's server time, or you simply prefer to align the reset to a different day for your own planning.
Price Deviation
Two settings — one for the buy side, one for the sell side — that control how closely the tool's internal reference point tracks price. This is one of two settings governing how sensitive PivotRadar is before anything can be considered for a signal.
Default: 1 pip on both sides.
When to touch it: Advanced use only. This is a core sensitivity setting, not a cosmetic one — test any change thoroughly on your own instrument and timeframe before trusting it, ideally in the Strategy Tester before going live with it.
Fan Range
Sets how wide a zone PivotRadar watches around each week's anchor point, in pips. This is the second core sensitivity setting, and it's the one most likely to need adjusting per instrument.
Default: 250 pips.
When to touch it: This is the setting to tune first if you move PivotRadar to a different instrument. Every market has its own natural weekly range — a fast-moving pair or index can blow through a zone sized for a calmer one, while that same zone might be nearly unreachable on something slower. There's no universal right number here; back-test on your specific instrument before committing to a new value.
Bar Tiers
Controls the appearance of the three severity tiers on each side — Tier 1 (shallow), Tier 2 (mid), Tier 3 (extreme) — independently for buy and sell. Includes color per tier, overall bar width, and (recommended) the rectangle-signal width percentage, which gives more reliable thickness control than the native bar width setting alone.
Default: Light-to-dark blue for buy (shallow to extreme), light-to-dark red for sell.
When to touch it: Entirely cosmetic — adjust freely to match your chart theme. The tier structure itself (which signal counts as which severity) doesn't change; only how it looks does.
Bar Direction
Two on/off switches that flip which way each side's bars point. By default, buy signals point upward and sell signals point downward.
When to touch it: Personal preference only — some traders prefer both sides pointing the same direction, or the reverse of the default layout. Purely visual; has no effect on when or why a signal fires.