DM IND Exclusive
- インディケータ
- バージョン: 1.0
- アクティベーション: 5

Indicador Para Opções Binarias.
Indicator for Binary Options
Usa dois gales.
Instalar em mt5
Esse indicador é para ser usado no tempo de vela de 5 minutos e em M5.
Este também funciona em M1, porém é mais eficiente em M5.
Só descompactar e copiar os arquivos na pasta de dados do seu MT5.
Arquivos indicator na pasta MQL5 - Indicator.
Baixe também a Media Movel totalmente gratis:
https://www.mql5.com/pt/market/product/50400
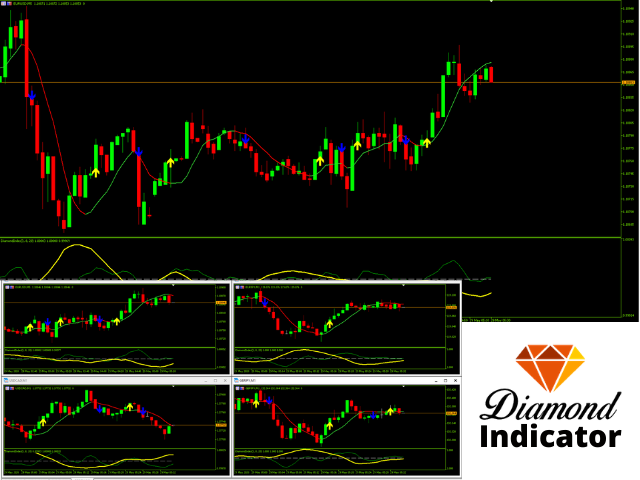
Esse Indicador é para a próxima vela.
Apareceu a seta, só aguardar a próxima vela e entrar com a ordem.
Diamond Indicator.