WAD Stoch
- インディケータ
- バージョン: 1.0

WAD Divergence + Stochastic
Overview
WAD Divergence + Stochastic is a technical indicator designed to assist traders in identifying potential market turning points. It combines price behavior with momentum confirmation to highlight areas where buying or selling pressure may be shifting.
The indicator works directly on the chart and provides clear visual signals to support decision-making in fast-moving markets.
How It Works
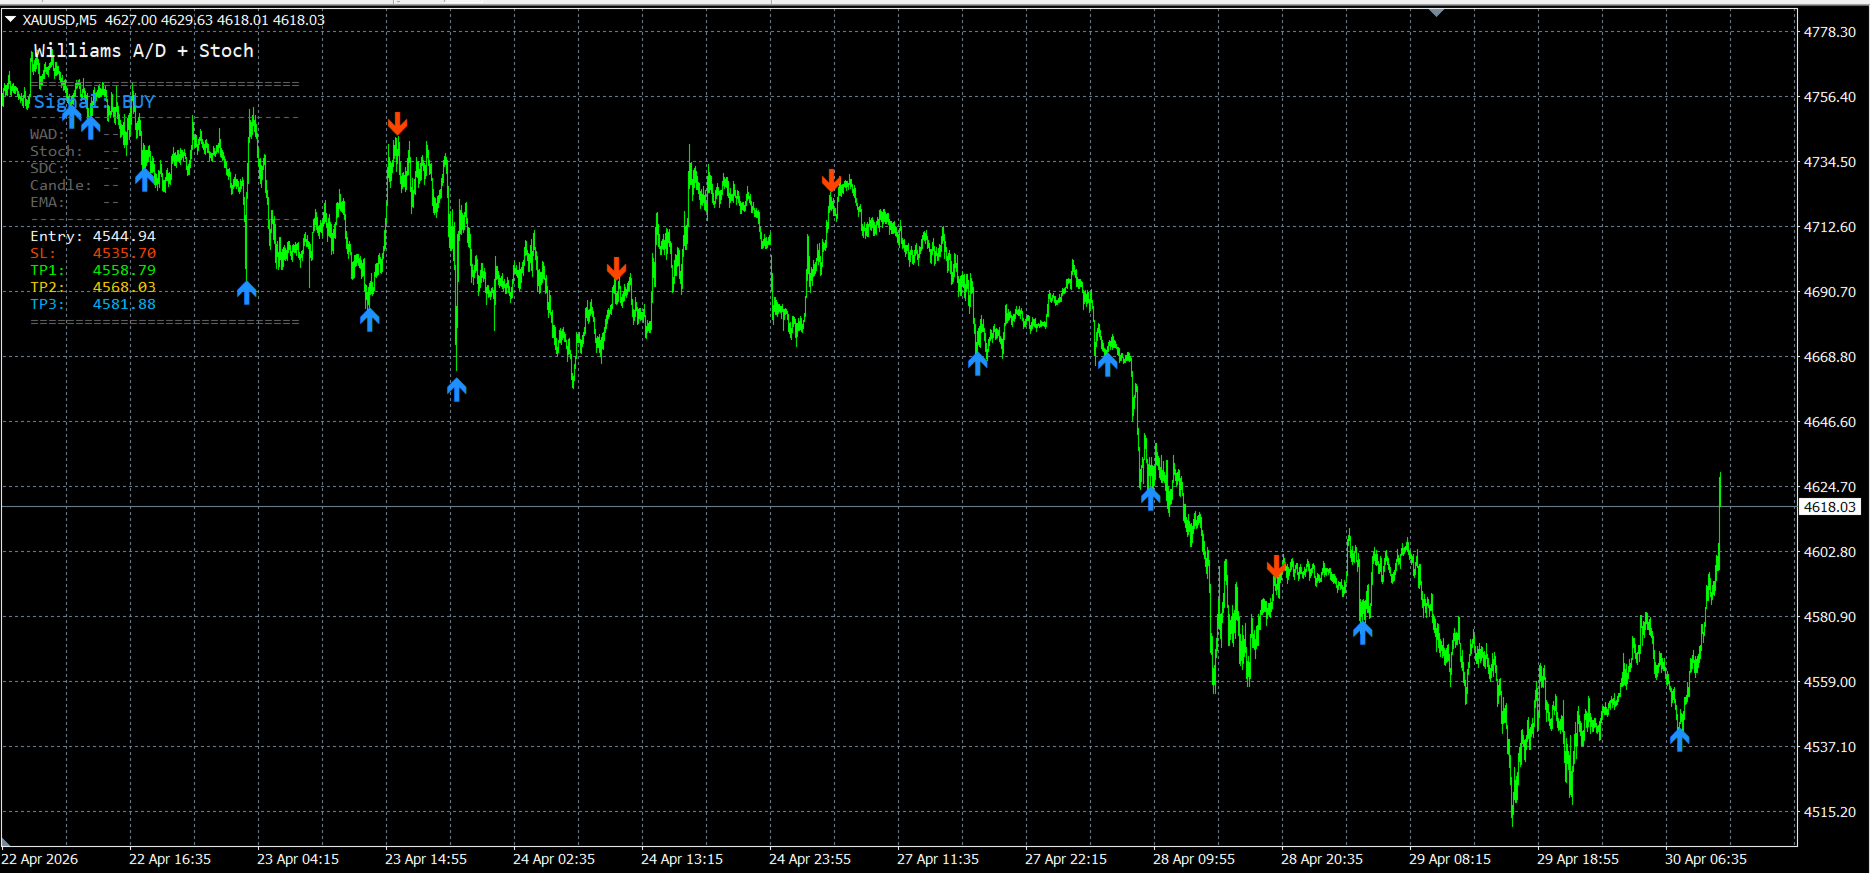
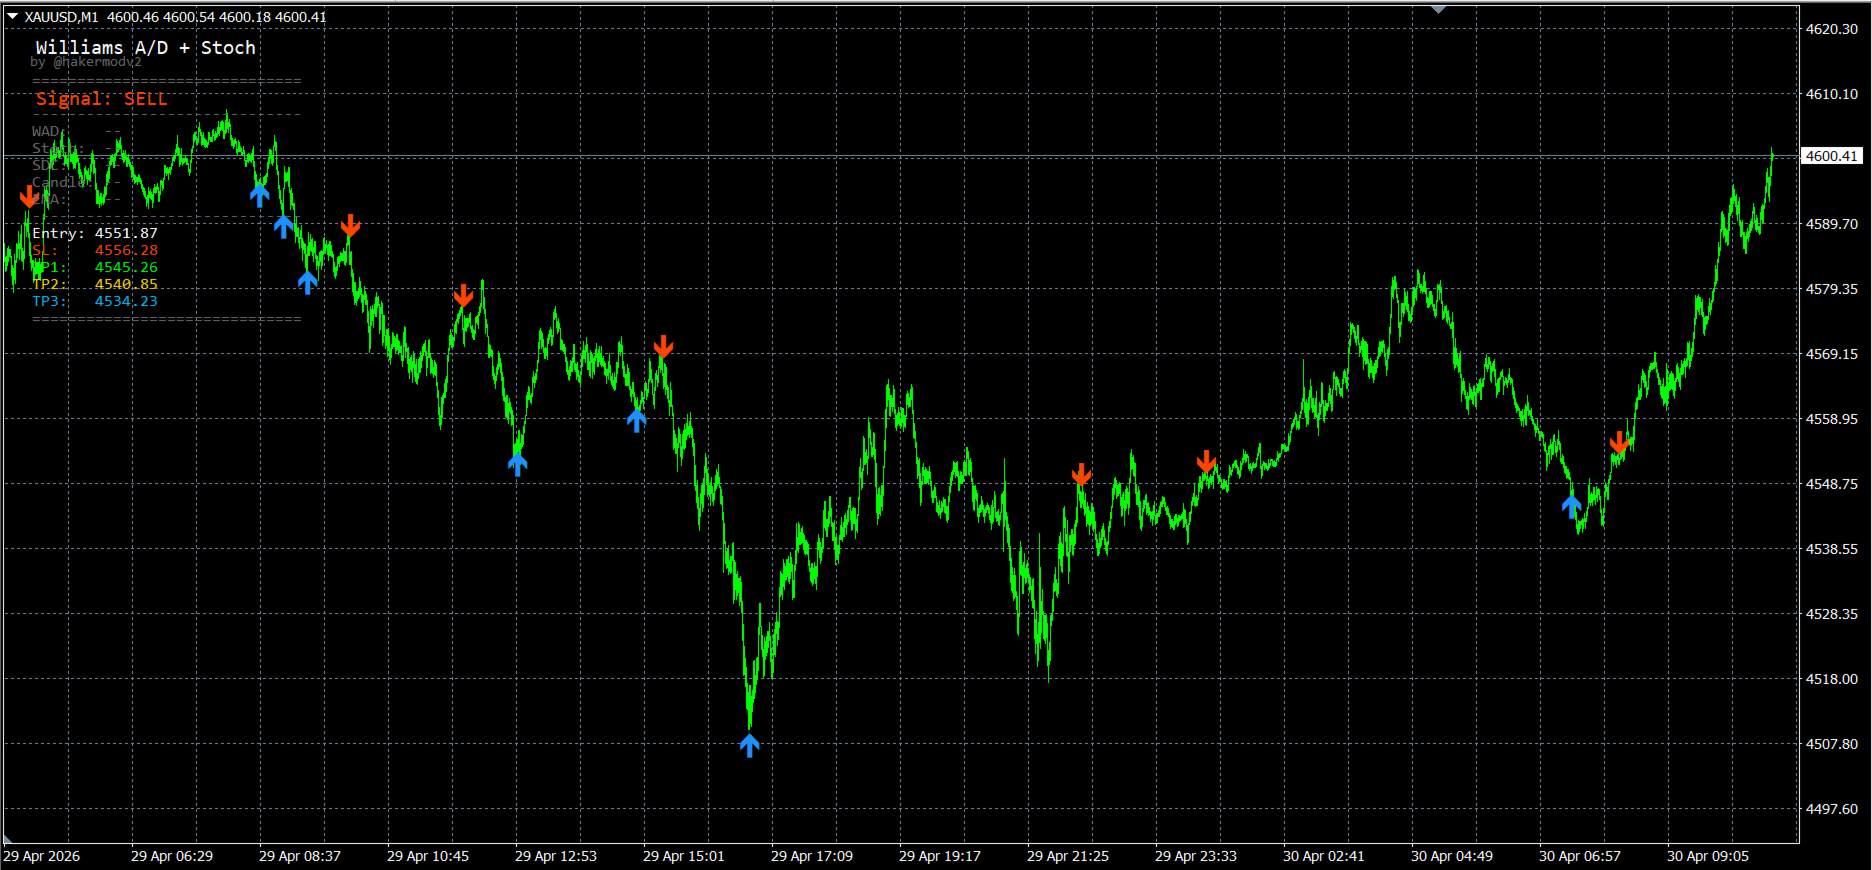
The indicator analyzes the relationship between price movement and internal market pressure, then applies additional confirmation filters. When specific conditions align, it marks potential trade zones using arrows on the chart.
- Blue arrows indicate potential upward movement
- Red arrows indicate potential downward movement
Each signal is generated after multiple conditions are met, helping reduce unnecessary noise.
Key Features
- Non-repainting signals after candle close
- Real-time signal generation
- Built-in entry, stop loss, and target level visualization
- Optional trend filter for additional confirmation
- Works on multiple symbols and timeframes
How to Use
1. Entry Signals
Wait for an arrow to appear after a candle closes:
- A blue arrow suggests a possible buy setup
- A red arrow suggests a possible sell setup
It is recommended to enter at the opening of the next candle.
2. Risk Management
The indicator provides suggested levels:
- Stop Loss (SL) is placed automatically based on market volatility
- Multiple Take Profit (TP) levels are displayed for flexible trade management
Traders can choose to:
- Close partially at each target level
- Or manage the trade manually based on their strategy
- For more quality signal increase the SDC_Multi to 3 and SDC_Period to 10 or activate the EMA filter.
- All parameters can be adjusted according to your trading strategy
3. Market Conditions
The indicator is designed to work in both trending and ranging conditions. For additional confirmation, users may combine it with:
- Higher timeframe analysis
- Support and resistance levels
4. Recommended Usage
- Suitable for intraday trading
- Can be applied to different instruments
- Works well on lower timeframes when combined with proper risk management
Notes
- Signals are generated only after candle confirmation
- It is recommended to test the indicator on a demo account before live use
- The indicator is a tool to support analysis and should be used as part of a broader trading plan