End Flow Momentum

  • インディケータ
  • Nestor Jose Mendez Boza
    Nestor Jose Mendez Boza
    定量トレーディングシステム設計者 & 時系列分析研究者
    私は、アルゴリズム取引システムの研究開発に過去7年間専念してきた、多分野にわたる個人です。高度な数学、データサイエンス、市場分析への革新的な視点を融合し、国際的な競技環境で具体的な実績を残してきました。
    主な実績:
    Robotrader 2023(Interactive Brokers):Python戦略で 第3位
    Robotrader 2025(Darwinex):MQL5と適応的リスク管理で 第3位
  • バージョン: 3.0
  • アップデート済み: 13 8月 2026
  • アクティベーション: 10
END FLOW MOMENTUM 

Capital Flow Analysis with a Geometric Approach

Overview

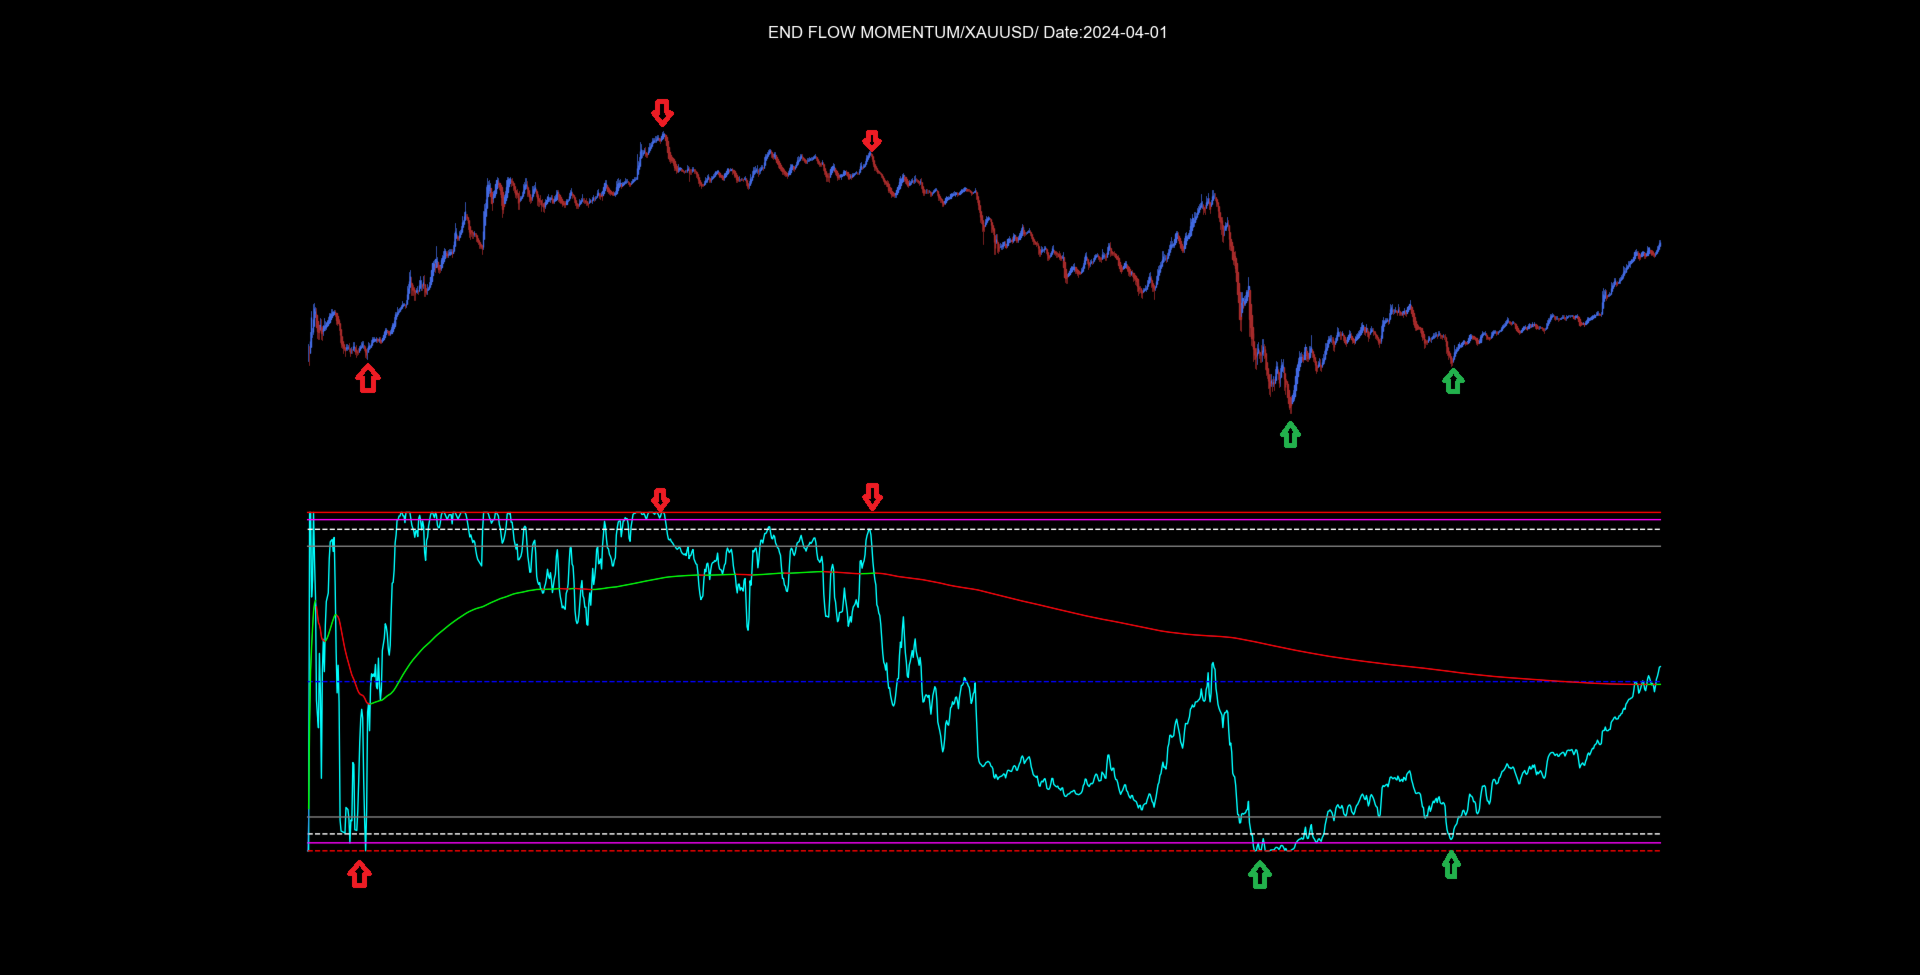
End Flow Momentum is a technical indicator that blends volume, price, and volatility analysis into a visual tool. Designed for traders seeking an alternative capital flow analysis tool.

Key Features

1. Mathematical Foundation

  • Proprietary Calculation Model: Uses a mathematical core that serves as a dynamic central reference point.

  • Volatility-Adaptive Scaling: Utilizes the asset's inherent volatility as the primary scalar, allowing automatic adaptation across different instruments.

  • Geometric Structure: Incorporates geometric proportions to define support and resistance level structures.

2. Dual Signal Trading System

A) Real-Time Capital Flow Signals

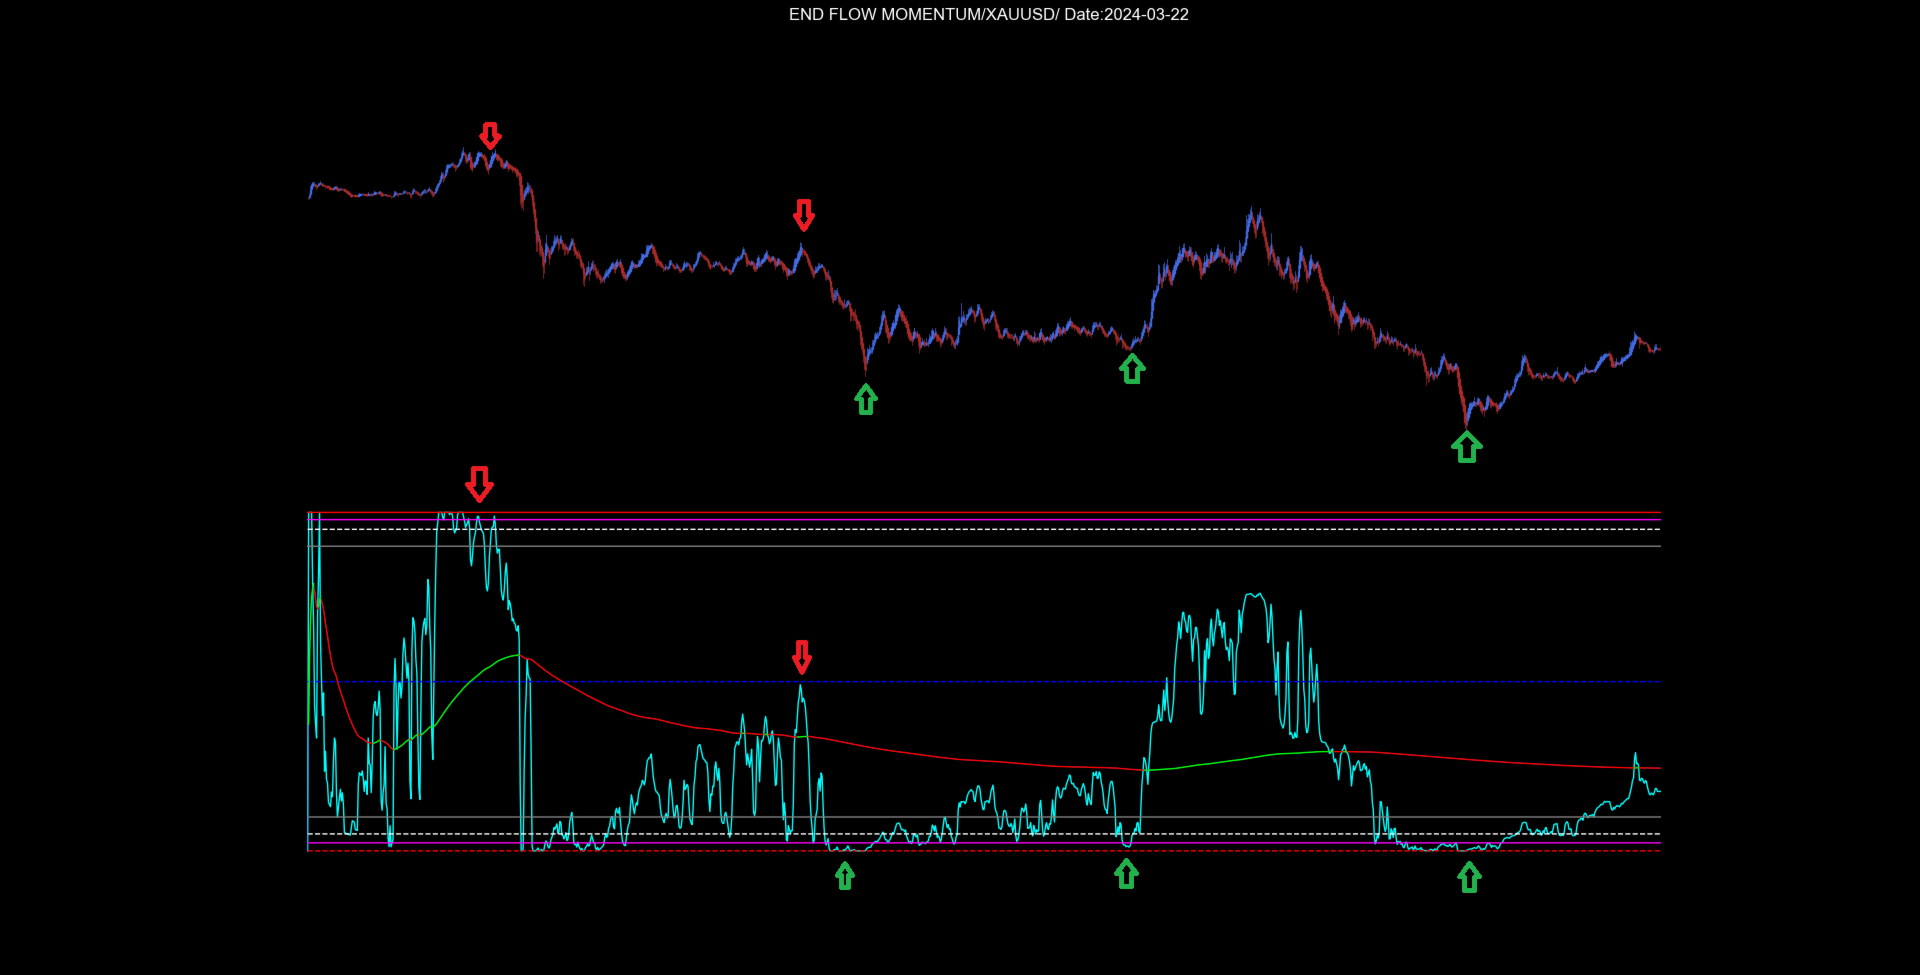
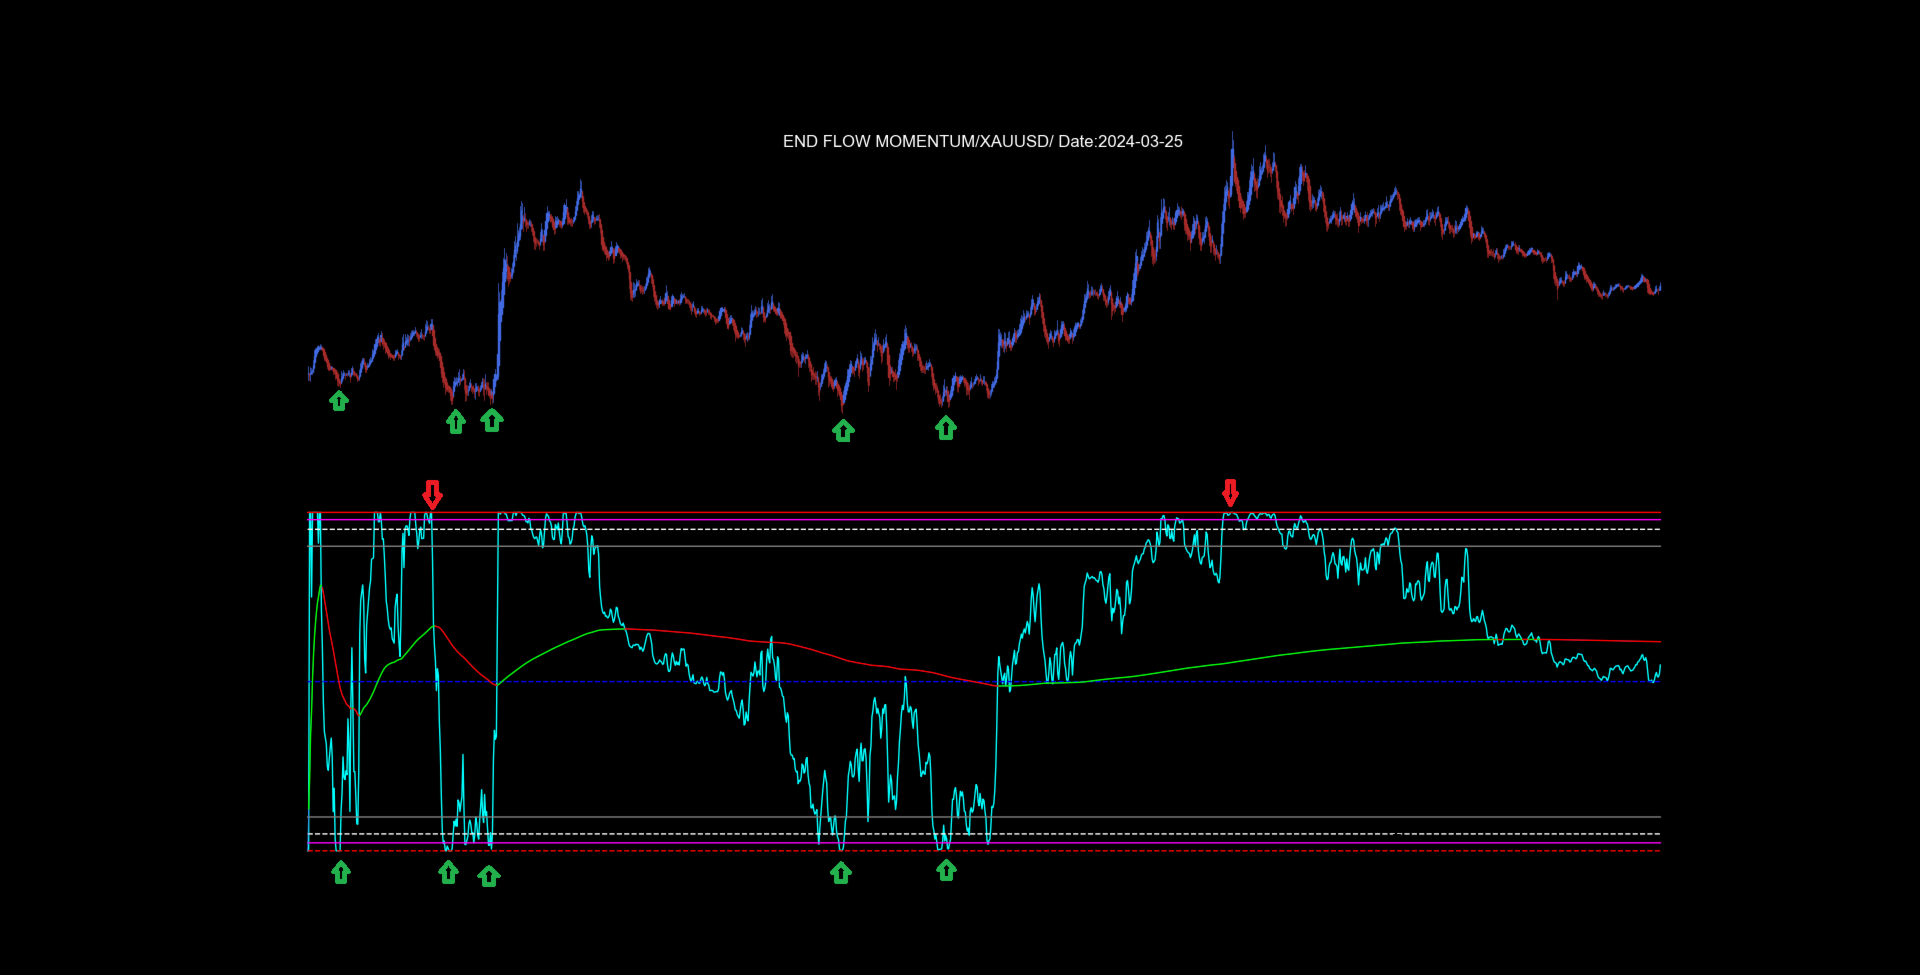
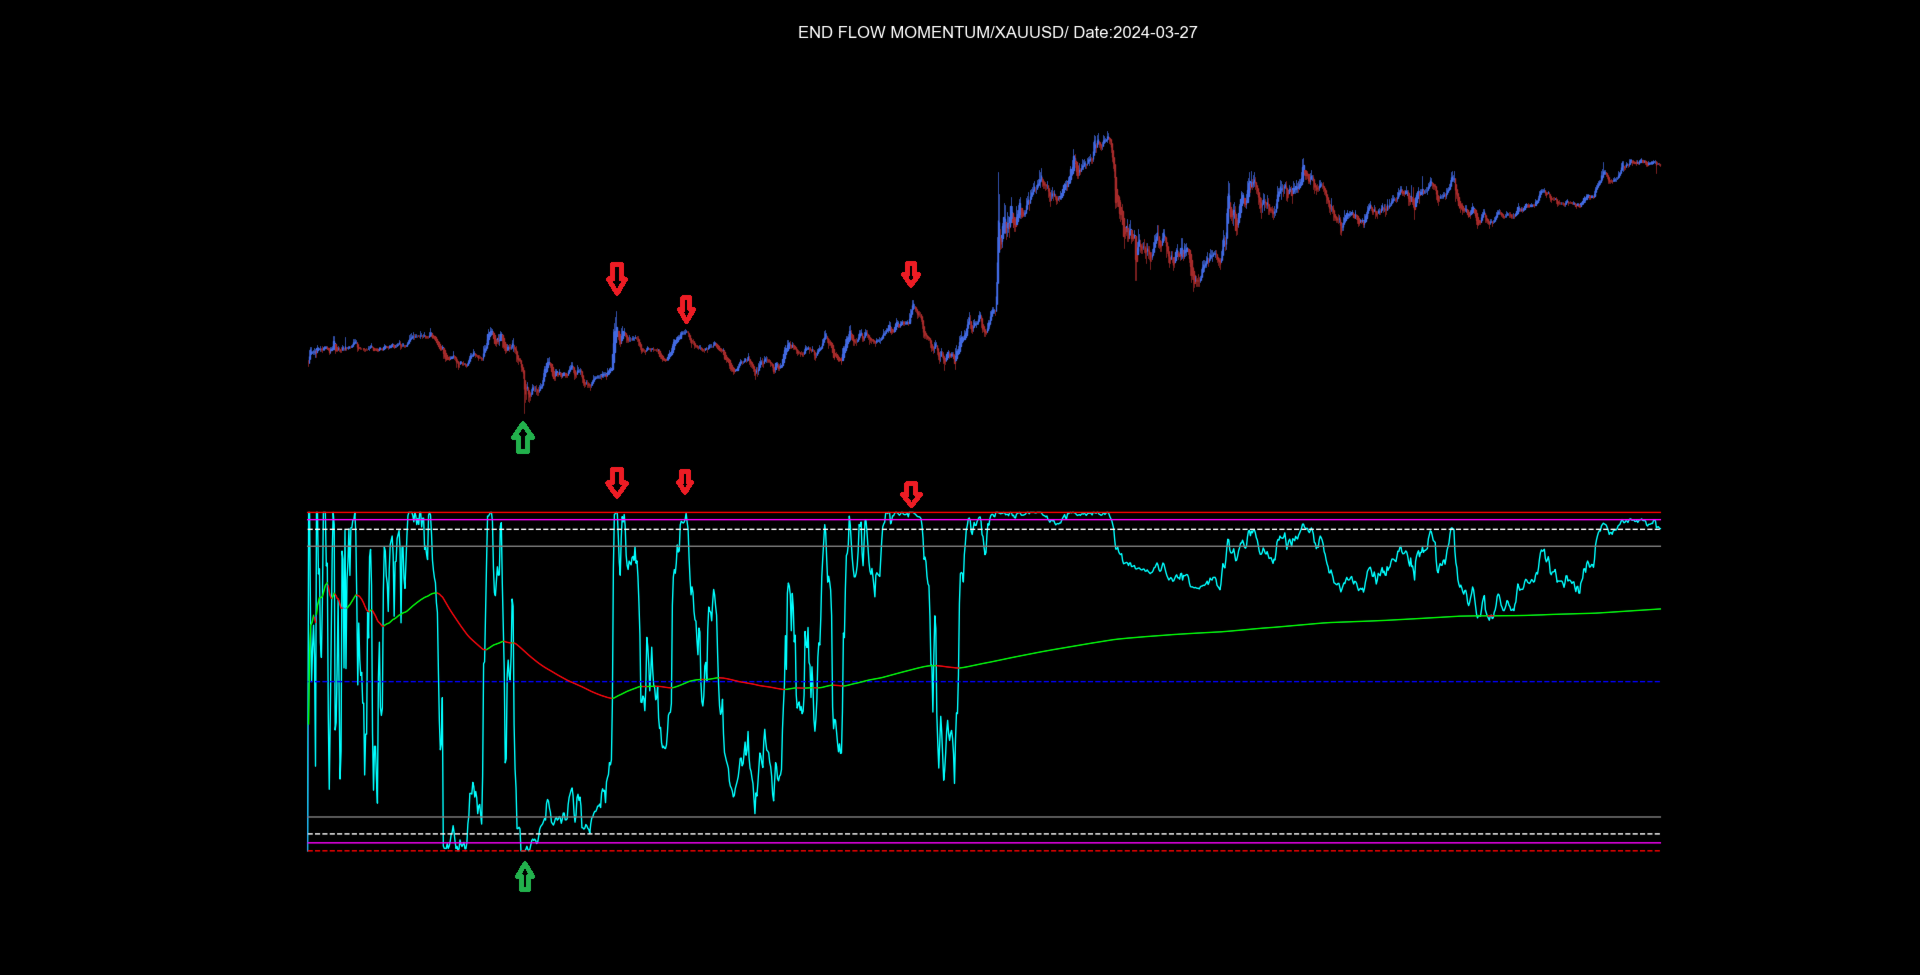
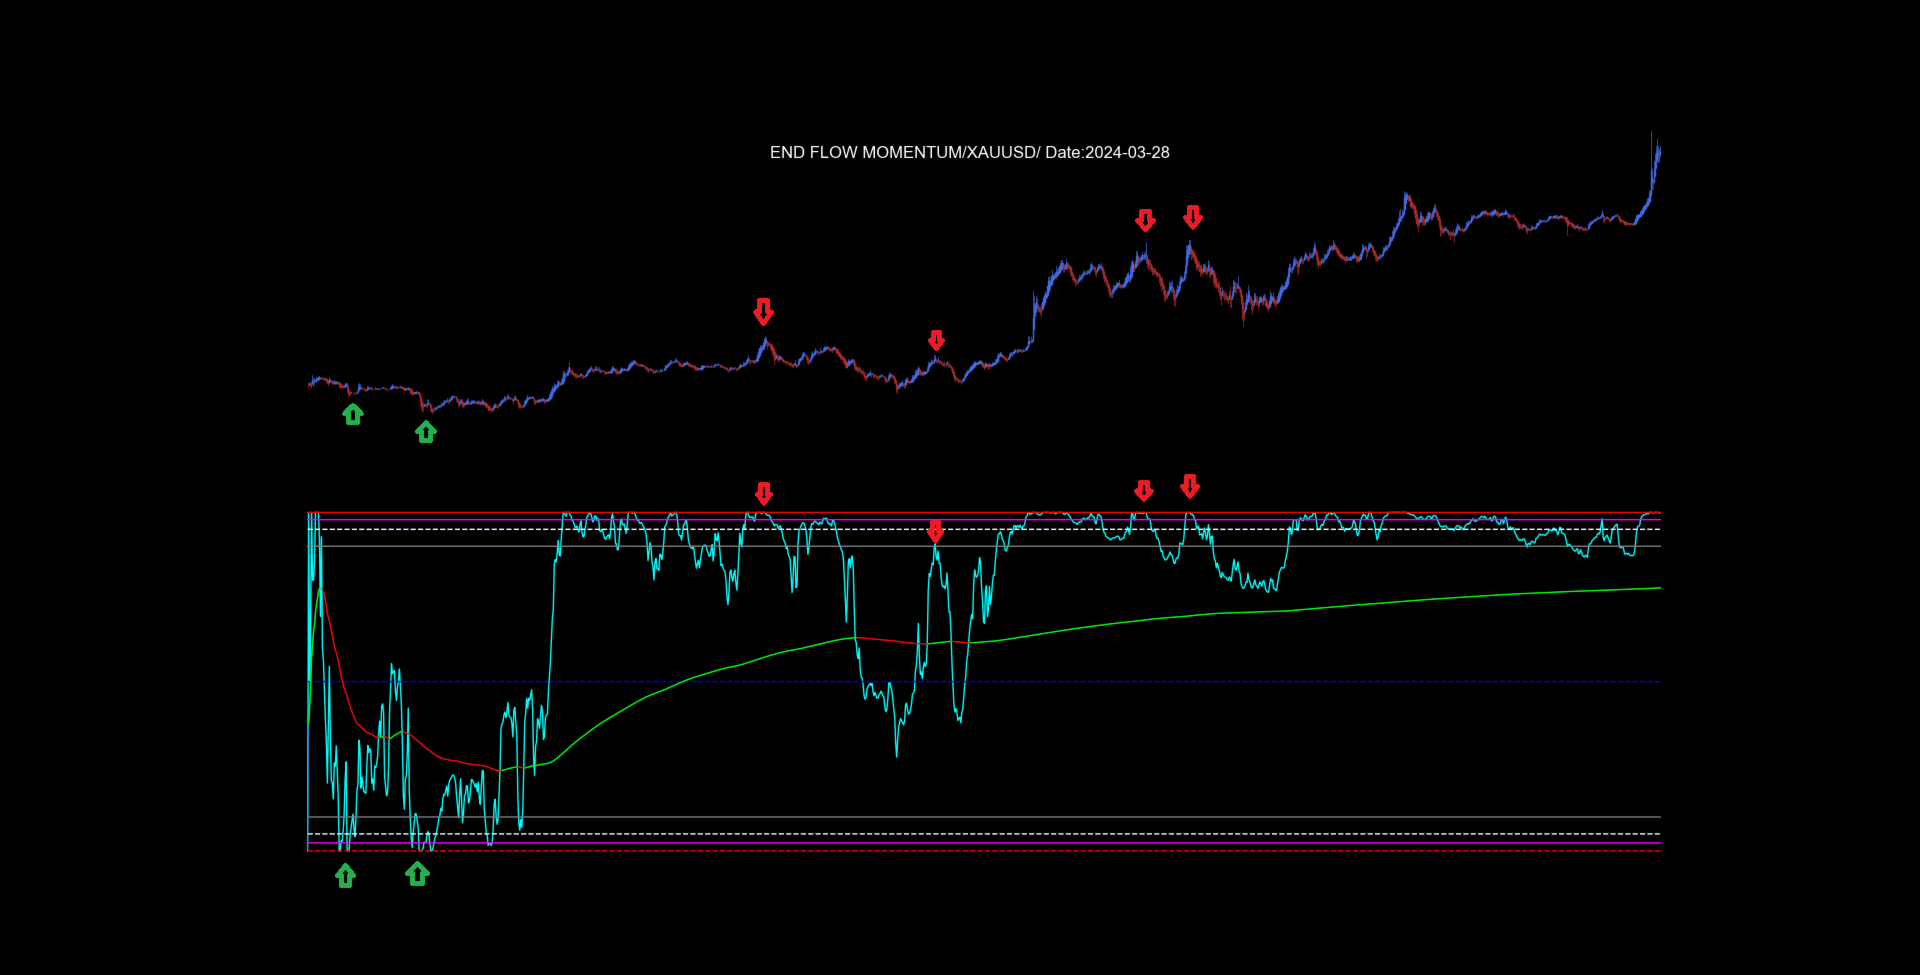
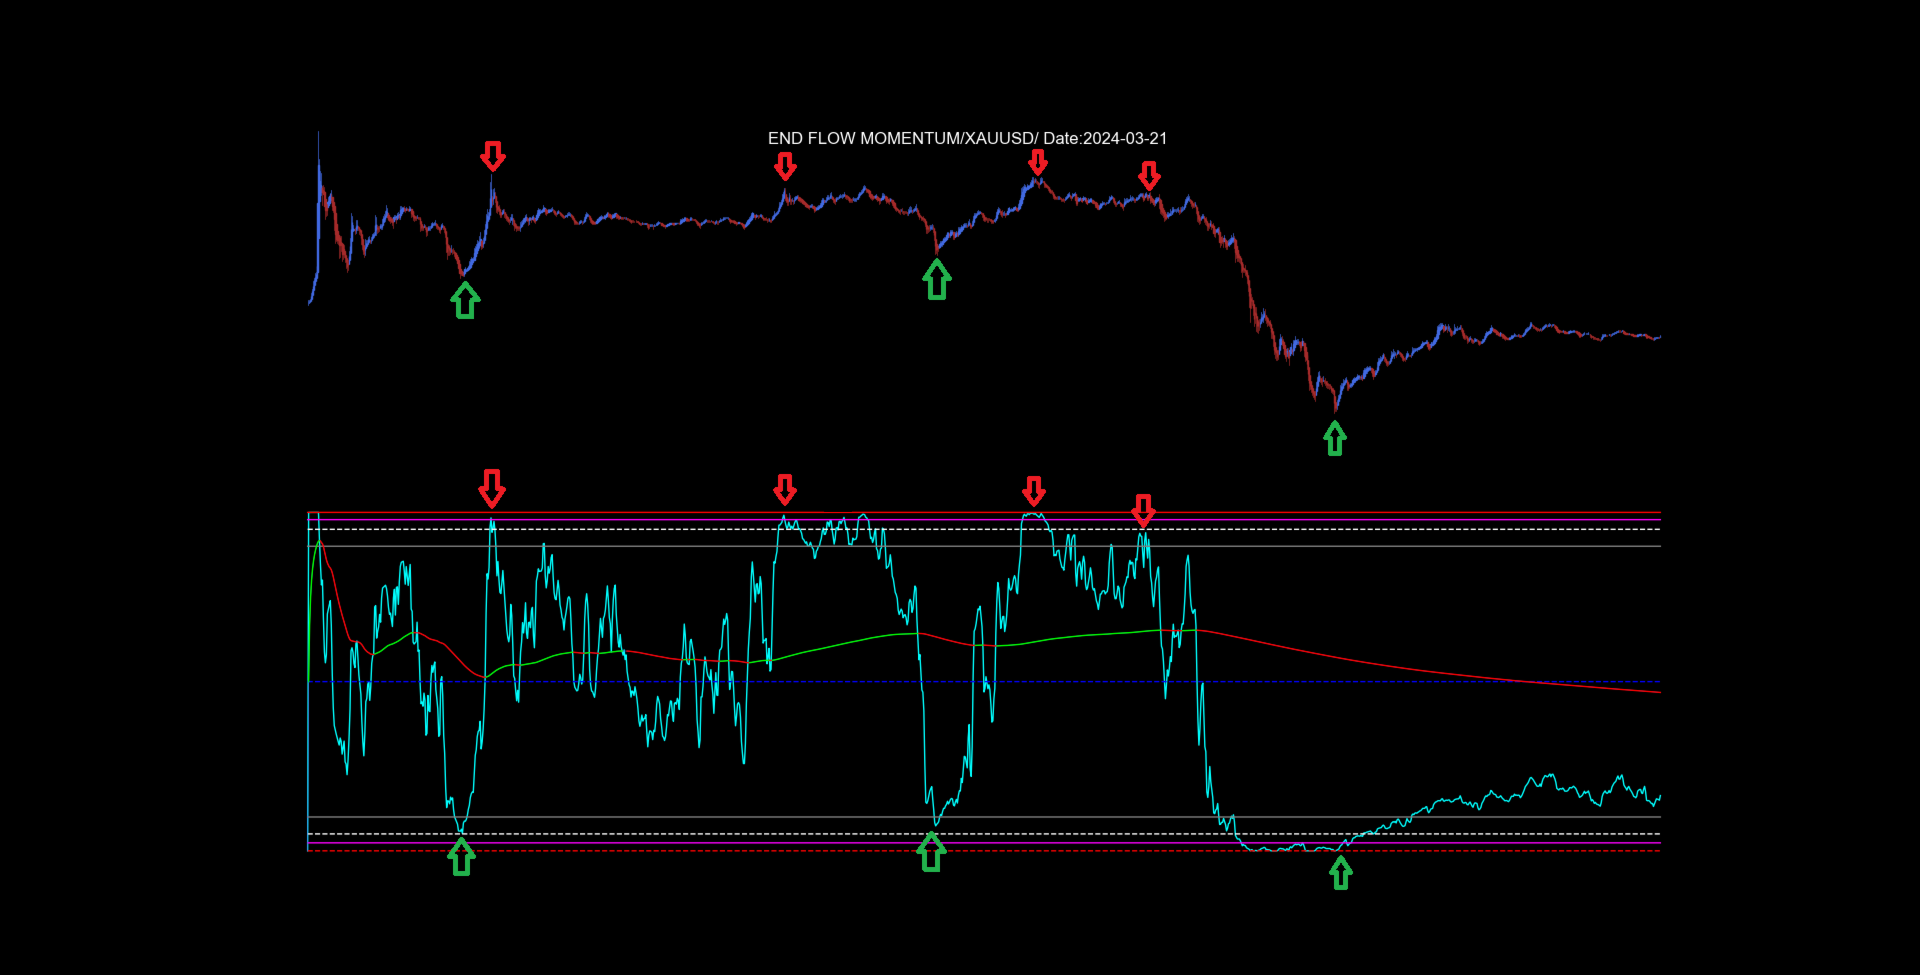
  • 1. Instant Flow Signal: Cyan Line. Represents money/volume flow in real-time, showing the market's immediate intention.

  • 2. Cumulative Momentum Signal: Dynamic Lime Green (bullish) or Red (bearish) Line. Represents the accumulation of money/volume flow, showing market momentum.

B) 9-Level Trading System (Price Ranges)

The indicator defines nine critical levels that form a framework for market analysis:

Lvl Name Type Description
a Buy Exhaustion - Upper Limit Solid Red Line Zone where buying pressure exhausts; may suggest a reversal or distribution.
b Impulse Validation Level (Buy Side) Solid Magenta Line Critical point that may indicate the strength of a bullish impulse.
c Mid-Point Validation Level White Dotted-Dashed Line Intermediate equilibrium level acting as dynamic support/resistance.
d Retracement Zone (Buy Side) Solid Gray Line Base of the bullish move; origin of demand and defense for buyers.
e General Average Level Blue Dashed Line Theoretical global equilibrium point of the indicator.
f Retracement Zone (Sell Side) Solid Gray Line Base of the bearish move; origin of supply and defense for sellers.
g Mid-Point Validation Level (Sell Side) White Dotted-Dashed Line Intermediate point of the bearish trajectory.
h Impulse Validation Level (Sell Side) Solid Magenta Line Level that may confirm or invalidate the bearish impulse.
i Sell Exhaustion - Lower Limit Solid Red Line Zone where selling pressure exhausts; may suggest a bearish climax.

3. Capital Flow Algorithm

  • Tick-by-Tick or Closed Bar Analysis: Processes tick-level volume data to analyze market intention.

  • Intention Detection: Distinguishes between accumulation/distribution and market movements.

4. Technical Implementation

  • Language: Developed in MQL5 for integration with MetaTrader 5.

  • Optimization: Coded for maximum efficiency.

5. Compatibility

  • Universal Application: Compatible with all financial instruments.

  • Recommended Timeframe: Works on M1 to M5 timeframes.

Advantages

  • Dual Signals: Provides readings for both Capital Flow direction and Accumulation/Distribution phases.

  • Automatic Adaptability: Self-adjusts to any asset.

  • Visual Clarity: The 9-level system provides a visualization of market dynamics.

Interpretation Guide

  • Cumulative Signal (Lime Green/Red) above Central Equilibrium (Blue Line): May suggest a bullish bias.

  • Cumulative Signal (Lime Green/Red) below Central Equilibrium (Blue Line): May suggest a bearish bias.

  • Rejection at Exhaustion Levels (Red Lines): May suggest a potential reversal.

  • Hold at Demand/Supply Origin (Gray Lines): May indicate the strength of the current trend.

  • Instant Flow Signal (Cyan): May provide real-time confirmation of capital flow direction.

Important Note

End Flow Momentum is a decision-support tool. It does not guarantee trading results. The indicator should be used as part of a comprehensive strategy that includes risk management. Always backtest and forward-test any strategy before using it with real capital.

おすすめのプロダクト
--- StudentK Ict Smc Structure --- 1. Inner Circle Trading 2. Smart Money Concept 3. Structure --- What are included in tool --- 1. Market Session Box 2. Kill Zone 3. High/Low 4. Imbalance 5. FU Candle 6. Thicker Wick + Doji Candlestick 7. StudentK's Structure Line 8. Pivot Point --- Context --- StudentK is not indicated as a master or K Sir for knowledgeable person who claims for winning all the time. (But lots of traders should know the fact that it is rarely truth, especially in fluctuated
Vector Fibo Scalp is a speed and breakout-oriented intraday indicator. It monitors current price movements against daily high/low channels and provides immediate signals upon breakout confirmation. Key Features: Vector Velocity: Fast detection of daily breakouts using moving average channels. Visual candles: 4-color candle highlighting engine for active scalping states. Breakout Targets: Automatic projection of profit targets up to 161.8% Fibo ratio. R:R Panel: Dynamic calculations of risk-to-re
Know the direction. Know the plan. Know when to stand aside. CS Trend Pro turns a busy chart into a clear decision. It shows which way the market is moving and marks the moment that changes. With every signal it gives you a complete plan: where to enter, where the idea is wrong, and where to take profit. It is built for swing traders and scalpers who move with the swing: take a part of the profit at each target, and stay in for as long as the move lasts. Built on volatility and on support and re
GorMaster Pro
Manuel Damian Ortiz Fernandez
GorMaster_Pro — Sesgo confiable, noticias y técnica en una sola pantalla Visión GorMaster_Pro es una herramienta indispensable para cualquier tipo de trader (scalper, intradía o swing) porque combina información fundamental y técnica para darte una lectura fiel y accionable del mercado. En una sola vista verás: sesgo direccional BUY/SELL/RANGO , ventanas de noticias en tiempo real que congelan la operativa, métricas técnicas clave (ATR_Z, RangeRatio, ADX, SpreadZ), sesiones y alertas . Todo org
TrendView Ultimate — A Complete Trading System for Trend Clarity, Profit Insight, and Strategic Entries TrendView Ultimate is a professional trading system designed to help traders identify trend direction, high-quality entries, and potential exits with clarity, confidence, and measurable performance. More than just a trend indicator, it offers non-repainting signals, dynamic visual feedback, and a powerful statistics panel with real-time analytics, allowing traders to test, adapt, and valida
FREE
Gold M3 Doji Breakout H1 Gold M3 Doji Breakout H1 is an automated MetaTrader 5 Expert Advisor designed to identify a fixed M3 compression structure inside a closed H1 candle and evaluate a breakout during the following H1 trading window. This product is designed for Gold symbols. Its default absolute-price distances are not intended for Forex pairs, cryptocurrencies or stock indices. Position management The EA divides the position into three stages: - Stage 1 closes at the configured first
ARE Quantum Liquidity Institutional Smart Money Engine ARE Quantum Liquidity is an advanced Smart Money Concepts (SMC) indicator designed to help traders identify institutional liquidity movements and high-probability trading opportunities. The indicator analyzes market structure in real time and automatically detects important price action elements used by professional traders, including Break of Structure (BOS), Change of Character (CHoCH), Order Blocks, Fair Value Gaps (FVG), Liquidity Swe
革新的な MT5 インジケーター、DARWIN Assistant   をご紹介します。これは、トレーディングを成功させる世界への究極のゲートウェイです。精度と専門知識に基づいて設計された DARWIN Assistant   は、RSI、ストキャスティクス、CCI、トレンドなどの高度なテクニカル指標をすべての時間枠にわたって活用する特別な戦略に基づいて動作します。この最先端のインジケーターはエントリーのための最も正確なシグナルを提供し、比類のない自信を持って市場をナビゲートできるようにするため、並外れた取引体験に備えてください。 DARWIN Assistant   を使用すると、最も収益性の高い取引機会を検出するために細心の注意を払って調整された、重要な指標の包括的な分析にアクセスできるようになります。不確実性に別れを告げ、情報に基づいた意思決定の新時代を迎えましょう。 RSI、ストキャスティクス、CCI、トレンドを DARWIN Assistant   内でシームレスに統合することでその力を解き放ち、これまでにないほど市場のダイナミクスを鮮明に描きます。 DARWIN As
Currency Magician Matrixインジケーターとは何ですか? Currency Magician Matrixインジケーターは、通貨の強さを示すグラフィカルなツールです。一般的なインジケーターは通常、通貨の強さを他の通貨との関係で表示しますが、いくつかの計算を行うことで各個別通貨の絶対的な強さを見つけることができます。 したがって、Currency Magician Matrixインジケーター(またはメーター)は、通貨の絶対的な強さを表現し、他の通貨の強さと比較できるツールです。 通貨の絶対的な強さを計算する方法はさまざまありますが、通常、他のインジケーターのすべての値を考慮して抽出しようとします。 つまり、たとえばJPYの強さを計算するためには、アルゴリズムがJPYを含むすべてのペアで同じインジケーターの値を分析します。 この概念は、Currency Magician Matrixに新しい場合は少し混乱するかもしれませんが、心配しないでください。さらに読んでいくことで理解できます。 Currency Magician Matrixは、8つの主要通貨の強さを測定するため
Support Resistance Catcher Indicator Features and Explanation Overview: The Support Resistance Catcher is a custom MT5 indicator designed to identify and visualize supply (resistance) and demand (support) zones based on candlestick price action. It detects zones where price has reversed after rallies or drops, using wick rejections and clustering. The indicator draws horizontal rectangles for active and historical zones, with customizable colors, labels, and alerts. Key Features: 1. Zone Det
一言でいうと このインジケーターは RSI と MACD という2人の専門家を1つにまとめたもの です。2つのチャートを別々に見て判断する代わりに、両方が同意したときだけ「買い」または「売り」の矢印を表示します。 矢印は再描画されません 。一度出現すれば、そのまま固定されます。 「コンボ」の意味 通常、トレーダーは RSI(値動きの勢い)と MACD(トレンドの方向)を別々に見ます。しかし両者が矛盾することも多いです。 このインジケーターでは、 両方が同時に同意したときのみシグナル を出します。これにより、多くの偽シグナルが排除されます。 画面で見えるもの 価格チャートとは別のインジケーターウィンドウ 青と赤の矢印 —— そのまま使えるシグナル 拡大表示された MACD ヒストグラム(見やすく強調されている) RSI と MACD のラインも表示されるが、注目すべきは矢印 こんな人におすすめ 初心者 —— 2つのインジケーターを別々に解釈し、矛盾に対処する必要がない 経験者 —— シグナルの高速フィルタリングと、再描画しないクリアなロジック 迷いたくない人 —— 「買い」「売り」「待て
Meridian Edge Gold
Ignacio Agustin Mene Franco
MERIDIAN EDGE v1.0 — Institutional Series Worldinversor 2026 | Expert Advisor for MetaTrader 5 Meridian Edge v1.0 is an institutional-grade Expert Advisor that combines artificial intelligence, advanced quantitative analysis, and structural market recognition in a single autonomous execution engine. Designed for demanding traders seeking consistency and operational robustness. Artificial Intelligence Engine The core of the system integrates a bidirectional BiLSTM (Bidirectional Long Sho
Volume Arrow Signal Product Description Volume Arrow Signal is a smart trading indicator designed to help traders identify potential buy and sell opportunities using price action, volume behavior, and directional arrow signals. The indicator places clear arrows directly on the chart, making it easy to spot possible market reversals, trend continuations, and entry opportunities without spending hours analyzing charts manually. Whether you are trading Gold (XAUUSD) , Forex pairs, Indices, or Crypt
B2U Ultimate HARSI is a market state & momentum indicator designed for discretionary traders. Part of the B2U Market State System A professional indicator suite designed to analyze market structure, trend state, and momentum. B2U Market State System 의 구성 요소입니다. 시장 구조, 추세 상태, 모멘텀을 입체적으로 분석하기 위한 전문 인디케이터 시스템입니다. Focused on identifying trend state, strength, and sustainability. It visualizes trend direction, strength, and transition, helping you understand the current market condition. No buy/sell
Equinox Gold
Dmitriq Evgenoeviz Ko
Equinox Gold is a high-tech trading expert advisor (EA) specifically designed for the gold market ( XAUUSD ). The system is based on a unique Market Equilibrium algorithm that identifies areas of imbalance between supply and demand during extreme volatility. Unlike most robots that use dangerous sit-and-wait methods, Equinox Gold relies on mathematical momentum confirmation and strict risk control for every trade. MAIN ADVANTAGES VRP Filter (Volatility Range Filter): The robot automatically ada
Manyal trading system, CovEchoTrend Robot, focuses on reliability and flexibility. By employing statistical analysis methods to study the relationships between the base indicator and market patterns, the system enables a deeper understanding of market processes. Intelligent pattern analysis: The application of statistical data processing helps identify key trend reversal points more accurately, signaling significant market shifts. Informed decision-making is based on the intersection of indicato
Expert. Automatic and manual trading. Ready-made trading system based on Elliott waves and Fibonacci retracement levels . It is simple and affordable. Display of the marking of Elliott waves (main or alternative option) on the chart. Construction of horizontal levels, support and resistance lines, a channel. Superposition of Fibonacci levels on waves 1, 3, 5, A Alert system (on-screen, E-Mail, Push notifications).    visual panel for opening orders in manual trading. visual panel for setting up

Why Trade Like the Average Traders When You Can Snipe at 5-Minutes TF With a Powerful Sniper tool which Gives Good Returns ? The market gives us the biggest short term but definite moves on the lower timeframes. But finding the exact moment to enter on a time frame like 5-minute chart is almost impossible—unless you know exactly where the "Big Money" is waiting.                                                    Meet the   5 Minutes Super Sniper. A top-down analyzing tool whic
GOLD SNIPER VISION If you trade Gold, this indicator was built for you. GOLD SNIPER VISION is a professional XAUUSD trading indicator for MetaTrader 5, designed to identify high-quality trading opportunities through multi-timeframe market analysis. KEY FEATURES • Clear BUY & SELL signals • Entry, Stop Loss & Take Profit levels • Multi-Timeframe market analysis • Multiple Scalping & Swing modes • Automatic market analysis • Professional dashboard • Designed specifically for Gold (XAUUSD) TR
Rating Meter:26本のインジケーターを1つの総合レーティングに Rating Meter は、人気の高い26本のインジケーターのシグナルを自動で計算し、「売り/中立/買い」というシンプルなレーティングにまとめます。インジケーターのウィンドウをひとつずつ開いて数値を見比べる必要はありません。パネルをひと目見るだけで、選択した時間足で相場がどちらに傾いているかが分かります。 Our products: https://www.mql5.com/en/users/trendhunter/seller パネルの表示内容 **Oscillators ゲージ:**11本のオシレーターで構成されるグループのレーティングです。RSI、Stochastic、CCI、ADX、Awesome Oscillator、Momentum、MACD、Stochastic RSI、Williams %R、Bulls/Bears Power、Ultimate Oscillator が含まれます。 **Moving Averages ゲージ:**15本のトレンド系インジケーターで構成されるグループのレーティン
FREE
TPO Profile MT5
Kyra Nickaline Watson-gordon
Definition : TPO is a Time Price Opportunity. Instead of using bars or candles with an Open, High, Low, and Close price, each "bar" in a Market Profile is represented by horizontal bars against the price It is called Market Profile terminology. In other words time-price-opportunity (TPO) profiles are histograms of how much time was spent at each price within the span of the profile. By using a TPO chart, you are able to analyze the amount of trading activity, based on time, for each price level
How it works –   Base-departure detection — algorithmically finds consolidation bases (overlapping range with compressed volatility) followed by displacement departures. Patterns: Drop-Base-Rally, Rally-Base-Drop, Rally-Base-Rally, Drop-Base-Drop — detected structurally, not by candle names. –   Strength score (0–100) — from departure velocity, time-at-base, freshness (each revisit decays the score), higher-timeframe confluence and origin volume. –   Lifecycle — Fresh, Tested (decaying), Broken
FREE
Cortex Fibo Pro is an advanced math-based daily level projection indicator designed to calculate high-probability trade setups. It utilizes daily Fibonacci expansions based on previous day highs and lows, filtered through a non-repainting dual moving average synergy structure. Key Features: Neural MA Alignment: Aligns Trend and Signal channels to verify directions. Fibo Projection Engine: Projects daily key entry levels and mathematical profit targets. Ergonomic GUI: Highly readable layout track
BlinkBreakout EA is a professional automated trading system for MetaTrader 5 that trades breakouts of session ranges (London/New York) with dynamic ATR-based risk management. The EA identifies the consolidation range at the start of a user-defined session, then automatically enters when price breaks the High or Low. Every trade uses a hard Stop Loss calculated from current market volatility (ATR), with optional Take Profit, Break-Even, and Trailing Stop functions. Key features: • Session-based
Lumin Chart
John John Gutierrez Vivas
LUMIN Chart reads the market structure for you and draws the zones that matter. It finds support, resistance and Order Blocks, scores each one from 0 to 12 and rates it WEAK, MEDIUM or STRONG, so you can see at a glance which levels deserve your attention. This is an indicator only. It does not open, close or modify trades, and it does not need Algo Trading enabled. Key features Scored zones (0–12). Every zone is rated on: impulse leaving the zone rejection wick respected bounces (exhausted zone
RQL Trend Board – Description RQL Trend Board is a simple but powerful multi-timeframe trend dashboard. It shows the current market bias across several timeframes at the same time, using an internal trend-classification method. Each timeframe is displayed as a colored box: Green – bullish bias → look for long setups Yellow – ranging / unclear → no trade zone Red – bearish bias → look for short setups The indicator gives a clear overall picture of where the market wants to go, instead o
FREE
HyperVirtual
Huynh Dang Diep Nguyen
DESIGNED FOR GOLD — XAUUSD M1 HyperVirtual is designed specifically for XAUUSD M1 trading. IMPORTANT: DEFAULT MODE IS FOR MQL5 VALIDATION ONLY. ALWAYS SELECT PROFILE_MODE = SAFE OR AGGRESSIVE BEFORE BACKTESTING OR LIVE TRADING. CAPITAL SCALING (LOT GROWS EVERY $200 OF BALANCE) WORKS ONLY IN SAFE AND AGGRESSIVE. Virtual First - Live Second --------------------------------------------------------- HOW TO TEST THE FREE DEMO IN 3 STEPS --------------------------------------------------------- 1.
Summary: This strategy is designed to trade the EUR/USD currency pair utilizing a sophisticated combination of technical indicators. It seeks to automate the trading process by analyzing market conditions based on various metrics and executing trades following the defined strategy rules. Key Features: Indicators Used : 1.   Williams Percentage Range (WPR) : Used for momentum trading. 2.   MACD : To identify potential buy and sell signals based on the cross of moving averages. 3.   OSMA : A varia
Correlation Basket EA V2.2 Multi-Pair Statistical Arbitrage Expert Advisor for MetaTrader 5 Correlation Basket EA is a professional multi-pair trading system designed to identify temporary statistical divergences between correlated Forex pairs. Instead of relying on a single currency pair, the EA analyzes relationships between multiple instruments and looks for situations where the price relationship between two correlated pairs moves significantly away from its historical equilibrium. Key Featu
SURMAchannelPROは、動的な価格チャネルと明確なトレンドフォロー信号を生成するプレミアム多機能インジケーターです。滑らかなハル移動平均線(HMA)を中核とし、その周囲に動的なサポートとレジスタンスとして機能する複数のチャネルライン(内側、中間、外側)を構築します。インジケーターはチャネルのブレイクアウト/再エントリー時に視覚的な買い/売りの矢印を表示し、ユーザー定義のチャネル幅のパーセンテージに基づいて、Take Profit(TP)とStop Loss(SL)の水平線を自動的に引きます。主な特徴は、設定された履歴期間内の過去すべての信号のパフォーマンス(合計数、T/P、S/L、利益、損失)を追跡する統合統計パネルです。また、次のバーまでのリアルタイムカウントダウンタイマーも含まれます。 主な特徴: 動的マルチラインチャネル:   主要な上限/下限バンドと、市場構造を精密に分析するためのフィボナッチベースの中間線を生成します。 自動信号とバックテスト:   価格とチャネルの相互作用に基づいて買い(緑)と売り(ピンク)の矢印をプロットします。信号のパフォーマンスの完全な履歴記
このプロダクトを購入した人は以下も購入しています
This indicator is based on the crossing of two Moving Average with the RSI It is intended for scalpers Specially designed for Boom and Crash syhtetic indices from Binary.com/Deriv.com It is easy to use and intuitive. We recommend its use on M1 and is equipped with three types of notification Email alert Sound notification Push notification these parameters can be activated and deactivated.
This strategy focuses on identifying and following clear market trends by filtering out noise and short-term fluctuations. Using advanced algorithms, it highlights significant upward and downward movements, enabling traders to make data-driven decisions. The indicator is designed for simplicity and precision, ideal for traders who prefer a systematic approach to trend trading. Whether you're a beginner or an experienced trader, this tool helps you stay aligned with the dominant market direction
FarOne Engine Gann Magnet MTF MT5 – マルチタイムフレーム機関投資家レベル 概要 FarOne Engine Gann Magnet は、ガン50%理論に基づいて主要な機関投資家レベルを表示するプロフェッショナルなマルチタイムフレームインジケーターです。 M1からD1までの7つの時間足において、強力な買いゾーン(Buy Zone)と売りゾーン(Sell Zone)を特定するのに役立ちます。 主な特徴 マルチタイムフレーム分析:M1、M5、M15、M30、H1、H4、D1 を1つのチャートに表示 自動レベル計算:High、Low、Buy Zone、Sell Zone を自動表示 スマートダッシュボード:各時間足の状態をリアルタイム表示 — MAGNET、BUY ZONE、SELL ZONE ヒットカウンター:価格がBuy/Sellゾーンに入った回数を時間足ごとに記録 クリーンなビジュアル表示:ライン、ゾーン、価格ラベルを自由にカスタマイズ可能 リペイントなし:固定ルックバック期間に基づいて計算 軽量設計:すべての時間足を有効に
Dynasty SMC/ICT Terminal — v3.0 "Neon-Ops Edition" An all-in-one Smart Money Concepts / ICT dashboard for MetaTrader 5. It's an indicator, not an auto-trading EA — it never places, modifies, or closes real orders. It scans price action for Order Blocks, Fair Value Gaps, market structure, harmonic patterns, and multi-timeframe momentum, blends everything into one calibratable Master Signal, and — if enabled — builds a fully automated on-chart trade plan with entry, stop loss, three take-profit ta
Trend Sniper X
Sarvarbek Abduvoxobov
4.86 (44)
Trend Sniper X は、トレードの方向性と潜在的な反転ポイントを明確かつ正確に特定するのに役立つ、MetaTrader 5 用のマルチタイムフレーム・トレンドフォロー指標です。 MT4用: https://www.mql5.com/en/market/product/193245 価格情報: 現在の価格はプロモーション価格であり、今後のアップデートや新機能のリリースに伴い変更される場合があります。 ボーナス特典: このインジケーター用の無料自動売買アシスタントEAを入手するには、購入後に an 著者(開発者)へメッセージをお送りください。 Code2Profit チャンネル マルチタイムフレーム分析で相場をマスターしよう! Trend Sniper X で勝率を最大化する方法:重要なルールとセッションのコツ 技術仕様 プラットフォーム MetaTrader 5 インジケータータイプ マルチタイムフレーム・トレンドインジケーター 操作タイムフレーム あらゆるチャートタイムフレームに対応。個別に選択可能な上位タイムフレーム (M1–MN1) を搭載 主要銘柄 FX、ゴールド (X
新たな王者が登場 - インジケーター + 注文管理表示(TP1 + TP2 + TP3)+ オプションのTelegramシグナル送信機能付き(無料) (完全なトレード&シグナルシステム) ゴールド向け最高のEA: Gold Slayer このインジケーターには、高度な戦略、カスタマイズ可能な注文管理システム、そしてエンベロープ拡張を組み合わせた平均回帰システムが搭載されています。さらに、RSIなど複数のインテリジェントな確認フィルターによって、高確率の反転エントリーをBUY・SELLシグナルとして検出します。 単にトレードを学ぶだけでなく、複数ポジションを効果的に管理し、過去に利益を出しているオープンポジションで損失トレードをカバーする方法も学べます。 M5向けに構築・最適化されており、流動性が高くシグナルの精度が安定しているBTCUSDとXAUUSDで優れたパフォーマンスを発揮します。 このインジケーターは、ATRを基に自動計算されたエントリー、ストップロス、テイクプロフィットレベルを備えた明確なLong・Shortシグナルを提供するため、リスク管理が最初から組み込まれています。 マ
Smart Trend Trading System — MetaTrader 5 ご購入後、MQL5で私にメッセージをお送りいただくと、Smart Universal Expert Advisorを無料で受け取れるほか、オンライン講座、PDFマニュアル、非公開グループへのアクセスもご利用いただけます。 STTSは、トレンドの方向、エントリー・決済シグナル、反転ゾーン、重要な価格水準をチャート上にまとめて表示します。システムを参考に手動で取引することも、別の対応EAを接続し、ご自身で選んだ設定に基づいて自動売買することもできます。 ひとつのシステム、4つのトレードアプローチ STTSのトレードアプローチは、大きく4つのカテゴリーに分かれています。 • スキャルピング — 短期的なシグナルや相場の動きを捉えます。 • トレンドトレード — 方向性を評価し、トレンド内の機会を探します。 • 反転トレード — 反転の可能性があるゾーンや方向の変化を見つけます。 • 出来高トレード — 出来高に基づく情報を使い、市場の活発さを評価します。 エントリー・決済の矢印、トレンド情報、サポート・
Zoryk Gold
Reda El Koutbane
4.78 (18)
割引は 24 時間後に終了します — 次の価格は$ 69 ZORYK — MetaTrader 5専用 XAUUSDシグナル・トレードプランニングシステム このような経験はありませんか。 ゴールドを分析し、エントリーを待ち、ようやくポジションを持った直後に価格が逆方向へ動く。 早すぎる決済をしてしまったり、Stop Lossを動かしたり、数秒迷っている間にチャンスを逃したりする。 その後、相場は自分が最初に予想していた方向へ進み、目標へ到達する。 問題は常に方向判断ではありません。 本当の問題は、明確な計画がなかったことです。 どこでエントリーすべきか。 どこでトレードの前提が無効になるのか。 近い利益を確保すべきか、より大きな値動きを待つべきか。 現在のsetupが本当に強いのか、それとも無理にトレードを探しているだけなのか。 ゴールドは非常に速く動きます。 正しい分析でも、明確なプランがなければ数秒で悪い判断に変わることがあります。 ZORYKは、その問題を解決するために開発されました。 ZORYKとは ZORYKは、MetaTrader 5とXAU
あなたのトレード優位性を視界に入れよう! M5 Sniper は MeanFX による新しいインジケーターです。 正確なトレードシグナル と 適応型TP/SLレベル を組み合わせることで、結果として可能な限り最高の統計的トレードを実現します! 5回購入されるごとに価格が上昇し、次の価格は69$です 購入後に私にメッセージを送っていただければ、ヒント/ガイドとボーナスEAをお受け取りいただけます 何が他と違うのでしょうか? Gold XAUUSDにおける 実証済みの統計的パフォーマンス ( ほぼすべてのアセットで機能します 。一貫した結果が得られないまま何でも扱おうとするのではなく、1つの時間足をマスターすることに重点を置いています) 1日あたり1~8回のトレード を各シンボルで実行し、高い勝率と、すべての統計的優位性をこちら側に持つことができます チャート上には 確認済みの BUYおよびSELLシグナルのみを表示 適応型TPおよびSLレベル を各トレードごとにインジケーターが生成 平均Winrate 75%+ 平均 Signal Ratio 最低1.1+ アラーム と通知を 携帯電話
Entry Points Proは、注文を出す前に、どこでエントリーし、どこにストップを置き、どのロットで取引するかを示します。 価格 現在 199 USD、この価格での販売は 10 本です。その後は 249 USD、最終価格は 349 USD です。 私は相場のトレードで収入を得ており、それを公開しています。だから、このインジケーターを誰にでも売る必要はありません。自分の頭で考えるトレーダーのためのツールであり、魔法のボタンではありません。 矢印はローソク足の確定時に表示され、リペイントしません。設定は2つ:あなたの資金と1回のトレードあたりのリスクです。 お支払い前にご確認ください:無料デモはMT5のストラテジーテスターで動作し、2分で済みます。ご購入後は、私が個人的に設定をお手伝いします。 2019年、私はこのインジケーターの実力を世界中に示しました。そのシグナルに従って手動で、リアル口座で、公開の場でトレードしたのです。口座はMyfxbookでモニタリングされ、私はこの実験の経過をFacebookで詳しく発信していました。結果:4か月で10,000ドルが941,411ドルにな
ULTRAは、「オールインワン」方式で機能するテクニカル指標です。市場を独自に分析し、売買シグナルを生成し、ストップロス注文を設定するための水準を表示し、利益を確定したり損失を最小限に抑えたりするためにポジションを決済すべきタイミングを提案します。 つまり、市場の分析方法や、水準(ストップロスをどこに設定すべきか)の見極め方がわからなくても、あるいは資金管理に苦労していても問題ありません。ULTRAがすべて代行してくれます! 購入者限定特典 :「ULTRA」インジケーターをご購入後、私にプライベートメッセージをお送りいただければ、「ULTRA BOT」を無料プレゼントとしてお受け取りいただけます。これは、このインジケーターからのシグナルに基づいて、オープンしたトレードを管理するのに役立つ特別なツールです(各トレードにストップロスを設定し、最適な結果が得られるよう、戦略のルールに従って自動的にトレードを決済します)。  また、インジケーターを最大限に活用できるよう、さまざまな資産向けの既成の設定も購入者の皆様に提供しています。これらの「超お得な特典」を無料で入手するには、私へダイレクトメ
Gann Made Easy   は、ミスター・ギャンの理論を使用した取引の最良の原則に基づいた、プロフェッショナルで使いやすい外国為替取引システムです。 W・D・ガン。このインジケーターは、ストップロスとテイクプロフィットレベルを含む正確な買いと売りのシグナルを提供します。 PUSH通知を利用して外出先でも取引可能です。 ご購入後、取引方法の説明と優れた追加インジケーターを無料で入手するには、私にご連絡ください! おそらく、ギャンの取引手法についてはすでに何度も聞いたことがあるでしょう。通常、ギャンの理論は初心者のトレーダーだけでなく、すでにある程度の取引経験がある人にとっても非常に複雑なものです。なぜなら、ギャンの取引手法は理論的にはそれほど簡単に適用できるものではないからです。私はその知識を磨き、最良の原則を私の外国為替インジケーターに組み込むために数年を費やしました。 このインジケーターは非常に簡単に適用できます。必要なのは、それをチャートに添付し、簡単な取引推奨事項に従うだけです。このインジケーターは常に市場分析の仕事を行い、取引の機会を探します。適切なエントリーポイントを検
SuperScalp Pro
Van Minh Nguyen
4.54 (37)
SuperScalp Pro - Professional Multi-Layer Confluence Scalping System SuperScalp Proは、複数の高度な確認フィルターを追加することで、従来のSupertrendを強化したスキャルピング向けインジケーターです。誤ったシグナルを大幅に減らしながら、成功する可能性がより高いBuy/Sellの取引機会を見つけるのに役立ちます。 BuyとSellの矢印がチャート上に明確に表示され、ATRに基づくStop LossとTake Profitのレベルもリアルタイムで自動計算されます。 ご購入後、MQL5で私にメッセージを送っていただくと、SuperScalp Pro Auto Trader EAを無料で受け取れるほか、ユーザーガイドとプライベートグループへのアクセスもご利用いただけます。 推奨設定ファイルをダウンロード: [Set File] 詳細なドキュメントは製品ブログでご覧いただけます: [User Guide] 最新情報を受け取るには公式チャンネルにご参加ください: [Official Channel] Sup
GoldenX Entry MT5
VividMind Digital Solutions
5 (17)
GoldenX Entryは、MT5向けのインジケーターであり、適応型Smart Entry Trendアルゴリズム、シグナルスコアリングシステム、マーケットレジーム検出機能、およびボラティリティフィルターを備えています。各シグナルには、計算されたエントリーレベル、3つのテイクプロフィット(TP1、TP2、TP3)、およびストップロスレベルが含まれます。本インジケーターは、異なる市場環境に適応するために設計された複数の分析レイヤー上に構築されており、マルチレイヤー分析システムと内蔵オプティマイザーおよび統計トラッキングシステムを組み合わせています。リスク・リワード(RR)指標および過去のトレード履歴に基づく定量分析を提供します。 使い始めは簡単です — 選択した時間足でオプティマイザーを実行し、そのままチャート上でインジケーターを使用します。 コア機能 GoldenX Entryは、シグナルエンジンとトレード管理機能、そして過去統計トラッキングを1つのチャートに統合しています: - 内蔵オプティマイザー: オプティマイザーはチャート上でワンクリックで実行できます。200通りのパラメー
Gold Trend Coach MT5
Cristhian Alexander Gaibor Cuasquer
4.27 (11)
MetaTrader 5 向け、ゴールド(XAUUSD)のリペイントしない売買シグナル。すべてのシグナルに損切りラインと3つの利確ラインが付きます。BOS と CHoCH を使った Smart Money Concepts フィルターで、相場の構造に逆らわず、構造に沿ってトレードできます。パネル上のライブ・メンターが、エントリーから TP3 まで一歩ずつナビゲート。アラートはスマホとあなた自身の Telegram チャンネルに直接届きます。それが Gold Trend Coach。もう一人でトレードすることはありません。 ご購入特典・無料の購入者キット: 1. Telegram Alert Bridge: シグナルをあなた自身の Telegram チャンネルへ。チャートのスクリーンショットと日次レポート付き。 2. ユーザーマニュアルと設定ガイド。 受け取り方: キットはダウンロードファイルには含まれていません。購入後に MQL5 のメッセージでご連絡ください。当日中にお送りします。 $39 と $45 のローンチ価格分は完売しました。現在は次の10本まで $59、その後は $79
SMC Intraday Formula
VividMind Digital Solutions
5 (26)
まず正直に言いましょう。 どんなインジケーターも、それ単体であなたを利益化させることはできません。もしそう言う人がいるなら、それは夢を売っているだけです。完璧な売買シグナル(矢印)を表示するインジケーターは、いくらでも“完璧に見せる”ことができます。正しい過去の区間を拡大して、勝ちトレードだけを切り取ればいいだけです。私たちはそれをしません。 SMC Intraday Formula はツールです。 市場構造を読み取り、最も高い確率の価格ゾーンを特定し、今この瞬間のスマートマネーの痕跡をシンプルな言葉で正確に示します。最終判断はあなたが行います。トレードを実行するのもあなたです。しかし今は「希望」ではなく「精度」でエントリーできます。 私たちはこのインジケーターを、ゴールド(XAUUSD)および主要FX通貨ペアで約3年間、日々のスキャルピングに使用してきました。M1、M5、M15、M30の主要ツールです。これは未来を予測しようとするのではなく、今まさに形成されている高確率セットアップを示し、その理由を説明します。 他のすべてのインジケーターと何が違うのか? ほとんどのトレーディングイ
Boba Analysis Suite
Trade Ready Solutions LLC
5 (2)
Boba Analysis Suite Boba Analysis Suite は、MetaTrader 5 向けの分析インジケーターです。市場構造、重要な価格帯、相場全体の状況を、一つのチャート画面にまとめて表示します。 トレーダーおよびトレーディング指導者としての実務経験をもとに開発され、市場の方向性の評価、重要な価格水準の特定、複数の時間足を組み合わせた分析など、体系的な分析プロセスを支援します。 相場の背景を踏まえた分析 個々のシグナルの意味は、相場の状況によって変わります。Boba Analysis Suite は、現在のチャート状況をより大きな市場構造と関連付け、あらかじめ定めたルールに沿って取引アイデアを検討するための分析を支援します。 主な分析機能: トレンドと市場構造: 市場の方向性と、その背景にある構造を評価します。 重要な価格帯と価格水準: さらに分析すべき重要な領域を視覚的に表示します。 複数の時間足: 異なる時間足の情報を組み合わせ、相場全体の状況を評価します。 視覚的な分析プロセス: 分析情報をチャート上で直接確認できます。 自主的な取引判断を支援 Boba
Gold Entry Sniper – ゴールドスキャルピング&スイングトレード用プロフェッショナル多時間足ATRダッシュボード Gold Entry Sniper は、XAUUSDや他の銘柄向けに正確な 売買シグナル を提供する、MetaTrader 5用の高度なインジケーターです。 ATRトレーリングストップロジック と 多時間足分析ダッシュボード を搭載し、スキャルピングからスイングトレードまで対応します。 主な特徴と利点 多時間足シグナル分析 – M1、M5、M15 のトレンドを同時表示。 ATRベースのトレーリングストップ – ボラティリティに応じて動的に調整。 プロ仕様のチャートダッシュボード – シグナル状況、ATRレベル、回帰線、売買方向を表示。 明確な売買マーカー – 自動矢印とテキストラベル。 エグジットアラートとトレード管理 – 利益確定のための自動検出。 完全カスタマイズ可能 – パネル位置、色、フォント、ATR/回帰設定を調整可能。 ゴールド(XAUUSD)に最適化 – M1〜M15のスキャルピングに最適、FXや指数、暗号資産にも対応。 Gold Entry
次回アップデート — バージョン 2.52 近日公開!【新機能】 市場分析とトレードワークフローを強化する、4つの主要な新機能にご期待ください 皆様のトレードニーズに応える4つの新機能により、市場分析を次のレベルへと引き上げます。新機能をご紹介します: 1. TRADE OVERVIEW DASHBOARD 2. CONFLUENCE AT ZONE 3. STRONG & WEAK HIGH/LOW 4. OTE 1. TRADE OVERVIEW DASHBOARD 市場全体の状況をより簡単に把握できるダッシュボードです。トレード判断をサポートするガイダンスを提供し、市場分析とトレード計画を体系的に行えるよう支援します。すべてを1つの画面で確認できます。 マルチタイムフレーム市場概要(Multi-Timeframe Market Overview) 市場の方向性と価格構造をより明確に把握 市場状況をすばやく確認 体系的な市場分析とエントリー計画のためのガイダンス 2. CONFLUENCE AT ZONE 価格が重要なゾーンに入るとき…いくつのサポート要因が一致しているかを確認で
FX Power: 通貨の強弱を分析して、より賢い取引を実現 概要 FX Power は主要通貨と金の実際の強弱をあらゆる市場状況で理解するための必須ツールです。強い通貨を買い、弱い通貨を売ることで、 FX Power は取引の意思決定を簡素化し、高い確率の取引機会を見出します。トレンドを追従する場合でも、極端なデルタ値を使用して反転を予測する場合でも、このツールはあなたの取引スタイルに完全に適応します。ただ取引するだけではなく、 FX Power で賢く取引をしましょう。 1. なぜ FX Power がトレーダーにとって非常に有益なのか 通貨と金のリアルタイム強弱分析 • FX Power は主要通貨と金の相対的な強弱を計算し、マーケットダイナミクスに関する明確な洞察を提供します。 • どの資産がリードしているか、または後れを取っているかを監視して、取引するペアを賢く選びましょう。 マルチタイムフレームの包括的なビュー • 短期、中期、長期のタイムフレームで通貨と金の強弱を追跡し、マーケットトレンドに基づいて取引戦略を調整できます。 • スキャルピングからスイングトレード
M1 SNIPER は使いやすいトレーディングインジケーターシステムです。M1時間足向けに設計された矢印インジケーターです。M1時間足でのスキャルピングのためのスタンドアロンシステムとして、また既存のトレーディングシステムの一部としても使用できます。このトレーディングシステムはM1時間足での取引に特化して設計されていますが、他の時間足でも使用できます。元々、この手法はXAUUSDとBTCUSDの取引用に設計しましたが、他の市場においても役立つと考えています。 インジケーターのシグナルは、トレンドの方向と逆方向に取引できます。インジケーターのシグナルを利用して両方向に取引するのに役立つ特別な取引テクニックをご紹介します。この手法は、特別な動的なサポートとレジスタンスの価格帯を利用することに基づいています。 ご購入後、M1 SNIPER矢印インジケーターをすぐにダウンロードできます。さらに、M1 SNIPERツールのすべてのユーザーに、以下のスクリーンショットに表示されているApollo Dynamic SRインジケーターを無料で提供しています。この2つのインジケーターを組み合わせることで
FiboSniper Pro – Multi-Filter Fibonacci System with Auto SL/TP and Control Panel FiboSniper Proは、動的なFibonacci Envelopesと複数の確認フィルターを組み合わせ、選別されたBuyおよびSellシグナルを生成するテクニカルインジケーターです。FibonacciレベルはMoving AverageとATRを基に計算され、その後ADX、EMA、RSI、ATR、Volume、Time、Candle構造によってフィルタリングされます。インジケーターは、ATRに基づく自動Stop LossおよびTake Profitレベルをチャート上に直接表示し、さらに迅速な調整が可能なインタラクティブControl Panelを提供します。 ご購入後、MQL5で私にメッセージを送っていただくと、Auto Trader Xを無料で受け取れるほか、このインジケーターの取引シグナルを自動化する方法についての説明もご利用いただけます。 User GuideとSet Files: [Click here] 完全
Auto Optimized SpeedAngle は、継続的なウォークフォワード最適化(WFO:Walk-Forward Optimization)によりカーブフィッティング(過剰最適化)を排除した、機関投資家レベルのモメンタムベクトルシステムです。市場レジームの変化時に効果が低下する静的な入力に依存せず、アウトオブサンプル(OOS)検証を用いてパラメーターを動的に再キャリブレーションすることで、表示されるシグナルが単なる過去の偶然ではなく、確実な統計的優位性に基づいていることを保証します。 主な機関投資家向けフレームワーク ウォークフォワード最適化エンジン: ルックバック期間やしきい値の数千に及ぶ組み合わせを継続的にスキャンし、データをインサンプルとアウトオブサンプルに厳格に分離します。未検証のデータ環境において数学的優位性が証明された場合にのみ、新しいパラメーター設定を採用します。 定量的目的関数: 単なる純利益の追求ではなく、機関投資家レベルの安定性指標をターゲットとします。システム品質ナンバー(SQN)、期待値(1トレードあたりの平均Rマルチプル)、またはネットRの最適化を選
Sqn Max Indicator Sqn Max is an exclusive indicator to trade the market with high effectiveness. The indicator is based on price action, volatility and trend. This indicator is as simple as possible but not too simple. The indicator can generate alerts to ease the trading process. You don't have to stay all day in front of your screen. The indicator can be used with any class of assets and with any time frame. It is possible to achieve better results trading our list of selected assets. We achi
Smc Pro ToolKit
Talal N Z Aljarusha
5 (14)
SMC PRO TOOLKIT — SMART MONEY ANALYSIS & STRUCTURED TRADE PLANNING SMC Pro ToolKit is a professional Smart Money Concepts analysis workspace for MetaTrader 5. It combines market structure, multi-timeframe analysis, institutional price zones, setup evaluation, confirmation tools, volume context, alerts, and risk planning inside one organized chart environment. One workspace. Multiple layers of confirmation. One structured trading plan. OPEN COMPLETE USER GUIDE MULTI-CONDITION SETUP ENGINE At
SIO Oscillator:自己最適化型セミバリアンス・インバランス・オシレーター インジケーターをご購入いただくと、それをベースにしたエキスパートアドバイザー(EA)を無料でお受け取りいただけます。 多くのオシレーターは、すべての価格変動を同じように扱います。SIOは上昇圧力と下降圧力を分けて捉え、その間のインバランス(不均衡)を測定することで、買い手と売り手のどちらが本当に相場を支配しているかを示します。インバランスが極値に達すると、SIOはエントリー、ストップロス(Stop Loss)、テイクプロフィット(Take Profit)の水準を伴う明確なシグナルを表示します。 SIOの大きな特長は、固定パラメーターに頼らないことです。内蔵の自己最適化機能が、現在の銘柄と時間足に適したパラメーターを継続的に探索し、使用する前に検証します。 2つのシグナルモード 平均回帰(Mean Reversion):インバランスの極値で取引し、均衡への回帰を狙います。 トレンドフォロー(Trend Following):持続的で優勢なインバランスの方向に取引します。 自動モード:最適化機能が直近のデ
Power Candles V3 - 自己最適化型強弱インジケーター Power Candles V3は 、通貨や銘柄の強さを、適用されたすべてのチャート上で実行可能なトレードプランに変換します。単にローソク足を色分けするだけでなく、バックグラウンドでリアルタイムの自動最適化を実行し、目の前の銘柄に対して最適なストップロス、テイクプロフィット、およびシグナルの閾値を提示します。ワンクリックで実取引に適用でき、エントリーポイント、ストップロス、テイクプロフィットのラインが正確な価格位置にチャート上に表示され、方向性を示すアラートがリアルタイムで発動します。 このツールは、Stein Investmentsのエコシステムの一部です。  18種類以上のツールをすべて閲覧し、AIを活用したセットアップの推奨事項を入手し、  https://stein.investments でコミュニティに参加しましょう クローズしたバーごとに3,000回以上のトレードシミュレーション。9つの強さの状態。2つの戦略を並行してテスト。勝率の高い設定をワンクリックで適用。 なぜこれが必要なのか ほとんどの強
Atomic Analyst — MetaTrader 5 ご購入後、MQL5で私にメッセージをお送りいただくと、Smart Universal Expert Advisorを無料で受け取れるほか、オンライン講座、PDFマニュアル、非公開グループへのアクセスもご利用いただけます。 Atomic Analystは、プライスアクション、トレンドの方向、エントリー・決済シグナル、損切り水準、複数の利確水準をチャート上にまとめて表示します。 シグナルを確認し、取引の状況を理解する Atomic Analystは、分析結果をわかりやすい視覚情報として表示します。 • エントリーの候補を見つけるための買い・売りの矢印。 • 取引計画に役立つ損切り水準と複数の利確水準。 • 市場の方向性を評価するトレンド、強さ、モメンタムの指標。 • より広い市場背景を比較する複数時間足の分析。 • 変化する状況を追うための色分けされたローソク足とアラート。 シグナルと補助分析を併せて確認し、その取引機会がご自身のルールに合うかを判断してください。 短期の取引機会から、より大きな値動きまで Atomic A
Unix Scalper — MetaTrader 5 ご購入後、MQL5で私にメッセージをお送りいただくと、Smart Universal Expert Advisorを無料で受け取れるほか、オンライン講座、PDFマニュアル、非公開グループへのアクセスもご利用いただけます。 セットアップを見つけ、取引プランを確認し、取引方法を選ぶ。 UNIX Scalperは、市場分析、BUY/SELL/WAITの判断、Entry、Stop Loss、TP1、TP2の水準を、見やすいパネルにまとめています。 シグナルと取引プランを確認 • 明確な判断:BUY、SELL、WAIT。 • 明示された水準:Entry、Stop Loss、TP1、TP2。 • 複数時間足の一覧:パネル上で各時間足のシグナルを比較。 • 判断を支える分析:トレンド、モメンタム、出来高、ボラティリティ、サポートとレジスタンス、市場の質。 • 選べるレイアウト:Minimized、Compact、Standard、Full。 シグナルと各水準を確認し、そのセットアップがご自身の取引ルールに合うか判断してください。 ゴール
Tokyo Indicatorは、トレンドの方向性、潜在的な取引シグナル、および市場状況を視覚的に分かりやすく表示します。 色分けされた階段状のトレンドラインにより、強気局面(青色)と弱気局面(マゼンタ色)が明確に区別されます。トレンドの変化に合わせて表示される方向矢印は、売買の好機を強調します。 統合されたダッシュボードには、現在のシグナル、市場のバイアス(傾向)、モメンタム、ボラティリティ、シグナルの品質がひと目で分かるようにまとめられています。これにより、トレーダーはパネルを切り替えることなく、価格変動(プライスアクション)とインジケーターの数値を照らし合わせて分析を行うことができます。 すっきりとしたチャート表示と簡潔な市場概要により、Tokyo Indicatorはトレンド分析や取引判断における体系的なアプローチをサポートします。 あらゆる時間足や銘柄に対応しており、特に金(ゴールド)の取引に適しています。 トレンド スキャナーの強力なサポートを利用して、無料のインジケーターを入手し、プライバシーを守ります。あーみー!     設定 ShowHUD - チャート上のパネ
作者のその他のプロダクト
FRONTIER PIVOTS - Geometric Levels Indicator This indicator plots support and resistance levels/ranges on the chart using mathematical calculations. It helps traders identify potential price reaction zones based on geometric patterns. Main Features: Automatically calculates and displays key price levels Plots both support and resistance lines Uses daily price data for level calculation Clean visual presentation with different colors for different level types No repainting - levels remain static
FREE
Projection of Phi   Is a technical indicator that calculates dynamic support and resistance levels. It uses angular geometric projections and mathematical ratios to identify market expansion ranges. Features: Dynamic Fibonacci Expansion: Extension level projection Geometric Calculation: Angular analysis and mathematical ratios Visualization: Graphical objects with informative labels Compatibility: M1 to H4 timeframes Applications: Identification of zones for trade management Analysis of volatil
FREE
Harmonic Patterns SwingCore Pro | For MetaTrader 5 (MT5) Technical analysis indicator for detecting and visualizing harmonic patterns on the chart, with Fibonacci level projection and configurable alert system. ================================================================================ WHAT THIS INDICATOR IS It is a visual analysis tool. Its function is to identify structures on the chart that satisfy the geometric relationships of six classic harmonic patterns: Gartley, Bat, Butterfly
フィルタ:
レビューなし
レビューに返信