Multiple Timeframe Filtered MA Crossover Indicator

BEFORE YOU PURCHASE — PLEASE READ

A free version of this indicator is available. Please purchase this paid version only if you want complete control over how the moving averages are configured, or if you simply want to support my work.

The default settings are examples only and are not guaranteed to make money. You should already have a moving-average strategy that you have tested and believe works for you. This indicator is a tool for applying that strategy without constant chart monitoring.


WHAT IS DIFFERENT ABOUT THE PAID VERSION

The free version uses a fixed library of pre-built moving averages. You select an MA such as EMA 14 or WMA 100 from a dropdown.

The paid version removes that limitation. Every MA used by the indicator — crossover MAs, validation MAs, and higher-timeframe trend-filter MAs — is fully configurable.


For every MA you can set:
• Period — any integer, such as 7, 14, 100, 350 or 999
• Shift — forward/backward shift, default 0
• Method @ Applied Price — one dropdown combining 4 smoothing methods and 7 price types (28 combinations)

Smoothing methods:
• Simple (SMA)
• Exponential (EMA)
• Smoothed (SMMA)
• Linear Weighted (LWMA)

Applied prices:
• Close
• Open
• High
• Low
• Median Price (HL/2)
• Typical Price (HLC/3)
• Weighted Close (HLCC/4)

This lets you configure combinations such as EMA 200 on High, SMA 55 on Typical Price, or LWMA 13 on Weighted Close — or create your own combination directly from the indicator inputs.

Everything else — signal timing, arrows, alerts, MTF RSI, MTF MACD, the previous-candle Fibonacci/price filter, and trading periods — works as in the free version.

WHAT MAKES THIS INDICATOR DIFFERENT

Most MA crossover indicators simply watch two MAs and fire an arrow whenever they cross. They do not necessarily consider market structure, higher-timeframe direction, momentum, or where price is trading.

This indicator is built around a different idea: a crossover can be filtered by the context surrounding it.

You can:
• Use up to 11 configurable MAs on the signal timeframe and require them to be in a specific order.
• Filter signals using an MA trend structure from another timeframe.
• Require MTF RSI and/or MACD conditions.
• Require the crossover to occur inside a defined Fibonacci/price zone based on the previous higher-timeframe candle.
• Restrict signals to selected trading periods.

Enable as many or as few filters as your strategy requires. The goal is not to produce more arrows, but to let you define exactly which conditions a signal must satisfy.

CLEAN CHART DESIGN

The indicator does not draw the moving averages that drive its calculations. It draws only the signal arrows you choose to display. This keeps the chart clean for price action, trendlines, order blocks, other indicators, and other analysis.

If you want to see the MAs, add them manually using the same period, shift, method, and applied price configured in the indicator. You can then save them in a chart template and restore them with one click.

This also gives you a simple way to visually verify the indicator: you can see the actual MA crossover and confirm that the corresponding arrow/alert appears where expected.

HOW THE INDICATOR WORKS

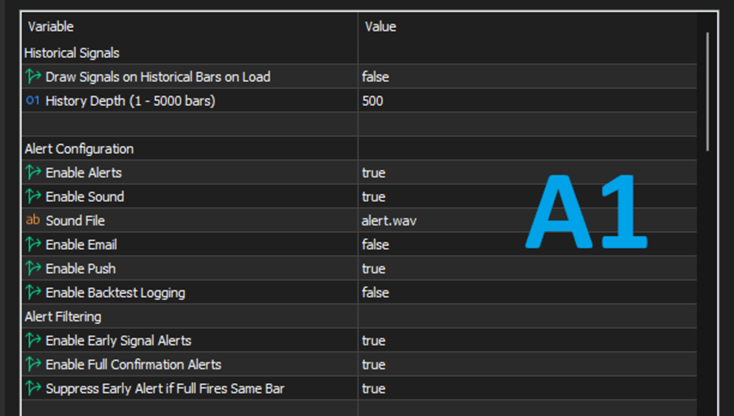
  1. ALERT CONFIGURATION (Image A1)

Each alert type can be enabled independently:
• Enable Alerts — pop-up alert window
• Enable Sound — plays your selected .wav file
• Enable Email — sends to your terminal-configured email
• Enable Push — sends to the MetaTrader mobile app
• Enable Backtest Logging — writes diagnostic values to the Experts log for tuning

  1. ALERT FILTERING

• Enable Early Signal Alerts
• Enable Full Confirmation Alerts
• Suppress Early Alert if Full Fires Same Bar — if Early and Full fire on the same bar in the same direction, only the Full alert is sent.

  1. ARROW APPEARANCE

• Draw Arrows — No Arrows, Early + Full Signals, or Full Signals Only
• Arrow Size — 1 to 5
• Arrow Distance from Candle — pixel offset

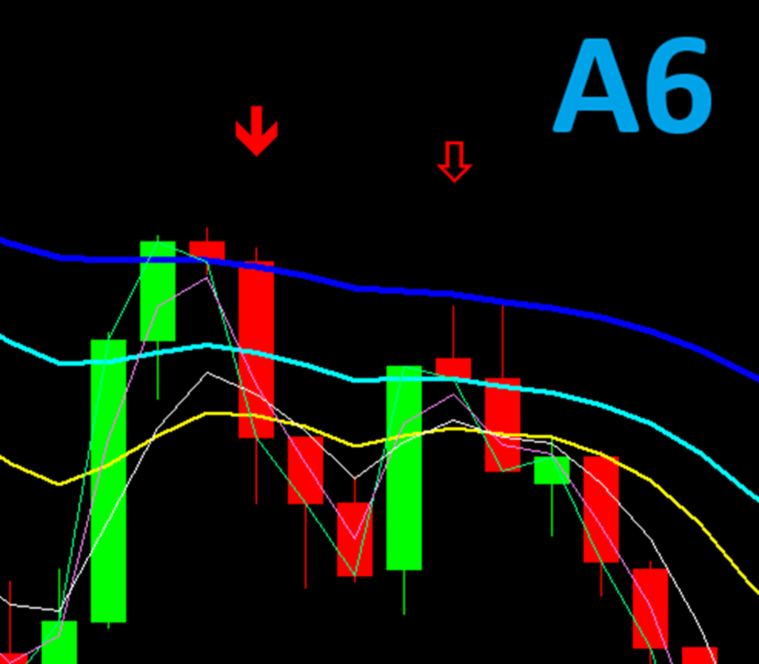
Image A6—Screenshot showing the indicator's arrow appearance, with the hollow arrows representing the early signals and the full body colored arrows representing full signals.

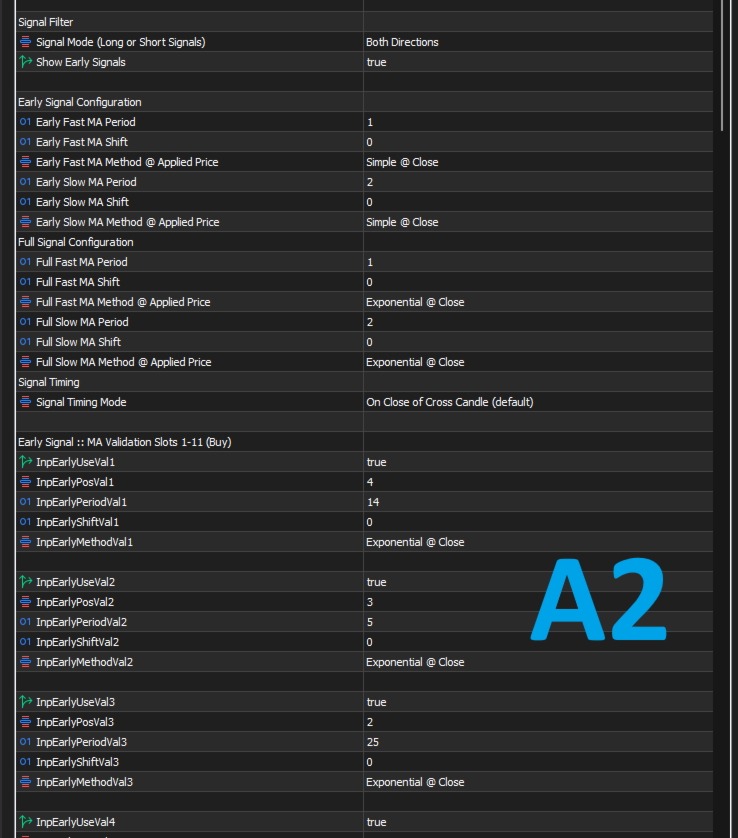
  1. SIGNAL FILTER (Image A2)

• Signal Mode — Long Only, Short Only, or Both Directions
• Show Early Signals — master switch for the Early subsystem

  1. EARLY SIGNAL CONFIGURATION

The Early signal detects the crossover earlier in its development, before the full validation stack has necessarily aligned. It provides an early indication that a Full signal may be forming.

Configure:
• Early Fast MA Period
• Early Fast MA Shift
• Early Fast MA Method @ Applied Price
• Early Slow MA Period
• Early Slow MA Shift
• Early Slow MA Method @ Applied Price

All six inputs are fully configurable. For example, you can use 1 SMA crossing 2 SMA, 9 EMA crossing 21 EMA, or 8 EMA on High crossing 21 LWMA on Typical Price.

  1. FULL SIGNAL CONFIGURATION

The Full signal is the confirmed crossover. It fires only when the crossover occurs and all enabled validation/filter conditions agree.

Configure:
• Full Fast MA Period
• Full Fast MA Shift
• Full Fast MA Method @ Applied Price
• Full Slow MA Period
• Full Slow MA Shift
• Full Slow MA Method @ Applied Price

The Full pair can be completely different from the Early pair, allowing a two-stage system: an aggressive Early crossover followed by a stricter Full confirmation.

  1. SIGNAL TIMING

• Intrabar — detects signals on the live, still-forming candle. This is the fastest but noisiest mode because the candle can change. Alerts fire, but arrows are not drawn.
• On Close of Cross Candle (default) — detects the signal after the crossover candle closes. Arrows are drawn and the signal does not repaint.
• One Candle After Close — the crossover must have occurred on the previous closed candle and the relationship must still hold on the current closed candle. This filters crosses that immediately reverse.

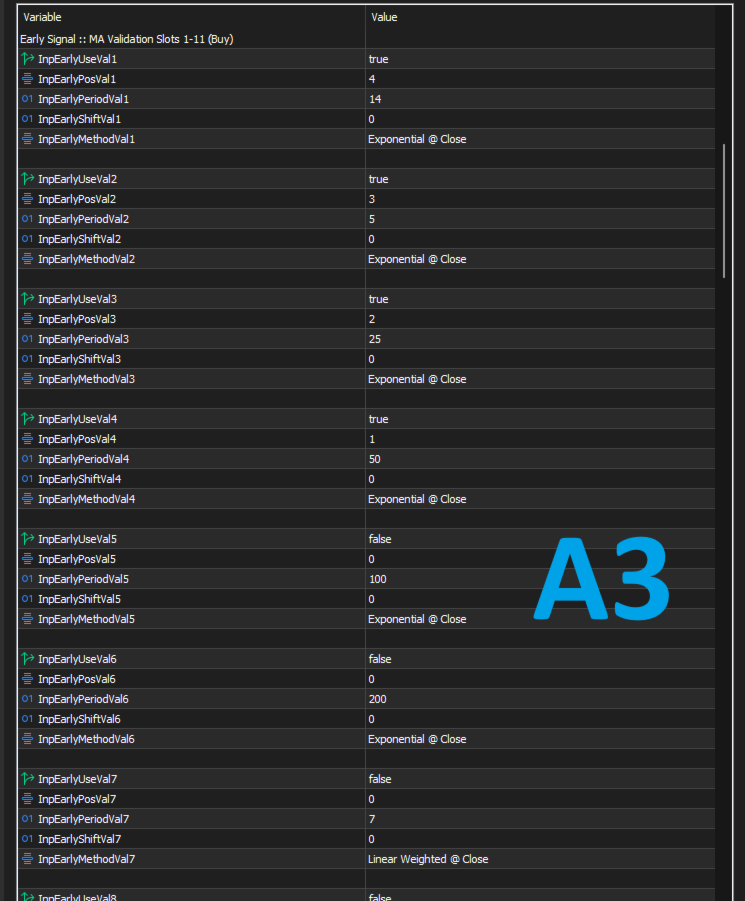
  1. MA VALIDATION ORDER — THE HEART OF THE INDICATOR (Image A3 & Image A6)

There are two validation sections:
• Early Signal :: MA Validation Slots 1–11 (Buy)
• Full Signal :: MA Validation Slots 1–11 (Buy)

Each section provides 11 configurable validation slots. Each slot has:
• Use Validation MA
• Validation MA Position — 0 to 11
• Validation MA Period
• Validation MA Shift
• Validation MA Method @ Applied Price

The Position number is not the MA period. It defines where that MA belongs in your required validation stack.

When a crossover occurs, the indicator checks the enabled MAs against the order you defined:
• Buy — MA values must be in strictly descending order.
• Sell — the same order is checked in reverse, so values must be strictly ascending.

If the required order is not present, the signal is rejected and no arrow/alert is generated.

EXAMPLE

You want a bullish stack to look like this on the chart:

text

EMA 14 (top — highest value) EMA 5 EMA 25 EMA 50 (bottom — lowest value)

You also want the early crossover to be 1SMA crossing 2 SMA  upwards for bullish  signal and 1EMA crossing 2EMA upwards for full confirmation signal.

You would set:

MA Enable Position
EMA 14 yes 4
EMA 5 yes 3
EMA 25 yes 2
EMA 50 yes 1

The indicator sorts these by position, giving [EMA 14, EMA 5, EMA 25, EMA 50] . For a Buy signal it then requires:

MA Order => EMA 14 > EMA 5 > EMA 25 > EMA 50

If that chain holds at the moment of the crossover, the Buy is valid. If EMA 14 pokes above EMA 5, or EMA 25 above EMA 14, the signal is discarded.

Image A3 — showing the indicator's MA validation ordersettings input section on the indicator's menu.

Image A6 — showing how the given example above would look like for a bearish signal. The thick dark blue line at the top is the 50 EMA and the blue aqua line following beneath it is the 25 EMA, followed by 5 EMA which is a thin white line then lastly followed by 14 EMA which is the yellow line. The green and purple lines crossing each other are 1 EMA and 2 EMA respectively. There aren't any visible moving averages on the chart representing 1 SMA and 2 SMA.

Note: If you want to include the moving averages involved in the crossover on the MA validation order section, you can but only the Slow MA, if you include the fast MA asa well, the logic would not work.

This validation layer is designed to reduce signals during choppy conditions where MAs repeatedly cross and tangle. You can use only a few MAs for a looser filter or up to 11 for a stricter structure.

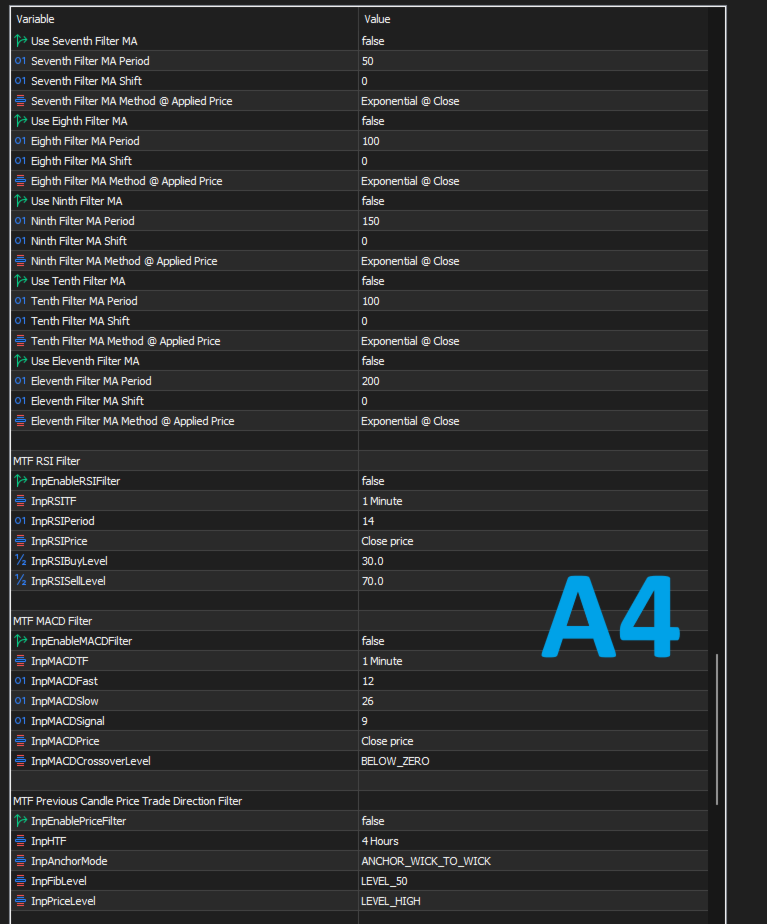
  1. SIGNALS BY MARKET DIRECTION — MTF MA TREND FILTER (Image A4)

This filter checks the trend structure on another timeframe. It is separate from the validation stack, which checks the current signal timeframe.

Settings:
• Enable Signals by Trend Direction Only
• Filter Mode:

  • Include Price — Buy requires Price > MA1 > MA2 > ... > MA11

  • MA Only — requires MA1 > MA2 > .. > MA11 and ignores price
    • MA(s) Filter Timeframe — the timeframe used for the trend filter

Up to 11 filter MAs can be configured, each with:
• Use Filter MA
• Period
• Shift
• Method @ Applied Price

Example: If you trade M5 but want signals only in the H1 trend direction, set the filter timeframe to H1 and configure your H1 MAs. An M5 Buy that conflicts with the H1 structure is rejected.

  1. MTF RSI FILTER

RSI can be evaluated on a different timeframe from the chart.

Settings:
• Enable RSI Filter
• RSI Timeframe
• RSI Period
• RSI Applied Price

• RSI Buy Threshold — Buy signals pass only when RSI is at or below this level (default 30)
• RSI Sell Threshold — Sell signals pass only when RSI is at or above this level (default 70)

  1. MTF MACD FILTER

MACD can also be evaluated on any selected timeframe.

Settings:
• Enable MACD Filter
• MACD Timeframe
• MACD Fast
• MACD Slow
• MACD Signal
• MACD Applied Price
• Crossover Level — Below Zero or Above Zero

Below Zero can be used for momentum reversals from lower levels, while Above Zero can be used for continuation within an established trend.

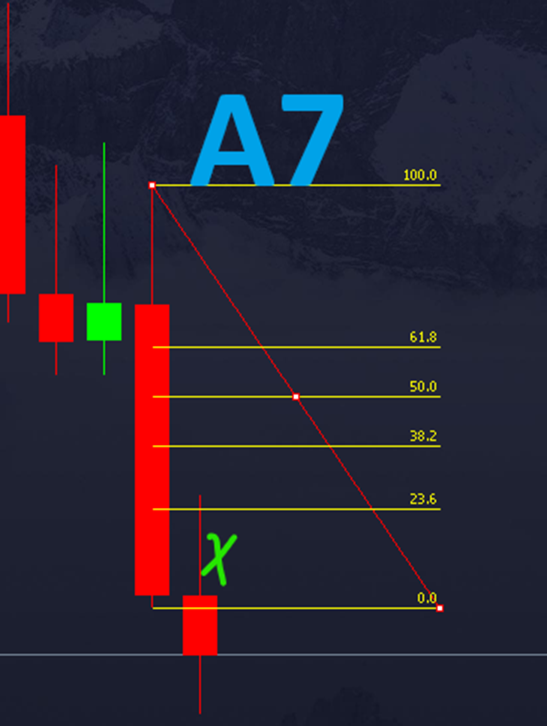
  1. MTF PREVIOUS CANDLE PRICE / FIBONACCI FILTER (Images A4, A7)

This optional filter uses the most recently completed higher-timeframe candle to define an acceptance zone. A crossover is accepted only when it occurs inside the zone you configure.

The filter is OFF by default. When enabled, a signal that does not satisfy its rules is rejected even if all other enabled filters agree.

CONFIGURATION

  1. Previous Candle Timeframe
    The timeframe whose most recently closed candle is used as the reference, typically H4, D1, or W1. It must be higher than the chart timeframe; a lower setting is blocked with an error.

  2. Fibonacci Anchor
    Choose how the Fibonacci range is anchored:
    • Wick to Wick — High (100%) to Low (0%), including wicks
    • '[ — top of body (100%) to bottom (0%), ignoring wicks

  3. Fibonacci Level
    Available levels:
    23.6%, 38.2%, 50.0%, 61.8%, 78.6%, 100.0%, and 107.0%.

The 107% level extends beyond the opposite extreme and can be used to include a sweep/stop-hunt area beyond the previous candle's high or low.

  1. Price Reference Level
    Choose Open, High, Low, or Close from the previous candle.

The selected Fibonacci price and Reference price form the acceptance zone. The indicator sorts the two prices automatically so the zone is always well-defined.

DIRECTION RULE

• Buy — the previous higher-timeframe candle must be bullish.
• Sell — the previous higher-timeframe candle must be bearish.

If the previous candle's direction does not match the signal direction, the signal is rejected before the zone is calculated.

EXAMPLE

For a bearish previous candle, the Fibonacci range can be drawn from its High (100%) to Low (0%). If a Sell crossover occurs inside the selected retracement zone, it can pass the filter. If a later crossover occurs after price has moved outside the permitted zone, it is rejected.

IMPORTANT: DIPS ARE FORGIVEN

The zone is checked at the moment the crossover occurs. Earlier price movement during the current period does not automatically disqualify the signal.

If you are new to this approach, example starting combinations are:
• H4 reference candle + M1 crossover signals
• D1 reference candle + M15 crossover signals
• W1 reference candle + H4 crossover signals

These are starting points, not fixed rules. You can combine any higher-timeframe reference candle with any lower signal timeframe, provided the reference timeframe is higher.

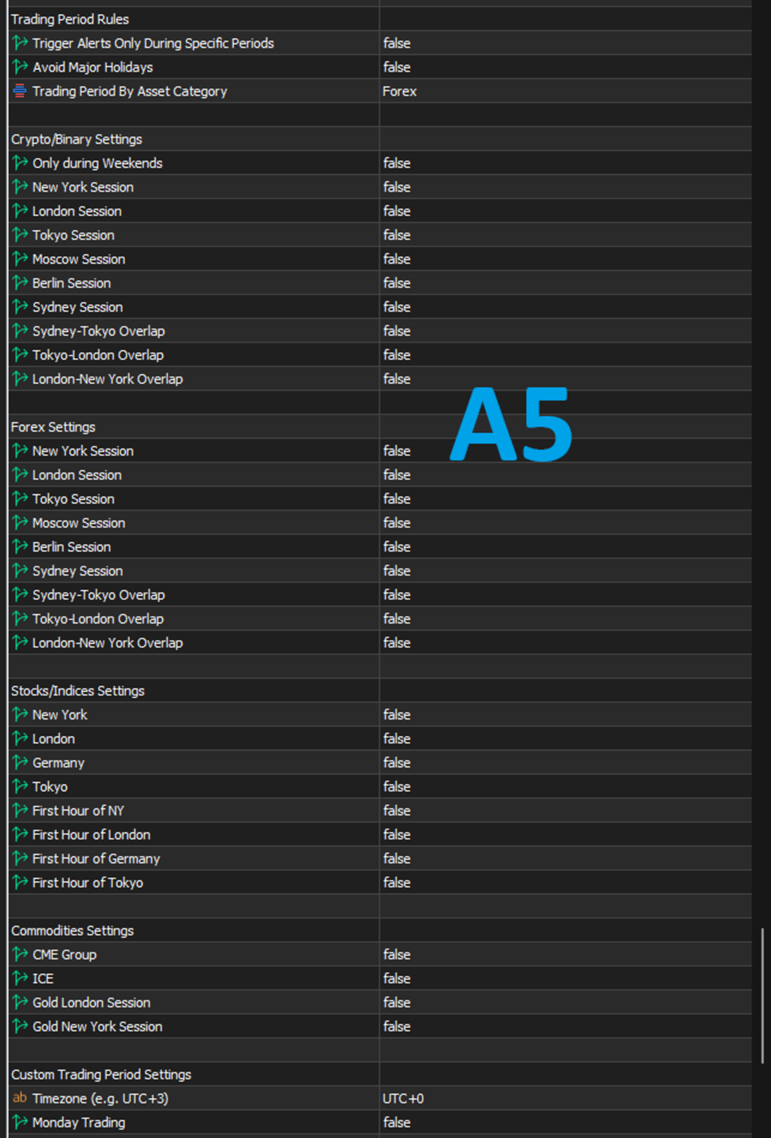
  1. TRADING PERIOD RULES

Restrict signals to selected hours or market sessions.

Options include:
• Trigger Alerts Only During Specific Periods
• Avoid Major Holidays — New Year, Christmas, US Independence Day, and US Thanksgiving
• Trading Period by Asset Category

Crypto / Binary:
• Includes a weekends-only option

Forex:
• New York, London, Tokyo, Moscow, Berlin, Sydney
• Sydney–Tokyo, Tokyo–London, and London–New York overlaps

Stocks / Indices:
• NYSE, LSE, FWB, and TSE sessions
• First-hour-after-open filters

Commodities:
• CME, ICE, London Gold, and New York Gold sessions

Custom:
• Day-by-day schedule with timezone offset, start hour, and end hour

SUMMARY — WHAT THE PAID VERSION ADDS

Compared with the free version, the paid version provides:

• Full control of every MA used by the indicator: period, shift, method, and applied price
• 28 Method @ Applied Price combinations for every configurable MA
• 11 configurable validation slots for Early signals
• 11 configurable validation slots for Full signals
• 11 configurable MTF trend-filter MA slots
• Flexible signal timing: Intrabar, On Close, or One Candle After Close
• Early and Full signal systems with independent MA configurations
• MTF RSI filter
• MTF MACD filter
• Previous higher-timeframe candle Fibonacci/price filter
• Configurable trading sessions and custom trading periods
• Alerts by pop-up, sound, email, and push notification
• Optional backtest/diagnostic logging
• Clean charts with the calculation MAs hidden

If the fixed MA library of the free version already meets your needs, the free version may be all you need. If you want to build your own exact MA configuration and control the validation and trend-filter structures — or simply want to support the work — this paid version gives you that flexibility.

IMPORTANT: This indicator is a technical tool, not financial advice and not a guarantee of profitable results. Test your configuration and understand the settings before using it in live trading.

Please feel free to join this telegram group where users can share their stratergies and settings that work for them using this indicator --> t.me/MTFMACS
おすすめのプロダクト
This indicator works on atr with some edited . The AI ​​MACD FILTER indicator is used for confirmation. Certainly, the indicator contains an alert when the signal appears, and you use the exit of the deal on the saturation that occurs at the AI ​​MACD. The accuracy of the work is high on gold, the time frame is five minutes, while staying away from trading at the time of news that occurs on the US dollar. And using high liquidity trading times, which are two hours before the opening of the Lond

Introduction to Fractal Pattern Scanner Fractal Indicator refers to the technical indicator that makes use of the fractal geometry found in the financial market. Fractal Pattern Scanner is the advanced Fractal Indicator that brings the latest trading technology after the extensive research and development work in the fractal geometry in the financial market. The most important feature in Fractal Pattern Scanner is the ability to measure the turning point probability as well as the trend probabil
ACA Blackbird PRO MTF Market Scanner Institutional Smart Money Signal Engine | AI Confluence System         Your Ultimate Manual‑Trading Toolkit — Built for Real Traders, Not AI Consensus Hype or Dangerous Grid/Martingale Systems. TRADE WITH STRUCTURE — NOT GUESSWORK ACA Blackbird PRO is a professional-grade trading intelligence system built to detect, rank, and deliver high-probability trade setups in real time. This is not a basic indicator. It is a multi-timeframe Smart Money signal en
Pattern Builder Pro — MetaTrader 5 用カスタムスイングパターンスキャナー Pattern Builder Pro は、任意のカスタムスイングパターンを手描きで作成し、複数の時間足にわたって Market Watch 内のすべての銘柄から統計的に類似した値動きの形状をスキャンできる MetaTrader 5 用インジケーター兼マーケットスキャナーです。ヘッドアンドショルダー、トライアングル、フラッグなど固定形状に限定される従来のチャートパターンインジケーターとは異なり、この MT5 パターン認識ツールでは独自のプライスアクションパターンを自由に定義でき(スイングポイント数・形状ともに任意)、Dynamic Time Warping(DTW)や Procrustes 解析を含む 11 項目の重み付け類似度エンジンによりリアルタイムで一致する形状を検出します。 主な機能: XYグリッド上のインタラクティブなパターン描画ボード、ピクセル単位でのスイングポイント配置 多指標類似度エンジン:形状、角度シーケンス、傾き、リトレースメント、エクステンション、スイング比
Sloth Trader
Justus Wamswa Chemirmir
機関投資家のスマートマネー概念を取引するプロフェッショナルな Expert Advisor。多層リスクエンジンを搭載 — 規律正しく、セッションを認識し、完全自動化。 Sloth Trader — 機関投資家型スマートマネー自動化 機関投資家と同じように取引 — チャートを見つめ続ける必要はありません。 Sloth Trader は、スマートマネー手法に基づいて構築された完全自動化 Expert Advisor です。10年にわたる市場構造研究を、単一の規律あるロボットにまとめ上げ、市場をスキャンし、独自の取引計画を立て、すべての取引を最初から最後まで管理します。 これはインジケーターでも、シグナルサービスでも、「設定して祈る」グリッドでもありません。ルールベースでイベントドリブンなシステムであり、独自のコンフルエンスエンジンが同意したときだけ行動し、その後は機関投資家級のリスク管理であなたを守ります。 できること 市場構造インテリジェンス 機関投資家トレーダーと同じように価格行動を読む 高確率の機会ウィンドウが有効なときだけ取引 — 死んだ時間帯にランダムなエントリーはしない エン
HA Supertrend ADX is a MetaTrader 5 trend Expert Advisor inspired by the TradingView Heikin Ashi Supertrend ADX concept. It combines Heikin Ashi candle alignment, Supertrend direction on HA prices, and an ADX strength filter. Features • Heikin Ashi trend confirmation • Supertrend on Heikin Ashi OHLC (TradingView-style) • ADX minimum threshold with optional DI+ / DI- filter • Supertrend flip exit and/or ATR trailing stop • Optional initial ATR stop loss • Margin cap and maximum lot limit • XAU
EventStraddle - 経済指標発表をはさむ両側逆指値とATRトレール 何をするEAか 経済指標の発表直前に、現在値の上下へ逆指値注文を同時に置きます。市場が抜けた側だけ を残して反対側は取り消し、勝った側をATR基準のトレールで伸ばします。それ以外の時間は 待機します。 動作 1. 発表の ArmLeadSec 秒前(既定15分)にATR(H1,14)を読み、上下 ±1.0 ATR に逆指値を置く 2. 各注文の損切りは、その注文の約定価格から 2.0 ATR 3. 片側が約定したら反対側を取り消す(OCO) 4. 含み益が 1.0 ATR に達したら、価格の 0.5 ATR 後ろをストップが追う 5. 遅くとも MaxHoldHours(既定24時間)で決済 6. 約定しなかった注文は発表の CancelAfterSec 秒後に取り消す 発表日程 日程はEAに内蔵しており、外部ファイルもインターネット接続も不要です。販売者から データの提供を受け続ける必要はありません。収録しているのは、FRB・ECB・イングランド 銀行・日本銀行・豪州準備銀行・ニュージ
製品名:ブレイクスルー・トラッカー・トレーディングシステム コアポジショニング 本システムは、長年にわたる実践的なライブトレードの経験を基に構築され、多様な市場環境の中で洗練・最適化されてきました。その根本的な目的は、方向感の乏しいレンジ相場における頻繁なトレードによって生じる口座資金の目減りという慢性的な悩みを、決定的に解消することにあります。コアロジックは一言で要約されます。 「ブレイクアウトのみをトレードし、保合いには一切参加しない」   ということです。私たちは複雑なテクニカル指標の併用を排除し、意思決定プロセスを合理化されたルールベースで再現可能なフレームワークにまで抽出しました。これにより、どのような市場環境においても明確なトレード視点を維持することが可能になります。 適応商品と時間足 本システムは、現物金(XAUUSD)および主要通貨ペア(EURUSD、GBPUSD、USDJPYなど)に深く最適化されている一方、複数の時間足にも対応可能です。 デイトレード(短期)向けには 5分足 を推奨。 スイング/トレンドトレード向けには 1時間足 を推奨。 なお、ご自身のトレ
Automated Supply and Demand Tracker MT5. The following videos demonstrate how we use the system for trade setups and analysis.US PPI, Fed Interest Rates, and FOMC Trade Setup Time Lapse: U.S. dollar(DXY) and Australian dollar vs U.S. dollar(AUD/USD)  https://youtu.be/XVJqdEWfv6s  The EUR/USD Trade Setup time lapse 8/6/23.  https://youtu.be/UDrBAbOqkMY . US 500 Cash Trade Setup time lapse 8/6/23  https://youtu.be/jpQ6h9qjVcU .  https://youtu.be/JJanqcNzLGM ,  https://youtu.be/MnuStQGjMyg,&nbsp ;
the fundamental technical indicator Informative Trend, which allows you to assess the current market situation in order to enter the market of the selected currency pair in a trend and with minimal risk. It basically uses the process of identifying the rate of change in price growth and allows you to find entry and exit points from the market. The indicator was created on the basis of the original indicators for searching for extreme points and is well suited for determining a reversal or a la
The  OBV MTF  is an Enterprise-grade On-Balance Volume indicator that transforms standard OBV into a complete trading system. It combines gradient-aware momentum analysis, divergence detection, multi-timeframe alignment, and dynamic customisable midpoint-filtering in a single intuitive professional volume analysis tool. Core Features 1. 5-State Momentum Engine Aqua (Strong Bullish) : OBV slope rising with positive acceleration SteelBlue (Weak Bullish) : OBV rising but losing momentum Gray (Neutr
Pure Diamond Trend Exhaustion Pure Diamond Trend Exhaustion インジケーターは、市場の勢いの枯渇(エグゾースト)ゾーンと潜在的な価格反転ポイントを特定するように設計されています。コアアルゴリズムは価格の極値とローソク足のヒゲの構造分析に基づいており、標準的な遅行型オシレーターを使用することなく、重要な買われすぎおよび売られすぎのレベルを強調することができます。 技術的特徴: リペイントなし (No Repaint): インジケーターの信号(ダイヤモンド)は、現在のローソク足が確定した直後に固定されます。一度形成された信号は、その後の価格変動で消えたり位置が変わったりすることはありません。 ノイズフィルタリングアルゴリズム: プログラムはローソク足の実体とヒゲの比率を分析し、確立された価格範囲内の偽の変動を排除します。 汎用性: 外貨(FX)、暗号資産、株価指数、コモディティを含むすべての資産タイプに対応しています。あらゆる時間足での使用に適しています。 ミニマリストなインターフェース: 可視化は図形シンボルで実装されているため、
このインジケーターは実践的なトレードに最適な自動波動分析のインジケーターです! 場合... 注:   Tang Lun (Tang Zhong Shuo Zen) の命名規則の影響で、私は波のグレーディングに西洋の名前を使用することに慣れていません。基本的な波を ペン 、二次波のバンドを セグメント と名付けました。同時に、 セグメント にはトレンドの方向が指定されます (この命名方法は将来のノートで使用されます。最初に言っておきます)。ただし、アルゴリズムは曲がりくねった理論とはほとんど関係がないため、付けるべきではありません。これは、私の市場分析 によって要約された、絶えず変化する複雑な運用ルール を反映しています。 バンドは標準化され、人によって異なることがないよう定義されており、市場参入を厳密に分析する上で重要な役割を果たす人為的な干渉の描画方法が排除されています。 このインジケーターを使用することは、取引インターフェイスの美しさを改善することと同等であり、元の K ライン取引を放棄し、取引の新しいレベルに連れて行きます。また、宣伝の観点から顧客の認識も向上します。 イ
# MT5用スクイーズ・モメンタム・インジケーター MetaTrader 5向けにプロが開発した強力な**スクイーズ・モメンタム・インジケーター**で、爆発的な市場チャンスを掴みましょう。 この高度なボラティリティ・モメンタム・インジケーターは、トレーダーが大きな市場変動が起こる前の低ボラティリティ期間を特定するのに役立ちます。ボリンジャーバンドとケルトナーチャネルの強みを組み合わせたこのインジケーターは、市場が「スクイーズ」状態にあり、ブレイクアウトの準備をしているタイミングを明らかにします。 内蔵のモメンタム・ヒストグラムにより、トレンドの方向とモメンタムの変化を容易に把握でき、トレーダーは自信と精度を持ってトレードを行うことができます。 ## 機能 * 高度なスクイーズ検出システム * プロフェッショナルなMT5実装 * 急激なブレイクアウト前にボラティリティスクイーズを検出 * 動的な色変化を伴うモメンタムヒストグラム * 市場状況を容易に把握できるスクイーズステータスドット * 以下の指標を組み合わせ: * ボリンジャーバンド * ケルトナーチャネル * 線
Rejection Zone Predictor PRO – MT5 Indicator Identify where price is most likely to react before it gets there. Rejection Zone Predictor PRO is a price-action based MetaTrader 5 indicator designed to automatically locate and rank potential BUY rejection/support zones below the current market price and SELL rejection/resistance zones above price . Instead of relying on a single support or resistance calculation, the indicator analyzes multiple forms of price-action confluence to determine which h
AURUM MID-QUANT PRO v5.60 Quantitative Excellence for Gold (XAU/USD) & Volatility Trading Gain a professional edge over institutional markets with AURUM MID-QUANT PRO , an advanced Price Action Pattern Detection and Breakout Engine designed exclusively for MetaTrader 5 . Built specifically to capture the unique volatility of Gold (XAU/USD) and other major financial instruments, this powerful indicator combines high-precision algorithmic pattern recognition with real-time dynamic accumulation z
A professional MT5 trading panel designed for decision support, risk management, and trade planning — not automated execution. Helps traders plan entries, manage positions, and control risk with clarity and consistency. Overview Real-time trading decision panel that analyzes trend, momentum, and market quality directly on the chart. It provides ATR-based TP/SL levels and clear buy/sell conditions to support faster and more consistent trading decisions. This is a decision support tool only —
Indicator Description Opportunity Identification Indicator — Smart Money This indicator was developed to assist in identifying moments when prices may be reaching areas of greater interest , seeking possible signals in market behavior associated with the concept of “smart money” (Smart Money) , widely discussed in financial literature and market studies. The proposal is to create a bridge between technical analysis and fundamental analysis . The indicator uses technical analysis and price behavi
Smart Money Structure & Precision Trading Indicator (MT5) Smart Money Structure & Precision Trading Indicator  is a powerful Smart Money Concepts (SMC) indicator for MetaTrader 5, designed to help traders identify high-probability entries with institutional logic . This indicator automatically detects market structure in real time , highlights key liquidity levels , and provides clear, non-repainting signals so you can trade with confidence and precision. Whether you are a scalper, day trader, o
STRBTV Pro MTF — Detailed Description STRBTV stands for "Sell The Rally, Buy The Valley" — an MT5 indicator (v2.10, by Marian Beceanu) built around multi-timeframe MACD convergence/divergence , with a "sniper entry" logic based on Support/Resistance and a built-in risk-management dashboard. General Concept The indicator works on two levels: Higher timeframe (HTF) — looks for convergence between price and MACD on the swing highs/lows of that timeframe. A confirmed HTF convergence is treated as t
Dynamic Trend Channel Ultimate for MT5 (M30) Professional Trend-Following & Smart Signal System Dynamic Trend Channel  is an advanced trend-following indicator designed specifically for the M30 timeframe on MetaTrader 5. It combines dynamic trend channels, adaptive volatility calculations, smart trend detection, trailing stop technology, and real-time signal generation to help traders identify high-probability market opportunities with greater confidence. Built around a dynamic EMA-based channel
Omega AI MT5
Irina Selivanevskaia
1 (4)
Omega AI Neural EA:LLMコンセンサスと対話型コンテキスト分析に基づくXAUUSD認知アルゴリズム・コンプレックス リアルタイム・トレード監視: システムの認知アルゴリズムの有効性は、実際のトレード口座で確認されています。Omega AI Neural EAの運用活動、現在の統計、およびエクイティの動向は、以下のリンクから独立して監査できます: https://www.mql5.com/ru/signals/2361385 価格動向と限定ライセンス: AIインフラストラクチャとの相互作用の安定性を維持するため、このプロジェクトは限定アクセス形式で実施されます。ライセンス費用は、販売されたコピー数に基づいて自動的に増加します: 最初 7 本: $249(特別早期アクセス) 次の段階: $349 中間段階: $699 最終価格: $1999 I. 認知分析および意思決定アーキテクチャ Omega AIは、独自の実行アルゴリズムとChatGPTニューラルネットワーク(v5.2)を搭載した分析コアを組み合わせたハイブリッドモデルに基づいています。 マルチモデルLLMコンセンサ
Liquidity Sweeps and Inverse FVGs RKADEV Transform your chart into a professional Smart Money Concepts (SMC) workspace. This is not just a standard indicator; it is a mechanical trading assistant designed to keep your execution structured, objective, and emotion-free. How to Use (Quick Start Guide): Step 1 (Setup): Attach the indicator and customize your Risk/Reward (RR) targets in the Inputs tab. Step 2 (Monitor): Keep an eye on the Dynamic Dashboard at the bottom-left corner. It tracks market
WaveBreaker Pro MT5 — The leader in market momentum analysis. WaveBreaker Pro is a comprehensive, high-tech trading indicator designed for precise market structure visualization. It helps identify potential reversal zones and capture strong price momentum. The core algorithm is built on a balanced combination of classic indicators and oscillators, heavily modified and thoroughly tested. The indicator effectively adapts to any trading style—from aggressive intraday scalping to conservative mediu
This indicator is based on a mathematical formula which gives you the possibility to seek and find the right frequency of the movement, and to determine its key level; just adjust the frequency parameter! Simple and highly effective; using this indicator you can easily predict the next support and  resistance    levels of the day. Also, this indicator determines the range and the next two importants levels of the movement outside this range so far. SGFL3 and RGFL3  are levels with high certainty
XAU MAJESTY ZONE ENGINEThe Ultimate 3-Zone Range AI with God-Tier Pullback Mastery Xau Majesty Zone Engine  is an exclusive God-Tier Expert Advisor crafted explicitly for GOLD (XAUUSD, XAUUSD.m, GOLD). Unlike chaotic multi-indicator EAs, Majesty Zone Engine operates on a pure, elegant, and highly effective 3-Zone Range Architecture- coupled with a single powerful EMA line to identify high-probability pullback and rebound entries. === WHY XAU MAJESTY ZONE ENGINE? === 1. ADVANCED 3-ZONE ARCHITEC
Sigma VWAP Bands Sigma VWAP Bands (Rolling) is a technical analysis indicator that plots upper and lower bands based on the statistical deviation of price from a rolling Volume-Weighted Average Price (VWAP). The indicator is designed to visualize price dispersion around VWAP using a user-defined lookback window and a configurable standard deviation multiplier. Parameters Lookback Period Number of bars used for VWAP and standard deviation calculations. Sigma Factor Multiplier applied to the cal
FVG - Fair Value Gap The FVG - Fair Value Gap is an advanced MQL5 indicator designed for traders who utilize institutional order flow and Smart Money Concepts to identify market inefficiencies. This indicator automatically detects and highlights Fair Value Gaps (FVGs) on your chart, providing a clear visual representation of potential support and resistance zones, reversal points, and high-probability trading setups. Key Features: Automated FVG Detection:   The indicator automatically identifie
TREND HARMONY MT5 – Multi Timeframe Trend and Phase and Pullback Level Visualizer indicator for Metatrader5 The TREND HARMONY indicator automates deep trend analysis and generates visualizations for you. Take control of your trades by eliminating uncertainty! Revolutionize your trading experience with precision and insight through the TREND HARMONY Multi Timeframe indicator – your ultimate MT5 trend visualization indicator. [  Features and Manual   | MT4 version |   All Products   ] Are you tir
ChanLun Ind - 缠论自动画线系统 交易辅助 • 精准绘制 • 结构清晰 产品简介 ChanLun Ind 是一款基于传奇交易理论“缠论”开发的 MT5 指标。它旨在帮助缠论学习者和交易者快速画出符合缠论形态的 上涨 、 下跌 和 中枢结构 。 本指标严格遵循缠中说禅《教你炒股票》108课中的数学定义,通过计算机算法自动、精确地处理 K 线包含关系,绘制出 “笔”与“中枢” 。无论您是缠论初学者,还是资深交易员,它都能让您从繁杂的画图中解放出来,专注于市场结构的分析与交易决策。 引言:什么是《缠论》(ChanLun)? 缠论 (缠中说禅技术分析理论)是一套系统性的技术分析方法。其核心目标只有一句话: “用严格的几何结构,描述价格运动的内在逻辑,从而实现可重复、可验证的交易决策。” 为快速上手该指标,您可以优先了解以下核心概念: 走势类型 :价格走势只表现为 上涨、下跌、盘整。 笔 (Bi/Pen) :由相邻顶分型与底分型连接而成的最小走势单位。 中枢 (Pivot/ZhongShu) :至少三段重叠的价格区间,代表市场的震荡核心(类似箱体)。 线段 (Segm
このプロダクトを購入した人は以下も購入しています
UZFX {SSS} スキャルピング・スマートシグナル v5.0 MT5は、変動の激しい市場において正確かつリアルタイムのシグナルを求めるスキャルパー、デイトレーダー、スイングトレーダー向けに設計された、リペイントのない高性能な取引インジケーターです。(UZFX-LABS)によって開発されたこのインジケーターは、価格行動分析、トレンド確認、スマートフィルタリングを組み合わせることで、すべての通貨ペアおよび時間枠において、高確率の売買シグナル、警告シグナル、トレンド継続の機会を生成します。 トレードの判断に迷うのはもうやめましょう。明確さ、正確さ、そして規律ある市場執行を求めるトレーダーのために設計された、体系的なシグナルシステムに従い始めましょう。 間違いなく、MQL5で入手可能な最高のインジケーターの一つです。絶対に見逃さないでください!!「スマートなトレーダーのためのスマートシグナル」 最新バージョン5.0がリリースされました。価格は予告なく最大499.99ドルまで値上がりする可能性がありますので、チャンスを逃さないようお早めにお求めください!! 購入を決める前に!無料トライアル
一言でいうと このインジケーターは RSI と MACD という2人の専門家を1つにまとめたもの です。2つのチャートを別々に見て判断する代わりに、両方が同意したときだけ「買い」または「売り」の矢印を表示します。 矢印は再描画されません 。一度出現すれば、そのまま固定されます。 「コンボ」の意味 通常、トレーダーは RSI(値動きの勢い)と MACD(トレンドの方向)を別々に見ます。しかし両者が矛盾することも多いです。 このインジケーターでは、 両方が同時に同意したときのみシグナル を出します。これにより、多くの偽シグナルが排除されます。 画面で見えるもの 価格チャートとは別のインジケーターウィンドウ 青と赤の矢印 —— そのまま使えるシグナル 拡大表示された MACD ヒストグラム(見やすく強調されている) RSI と MACD のラインも表示されるが、注目すべきは矢印 こんな人におすすめ 初心者 —— 2つのインジケーターを別々に解釈し、矛盾に対処する必要がない 経験者 —— シグナルの高速フィルタリングと、再描画しないクリアなロジック 迷いたくない人 —— 「買い」「売り」「待て
ARICoin is a powerful trading companion designed to generate high-probability entry signals with dynamic TP/SL/DP levels based on volatility. Built-in performance tracking shows win/loss stats, PP1/PP2 hits, and success rates all updated live. Key Features: Buy/Sell signals with adaptive volatility bands Real-time TP/SL/DP levels based on ATR Built-in MA Filter with optional ATR/StdDev volatility Performance stats panel (Success, Profit/Loss, PP1/PP2) Alerts via popup, sound, push, or email Cust
note: this indicator is for METATRADER4, if you want the version for METATRADER5 this is the link:  https://www.mql5.com/it/market/product/108106 TRENDMAESTRO ver 2.5 TRENDMAESTRO recognizes a new TREND from the start, he never makes mistakes. The certainty of identifying a new TREND is priceless. DESCRIPTION TRENDMAESTRO identifies a new TREND in the bud, this indicator examines the volatility, volumes and momentum to identify the moment in which there is an explosion of one or more of these da
MERAVITH SCANNERは、MetaTrader 5用のプロフェッショナルな金融市場インジケーターで、複数の分析ツールを一つの統合システムにまとめています。独自の出来高加重平均価格(VWAP)手法を使用してすべての計算を自動で行い、主観的な解釈を完全に排除します。 このインジケーターは、すべての資産クラス(FX、株式、指数、商品、暗号通貨)およびM1から月足までのすべての時間軸で動作します。基本原理は「価格は出来高に従う」というものです。MERAVITHは機関投資家の出来高が集中するポイントを特定し、その集中から数学的に正確な価格レベルを導き出します。予測や投機は行わず、計算のみを行います。 MERAVITH SCANNERを使用すると、28の主要FX通貨ペアをすべての時間軸でわずか2~3分でスキャンできます。また、任意の市場をスキャンすることも可能です。例えば、約100銘柄の株式を約10分でスキャンできます。 インジケーターは、消耗レベル、均衡線、偏差、統計レベル、およびターゲット予測を算出します。 チャート要素 Origin Point :すべての計算が始まる起点です。イン
このインジケーターは、市場で 関心が示されたゾーン をハイライトし、その後に 注文の蓄積ゾーン を表示します。 これは、大規模な**板情報(オーダーブック)**のように機能します。 これは、 巨大な資金 のためのインジケーターです。その性能は卓越しています。 市場にどんな関心が存在していても、 必ず目に見えるようになります 。 (これは 完全に再設計され、自動化されたバージョン です。もはや手動分析は必要ありません。) トランザクションスピード(取引速度) は新しい概念のインジケーターで、市場で大口注文が どこに・いつ 集中しているかを示し、それに基づいたチャンスを提供します。 トレンドの変化を 非常に早い段階 で察知することができます。 FXでは「出来高」と呼ばれているものは誤解されています。実際には、これは 時間あたりの価格変動量 です。したがって、正しい名称は トランザクションスピード です。 考え方・行動・分析の仕方すべてが問われます。 分析パラダイムの転換は非常に重要です。 このインジケーターは、FXにおける出来高の考え方を 根本から再定義 し、論理的な形で正確に活用する、
相場が本当は何をしているのかを見抜く。   3つの市場フェーズ(収縮・拡張・トレンド)を目の前でライブに捉え、トレンド・フェーズの初期段階でより優れたエントリーを取りましょう   。      当て推量はもう終わり。機関投資家やスマートマネーのように相場を読み始めましょう。   Apex Market Structure Pro(MT5版)は、ノイズを取り除き、あらゆるローソク足の下にある真の構造を見せる高精度のスマートマネー分析ツ   ールです。流動性、構造転換、蓄積ゾーン、トレンドバイアスを、ひとつのクリーンでプロフェッショナルなオーバーレイに集約します。遅行   指標に見切りをつけ、明晰さをもってトレードする準備のできた本気のトレーダーのために作られました。   重要:本インジケーターは Heikin Ashi(平均足)ローソク足での動作を前提に設計されています。使用前にチャートを Heikin Ashi   に設定し、その真価を解き放ってください。分析のすべては Heikin Ashi の価格の流れを軸に構築されています。Apex Market Structure Pr
Title:FX-AIEA Supply and Demand Zone Indicator (MT5) — Technical Overview Version: 2.51 | Platform: MetaTrader 5 Introduction Supply and demand zones are considered a core manifestation of institutional order flow, providing a more direct reflection of buying and selling pressure than traditional support/resistance levels. This indicator attempts to automate the identification of high-probability supply and demand zones using an adaptive ZigZag algorithm, reducing the subjectivity and time asso
MasterTrend Indicator for MT5 A powerful trend-following and signal-evaluation tool MasterTrend   is a custom MT5 indicator that combines Moving Averages and ATR-based risk/reward logic to generate clear buy/sell signals. It visualizes dynamic SL/TP levels, evaluates past trade outcomes, and displays win/loss statistics in a clean on-chart panel. Key features include: Buy/Sell signals based on MA crossovers ATR-based SL/TP1/TP2/TP3 levels with visual lines and labels Signal outcome tracking wit
SMC Sweep Fvg MT5 — スマートマネーと同じ目線で、チャート上に市場を映す こんな経験はありませんか。価格がストップを巻き取り、反転し、まさに想定どおりの方向へ進む。方向は正しかった。間違えたのはエントリーだけです。 このインジケーターは、そうした場面を減らすために作られています。分析で最も重い部分——チャートのマークアップ——を引き受け、本当に重要な「判断」をあなたに残します。 チャートに表示されるもの マーケットストラクチャー — 実際の構造的高値・安値に HH / HL / LH / LL ラベルとレベルライン。トレンドが一目で分かり、推測は不要です。 インバランスゾーン(FVG) — 価格が急ぎ過ぎて通過し、後で戻りやすい領域。未埋めと既埋めのゾーンは別色で表示されます。 流動性の動き — 反転前に市場がレベルを巻き取る瞬間を追跡します。 トレード設計の完成形 — エントリー矢印、ストップロス、利益目標。すべて描画済みで、頭の中で計算する必要はありません。 トレンドフィルター — 上位足のラインで、主戦場の動きの側に立ち続けられます。 インジケーターは
AriX
Temirlan Kdyrkhan
1 (4)
AriX Indicator for MT5 A powerful trend-following and signal-evaluation tool AriX is a custom MT5 indicator that combines Moving Averages and ATR-based risk/reward logic to generate clear buy/sell signals. It visualizes dynamic SL/TP levels, evaluates past trade outcomes, and displays win/loss statistics in a clean on-chart panel. Key features include: Buy/Sell signals based on MA crossovers ATR-based SL/TP1/TP2/TP3 levels with visual lines and labels Signal outcome tracking with real-time stat
VTrende Pro
Andrii Diachenko
5 (1)
VTrende Pro - MTF indicator for trend trading with a display panel for MT5 *** Videos can be translated into any language using subtitles (video language - Russian) Although the signals of the VTrende Pro indicator can be used as signals of a full-fledged trading system, it is recommended to use them in conjunction with the Bill Williams TS. VTrende Pro is an extended version of the VTrende indicator. Difference between Pro version and VTrende: - Time zones - Signal V - signal 1-2 waves -    S
マーケットメーカーのためのツール。 Meravith は次の機能を提供します: すべての時間足を分析し、現在有効なトレンドを表示します。 強気と弱気の出来高が等しくなる流動性ゾーン(出来高均衡)を強調表示します。 異なる時間足のすべての流動性レベルをチャート上に直接表示します。 テキスト形式の市場分析を生成し、参考情報として表示します。 現在のトレンドに基づいて目標値、サポートレベル、ストップロスを計算します。 取引のリスクリワード比を算出します。 口座残高に基づいてポジションサイズを計算し、潜在的な利益を推定します。 また、市場に大きな変化があった場合には警告を表示します。 インジケーターの主要ライン: 強気/弱気の出来高エグゾーストライン ― 目標値として機能します。 市場のトレンドを示すライン。市場が強気か弱気かによって色が変わり、トレンドのサポートとして機能します。主にその色が市場センチメントを示します。 出来高均衡ライン(Eq)。Eq(Volume Equilibrium)ラインはシステムの中核です。これは買い手と売り手の出来高のバランスポイントを表します。市場の流動性を示し
ScalpPoint is a powerful trading companion designed to generate high-probability entry signals with dynamic TP/SL/DP levels based on volatility. Built-in performance tracking shows win/loss stats, PP1/PP2 hits, and success rates — all updated live. Key Features: Buy/Sell signals with adaptive volatility bands Real-time TP/SL/DP levels based on ATR Built-in MA Filter with optional ATR/StdDev volatility Performance stats panel (Success, Profit/Loss, PP1/PP2) Alerts via popup, sound, push, or emai
ZIVA Signal Intelligence
Hassan Abdullah Hassan Al Balushi
ZIVA Signal Intelligence An Adaptive, Modular Market Intelligence System ZIVA Signal Intelligence is not positioned as a conventional trading indicator. It is a fully integrated, proprietary market intelligence system engineered to deliver structured, high-precision interpretation of price behavior within a controlled analytical environment. Developed through an independent architectural approach, ZIVA does not rely on, derive from, or replicate existing indicators. It represents a standalone
OmniSync Projection
Antonio-alin Teculescu
5 (1)
Chronos Fractal Engine is an innovative price projection indicator for MetaTrader 5, designed to transform your technical analysis by intelligently identifying and projecting historical price patterns. Built upon an advanced correlation algorithm and the fractal principles of the market, this powerful tool visualizes potential future price movements, giving you a unique edge in your trading decisions. What is Chronos Fractal Engine? At its core, the Chronos Fractal Engine employs a sophisticat
SMC Institutional Suite v3.7 Professional Smart Money Concept Indicator for MetaTrader 5 What is New in Version 3.7 - Visual Stability Update This release focuses entirely on one goal: making every zone, label, and line on your chart rock-solid stable. There is no more flickering, no more zones disappearing on a new candle, and no more duplicate drawings. Order Block (OB) zones no longer flicker or disappear. Once drawn, they stay permanently on the chart. Equal Highs and Equal Lows (EQH / EQL)
PrimeScalping is a powerful trading companion designed to generate high-probability entry signals with dynamic TP/SL/DP levels based on volatility. Built-in performance tracking shows win/loss stats, PP1/PP2 hits, and success rates — all updated live. Key Features: Buy/Sell signals with adaptive volatility bands Real-time TP/SL/DP levels based on ATR Built-in MA Filter with optional ATR/StdDev volatility Performance stats panel (Success, Profit/Loss, PP1/PP2) Alerts via popup, sound, push, or e
Binary Compound Indicator V3 Binary Compound Indicator V3 is a technical analysis indicator for MetaTrader 5 designed to help traders identify potential market opportunities using multiple confirmation filters and structured risk management concepts. The indicator combines trend analysis, momentum confirmation, and market condition filtering to provide visual trading signals directly on the chart. Main Features Triple-confirmation signal system EMA trend filtering RSI momentum analysis Stochast
Triple Crox Strategy v4.10 Triple Crox Strategy v4.10 Professional MetaTrader 5 Indicator 13 Patterns • Fibonacci • CLUSTER ML • Multi-Filter 1. Overview Advanced MT5 indicator combining 13 Pattern Detection , Fibonacci Analysis , CLUSTER Machine Learning and Multi-Filter system for precise signals on Forex, indices, commodities, crypto. 5-step pipeline: indicators → filter → patterns → signals → levels. 2. Trading Setup Heikin-Ashi colored bars. Buy/Sell arrows with Entry, TP1(1x ATR), TP2(2x
TraderHUD
Justino Porto Neto
5 (1)
TraderHUD v2 — プロトレーダーのための完全ダッシュボード TraderHUD v2 は、MetaTrader 5向けの最も包括的なビジュアルインジケーターの進化版です。トレーダーがより的確な判断を下すためにチャート上で確認すべきすべての情報を一つのツールに統合します:時間的コンテキスト、ドルの強さ、統計的レンジ、ピボットレベル、値動きの速度、マクロトレンド——すべてが統合され、設定可能で、チャートを煩雑にしません。 このバージョンは実際のライブトレードでの使用経験に基づいて構築されており、明確な哲学に従っています: より多くのコンテキスト、より少ないノイズ 。 v2の新機能 8つのモジュールを単一のインジケーターに完全統合 DayRangeとDollarFlowが連動する設定可能なサイドパネル 正時表示と連動した市場セッションのマーキング レベル間の平均線オプション付きクラシックピボットポイント ベータ版としてマークされた2つの実験的モジュール:ボラティリティとマクロトレンド平均線 完全に設定可能なレイアウト——コーナー、幅、色、フォント モジュール タイマーとスプレ
The Expert Advisor and the video are attached in the Discussion tab . The robot applies only one order and strictly follows the signals to evaluate the indicator efficiency. Pan PrizMA CD Phase is an option based on the Pan PrizMA indicator. Details (in Russian). Averaging by a quadric-quartic polynomial increases the smoothness of lines, adds momentum and rhythm. Extrapolation by the sinusoid function near a constant allows adjusting the delay or lead of signals. The value of the phase - wave s
Классификатор силы тренда. Показания на истории не меняет. Изменяется классификация только незакрытого бара. По идее подобен полной системе ASCTrend, сигнальный модуль которой, точнее его аппроксимация в несколько "урезанном" виде, есть в свободном доступе, а также в терминале как сигнальный индикатор SilverTrend . Точной копией системы ASCTrend не является. Работает на всех инструментах и всех временных диапазонах. Индикатор использует несколько некоррелируемых между собой алгоритмов для класси
FFx Universal Strength Meter PRO is more than a basic strength meter. Instead of limiting the calculation to price, it can be based on any of the 19 integrated strength modes + 9 timeframes. With the FFx USM, you are able to define any period for any combination of timeframes. For example, you can set the dashboard for the last 10 candles for M15-H1-H4… Full flexibility! Very easy to interpret... It gives a great idea about which currency is weak and which is strong, so you can find the best pai
The FFx Universal MTF alerter shows on a single chart all the timeframes (M1 to Monthly) with their own status for the chosen indicator. 9 indicators mode (MACD-RSI-Stochastic-MA-ADX-Ichimoku-Candles-CCI-PSAR). Each can be applied multiple times on the same chart with different settings. Very easy to interpret. Confirm your BUY entries when most of the timeframes are showing green color. And confirm your SELL entries when most of the timeframes are showing red color. 2 Alert Options : input to s
The FFx Watcher PRO is a dashboard displaying on a single chart the current direction of up to 15 standard indicators and up to 21 timeframes. It has 2 different modes: Watcher mode: Multi Indicators User is able to select up to 15 indicators to be displayed User is able to select up to 21 timeframes to be displayed Watcher mode: Multi Pairs User is able to select any number of pairs/symbols User is able to select up to 21 timeframes to be displayed This mode uses one of the standard indicators
FFx Patterns Alerter gives trade suggestions with Entry, Target 1, Target 2 and StopLoss .... for any of the selected patterns (PinBar, Engulfing, InsideBar, OutsideBar) Below are the different options available: Multiple instances can be applied on the same chart to monitor different patterns Entry suggestion - pips to be added over the break for the entry 3 different options to calculate the SL - by pips, by ATR multiplier or at the pattern High/Low 3 different options to calculate the 2 TPs -
MetaTrader 4 version available here : https://www.mql5.com/en/market/product/24881 FFx Basket Scanner is a global tool scanning all pairs and all timeframes over up to five indicators among the 16 available. You will clearly see which currencies to avoid trading and which ones to focus on. Once a currency goes into an extreme zone (e.g. 20/80%), you can trade the whole basket with great confidence. Another way to use it is to look at two currencies (weak vs strong) to find the best single pairs
MetaTrader 4 version available here: https://www.mql5.com/en/market/product/25793 FFx Pivot SR Suite PRO is a complete suite for support and resistance levels. Support and Resistance are the most used levels in all kinds of trading. Can be used to find reversal trend, to set targets and stop, etc. The indicator is fully flexible directly from the chart 4 periods to choose for the calculation: 4Hours, Daily, Weekly and Monthly 4 formulas to choose for the calculation: Classic, Camarilla, Fibonac
プレミアムレベルは、正しい予測の精度が80%を超える独自の指標です。 この指標は、最高のトレーディングスペシャリストによって2か月以上テストされています。 あなたが他のどこにも見つけられない作者の指標! スクリーンショットから、このツールの正確さを自分で確認できます。 1は、1キャンドルの有効期限を持つバイナリーオプションの取引に最適です。 2はすべての通貨ペア、株式、商品、暗号通貨で機能します 手順: 赤い矢印が表示されたらすぐにダウントレードを開き、青い矢印が表示されたら閉じます。青い矢印の後に開くこともできます。 試してテストしてください!推奨設定はデフォルトです! 日足チャートで最高の精度を示します! インディケータは、2600 Pipsの収益性に対して、約10Pipsという非常に小さなマージンを使用します。
作者のその他のプロダクト
A quick note: The indicator here is a free version of the paid indicator version  ( Multiple Timeframe Filtered Moving Average Crossover Indicator ). On this free version, the user is restricted to only a preset library of EMAs, WMAs, and SMAs (periods 1–200) . If you want full control over each moving average — custom Period, Shift, and any combination of Method and Applied Price — then you would have to go for the  paid indicator version that removes the preset library and gives you freedom to
FREE
NOTE: The EA is designed to trade the same signal engine as the companion indicator. If you want to see signals on a chart before committing capital, purchase and configure the indicator first( Multiple Timeframe Filtered Moving Average Crossover Indicator ), or try the free version of the indicator as well ( Multiple Timeframe Filtered Moving Average Crossover Signals ) verify it fires the way you expect on the symbols and timeframes you trade, then replicate those settings in the EA. The two a
フィルタ:
レビューなし
レビューに返信