LiveDealMap

Profit/Loss Visual Indicator – MetaTrader 5

Turn your chart into a real-time trade dashboard!

This exclusive MT5 indicator allows you to instantly see the performance of your open positions without opening multiple windows or manually calculating profits and losses. Perfect for traders who want full control and a quick visual overview of their results.

How It Works

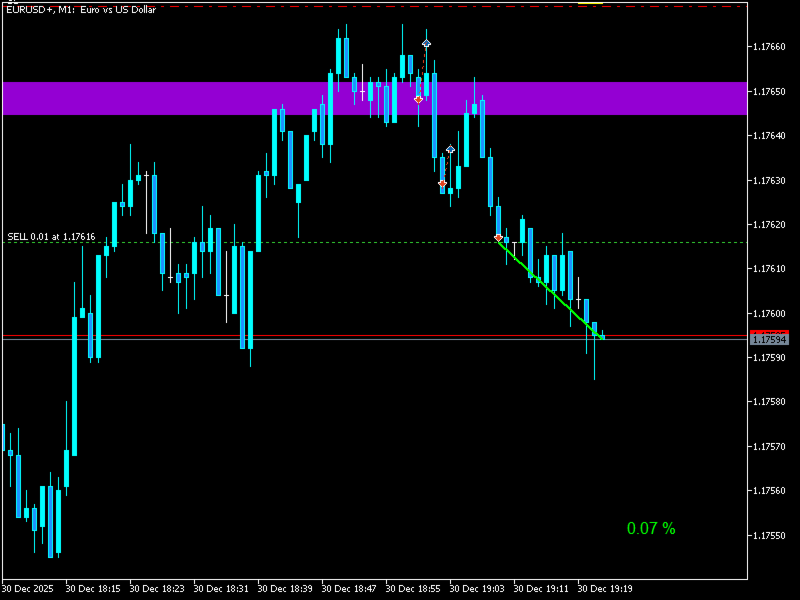
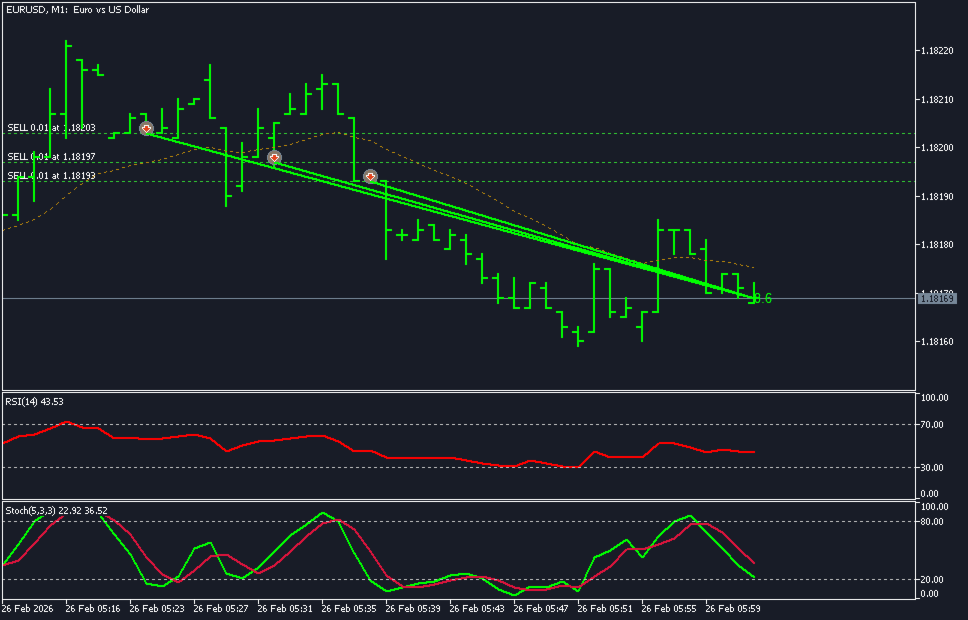
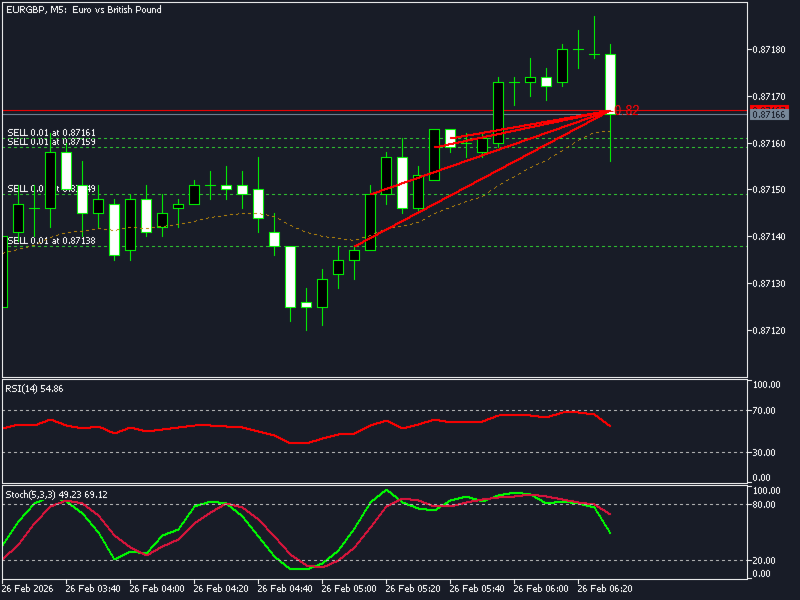
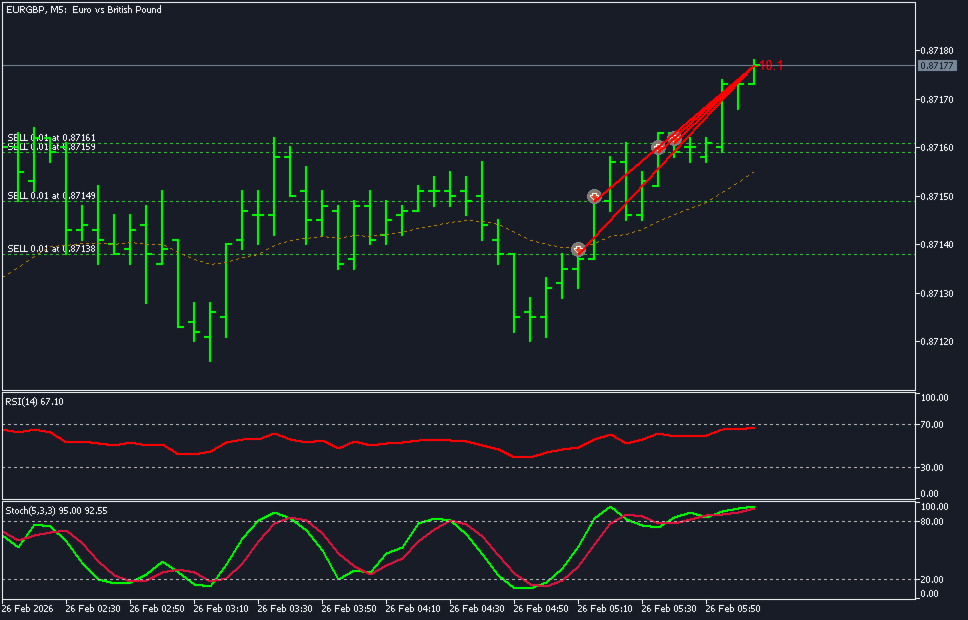
  • Every open position is automatically highlighted on the chart with a trend line connecting the entry price to the current price.

  • Smart colors:

    • Green for profitable trades

    • Red for losing trades

  • Displays the profit or loss percentage relative to your account balance, updated in real time in the corner of the chart.

  • Fully customizable: change line colors, styles, thickness, and the position of the text on the chart.

Ideal For

  • Active traders managing multiple positions at once.

  • Anyone who wants visual control over account risk and profit.

  • Traders who value organization and convenience on their charts.


おすすめのプロダクト
Hello, This is an easy symbol change panel. This is a full version of Symbol1 2Changer Symbols must be active on your Market Watch list. Parameters: SymbolList - you can add more symbols with a comma(,) ratio - change the size LineNumber - you can set that how many symbols are displayed per line. button_width - modify the button size button_height - modify the button size Thank you.
Account Statistics – MetaTrader 5のためのトレーディング統計ダッシュボード Account StatisticsはMetaTrader 5向けの分析およびレポートツールです。取引口座の主要な指標をチャート上に直接表示し、さまざまな期間にわたるパフォーマンスを体系的に評価することができます。 本製品は、結果を体系的に分析し、明確に記録したいトレーダー向けに設計されています。 期間限定オファー: 最初の30本はわずか30ドル!価格はまもなく49ドルに上がります。 機能 統合されたダッシュボードは、主要な取引指標をリアルタイムで表示します。これには損益、勝率、プロフィットファクター、その他の統計データが含まれます。表示は日次、週次、月次、年次、および全期間の統計など、さまざまな期間に切り替えることが可能です。 さらに、このツールは自動レポート機能を備えています。レポートは指定した時刻に作成され、プラットフォームの通知機能を通じて送信されます。日次レポートと定期的なサマリーを組み合わせることも可能です。 プログラムは週次、月次、年次の切り替えなどの重要な期間を自
You can change the time period of the chart at the touch of a button. You can also change multiple charts at the touch of a button. You can also change multiple charts at the touch of a button,   saving you the trouble of changing time periods. We are live-streaming the actual operation of the system. Please check for yourself if it is usable. Please check it out for yourself. https://www.youtube.com/@ganesha_forex We do not guarantee your investment results. Investments should be made at you
LC Trading Sessions
Lucas Albuquerque De Carvalho
LC Trading Sessions is a precision indicator designed to map liquidity windows across major global sessions ( New York, London, and Tokyo ). It is the perfect tool for Day Traders and Scalpers who need to visualize market opens and closes while maintaining a clutter-free chart. What does the indicator do? Automatic Mapping: Plots vertical lines with clear labels identifying the start and end of each session. Future Projection: Displays upcoming session opens, allowing you to plan your trading da
FREE
EPo-CreW Forex Super ORB-H4 インジケーターへようこそ! 本ガイドでは、市場の最初の4時間のオープニングレンジに基づいて、高確率のトレード機会を特定するためのこの強力なツールの使い方を解説します。 初心者の方から経験豊富なトレーダーまで、このシステムはより高い自信と一貫性を持って取引する手助けとなります。 これはデモ製品です。インストール日から30日後に有効期限が切れます。フルバージョンはこちら: https://www.mql5.com/en/market/product/160926?source=Site OR https://t.me/Fundamental_fx 取引:すべての通貨、金(GOLD)とBTCUSD NB: M5 タイムフレームに切り替えることを確認してください。このインジケーターを使うのに最適なタイムフレームです。 トレーディング戦略 戦略1:ブレイクアウト & リトレースメント(メイン) SELL(売り)セットアップ: 価格が青いラインを上にブレイクする(高値ブレイク) ゴールドの BREAKOUT 矢印が表示される 価格が再び青い
FREE
Main purpose:   "Pin Bars"   is designed to automatically detect pin bars on financial market charts. A pin bar is a candle with a characteristic body and a long tail, which can signal a trend reversal or correction. How it works:   The indicator analyzes each candle on the chart, determining the size of the body, tail and nose of the candle. When a pin bar corresponding to predefined parameters is detected, the indicator marks it on the chart with an up or down arrow, depending on the directi
FREE
Multi Currency Strength Dashboard Mini(無料)– MetaTrader 5 用 通貨強弱メーター Multi Currency Strength Dashboard Mini は MetaTrader 5 向けの無料インジケーターで、 8つの主要通貨 (USD / EUR / GBP / JPY / CHF / CAD / AUD / NZD)の相対的な強弱を、見やすいダッシュボードでリアルタイム表示します。 目的:強い通貨・弱い通貨を数秒で把握し、ウォッチリスト作成や「 強い通貨 vs 弱い通貨 」の組み合わせ選定を効率化します。 主な機能(Mini 無料版) 8主要通貨 の強弱を1つのパネルに表示。 強弱バー +パーセンテージの視覚的ダッシュボード。 自動リアルタイム更新(軽量更新)。 全タイムフレーム対応 (計算は選択した時間足で実行)。 多くのブローカーに対応(一般的なシンボルのサフィックスを考慮)。 仕組み Market Watch に表示されている主要FXペアの価格変化をもとに通貨ごとの強弱を算出し、0〜100に正規化してランキング形式
FREE
RCH FX Spread + Bar Close Countdown Indicator What This Indicator Does A simple, professional tool that displays real-time spread information and bar closing countdown directly on your MT5 charts. Key Features • Real-time spread display - Shows current spread in pips or points • Bar close countdown timer - Exact seconds remaining until current bar closes • Customizable alerts - Audio notification before bar closes • Fully adjustable display - Position, colors, fonts, and sizing options • Works o
FREE
This tool allows you to export Ticks for any financial instrument available in MetaTrader 5. You can download multiple symbols into the same CSV file. You can also schedule the download frequency (every 5 minutes, 60 minutes, etc.). There is no need to open multiple charts to get the latest data—the tool downloads the data directly. The CSV file will be stored in the following folder: \MQL5\Files . How it works Select the symbols to download: Click an item to select or deselect it. Enter the CSV
この情報インジケーターは、アカウントの現在の状況を常に把握したい人にとって役立ちます。 VERSION MT 4 -   More useful indicators このインジケーターには、ポイント、パーセンテージ、通貨での利益、現在のペアのスプレッド、現在の時間枠でバーが閉じるまでの時間などのデータが表示されます。 チャート上に情報線を配置するには、いくつかのオプションがあります。 価格の右側 (価格の後ろにあります)。 コメントとして (グラフの左上隅に); 画面の選択した隅。 情報区切り記号を選択することもできます。 | / \ # このインジケーターは使いやすく、非常に有益です。設定で不要な情報項目を無効にすることも可能です。 設定 外観の種類     - 情報行の表示タイプ。次の 3 つのオプションがあります。 価格に従ってください     - 価格に従う。 コメントとして     - コメントとして; 画面の選択した隅に     - 画面の選択した隅にあります。 添付用グラフコーナー     - 表示タイプを選択した場合 画面の選択されたコーナーでは、この項目を使用して
FREE
This spread indicator displays the actual spread of each candle. It highlights the maximum spread and the minimum spread of the chosen symbol. This indicator is very helpful to see in real time the spread evolution helping to avoid taking a trade when the spread is too high. Inputs: Print value in Points: if true displays the spread as a whole number D isplay minimum and maximum spread of the past N days: select the number of days to consider the maximum and minimum spread Automatically adj
FREE
Trading Room Indicator is a professional market-structure tool built to give traders a clear, complete trading framework — combining CPR levels, dynamic targets, and trend direction in one clean view. Instead of guessing direction or overloading the chart with indicators, Trading Room Indicator focuses on what actually matters : levels, direction, and potential price expansion. What This Indicator Provides CPR Structure BUY level SELL level Pivot Point (PP) Designed to highlight equilibrium
Unoptimized and Designed for You to Customize The Mercury Track Indicator is a powerful trading tool created with flexibility in mind, allowing you to tailor it to your trading strategies and market conditions. Out of the box, it provides insightful signals, but it’s meant for traders to optimize and enhance according to their unique preferences and trading styles. Logic Behind the Strategy At its core, the Mercury Track Indicator employs a combination of signal generation and dynamic band plot
Candle Timer and Spread and Session  in a smart way displays the remaining time before the current bar closes and a new bar forms and also the Current Session in place. It can be used for time management and at the same time you keep an eye on Spread changes and Session Change. Real-Time Edge in Your Trading: Candle Timer & Spread Overlay – FREE for a Limited Time! Smart Display of  Candle Timer and Spread and Session in a single place Lightning-Fast Candle Countdown Timer Instant Spread Monito
FREE
Candle Perspective Structure Indicator MT5 is a simple indicator that defines and displays the candlestick structure of the market. This indicator will suit both experienced traders and beginners who find it difficult to follow the structure visually. If you want to see more high-quality products or order the development/conversion of your own products, visit my partners' website: 4xDev Get 10% OFF on manual strategies automation services or indicator development/conversion services at 4xDev
FREE
TradeInfo MT5
Manuraj Dhanda
4.36 (14)
TradeInfo is a utility indicator which displays the most important information of the current account and position. Displayed information: Information about the current account (Balance, Equity, Free Margin). Current spread, current drawdown (DD), planned profit, expected losses, etc. Number of open position(s), volume (LOT), profit. Today’s and yesterday’s range. Remaining time to the next candle. Last day profit information. MagicNumber filter. Comment filter. Indicator parameters: ShowPro
FREE
DC Indicator
Lamont Simone Reynecke
The donchian channel indicator might just be the best fit for you Trading in derivative products such as futures, options, CFD's, forex and certificates contains significant risk. These products are not suitable for every investor. Investors could potentially lose all or more than the original investment. If anything, only money equal to personal risk capital should be used and can be lost without jeopardizing financial security or lifestyle. Partially or fully automated trading programs can
FREE
Basic Renko MT5
Mehran Sepah Mansoor
4.63 (8)
基本的なRenkoインディケータは、明確で簡潔な相場観を求めるトレーダーにとって強力なツールです。当社のインディケータは、トレンドの視覚化を簡素化するだけでなく、反転の正確なアラートを提供し、あなたの取引に戦略的な優位性を提供します /  MT4無料版 特徴 フルカスタマイズ可能:   高度なカスタマイズオプションにより、インジケーターをお好みに合わせてカスタマイズできます。色からボックスサイズ設定まで、チャート上の情報表示方法を完全にコントロールできます。 反転アラート:   反転アラートで、市場の方向性が変化する可能性をいち早く知ることができます。これにより、利益を最大化し、損失を最小化するために、情報に基づいたタイムリーな意思決定を行うことができます。 入力項目 Size of the boxes:   ボックスサイズ(ポイントベース) Bullish box colour:   強気ボックスの色 Bearish box colour:   弱気ボックスの色 Box opacity:   不透明度(0から100の間)。不透明度が低くなるにつれて透明度が高くなる Text
FREE
Crypto_Forex MT5用インジケーター「 MFI Speed 」(リペイント機能なし) - このインジケーターの計算は物理学の方程式に基づいています。MFI SpeedはMFI自体の1階微分です。 - Money_Flow_Index (MFI)は、価格と出来高データを用いて売られ過ぎと買われ過ぎのゾーンを特定するテクニカルオシレーターです。 - MFI Speedは、主要トレンドの方向へのモメンタムエントリーをスキャルピングするのに適しています。 - 適切なトレンドインジケーター(例えば、標準EMA(画像参照)など)と組み合わせて使用​​してください。 - MFI Speedインジケーターは、MFI自体がどれだけ速く方向転換するかを示します。非常に敏感です。 - MFI Speedインジケーターの値が0未満の場合、速度は負です。値が0より大きい場合、速度は正です。 - インジケーターにはモバイルとPCのアラートが組み込まれています。 高品質のトレーディングロボットとインジケーターをご覧になるにはここをクリックしてください! これは、このMQL5ウェブサイトでのみ提供さ
この小さなツールを使用すると、時間カウンターを分単位で定義できます あなたが設定した分数に応じてポジションをクローズするため。 たとえば、30分に設定した場合、ツールはオープンから30分後に各オープンポジションを閉じます。 設定 アクティブ:ツールをアクティブにして、定義された分数後にポジションを閉じるために使用します。 管理:ツールで管理されるシンボルで選択します。 アカウントのすべてのオープンポジションにシステムを適用する場合は、[ALL CURENCY]を選択します 「この通貨のみ」を選択すると、現在の通貨のみで一時的にポジションがクローズされます。 MINUTE DURATION TRADES:取引期間の分数を選択します。 タイムゾーン: タイムゾーンを定義します。 もしあなたが
FREE
Correlation Matrix Pro - マルチ通貨ヘッジスキャナー 通貨ペア間の相関関係をリアルタイムで把握! 最大6つの通貨ペア間の統計的関係を同時に可視化する強力な分析ツールです。ポートフォリオ管理、リスク分散、ヘッジ戦略に最適です。 主な機能 - 対数リターンを使用したリアルタイムピアソン相関 - 最大6通貨ペアを同時監視 - 自動タイムフレーム検出 - 調整可能な遡及期間(5-200本) - ヘッジ機会の自動検出 - ミニマルで折りたたみ可能なパネルデザイン - 即座に解釈できるカラーコード付きマトリックス カラーコード 緑 (+0.70 〜 +1.00) = 強い正の相関 薄緑 (+0.50 〜 +0.69) = 中程度の正の相関 グレー (-0.49 〜 +0.49) = 弱い/相関なし オレンジ (-0.50 〜 -0.69) = 中程度の負の相関 赤 (-0.70 〜 -1.00) = 強い負の相関(ヘッジ) なぜ相関分析が重要? リスク管理 高相関ポジションによるリスクの二重化を回避。 ヘッジ戦略 効果的なヘッジのため、強い負の相関を持つペアを自動検出。
FREE
The Gold Breakout EA- Your Key to Conquering Prop Firm Challenges! ** Important Notice:** This Discord server is for   support and questions only . Sales are processed   exclusively via the MQL5 Market . No direct sales, payments, or file exchanges will take place here. Please visit the official MQL5 link for any purchases. Thank you for your understanding! DM for: (Join us for crucial news updates, setup guides, and community help. Please note: Our Discord is a 100% sales-free zone! We solely
Bohemia Gold MT5
Vladislav Taska
4.75 (4)
Bohemia Gold MT5 is  Trend & Volatility EA trading system designed specifically for Gold (XAUUSD) . It combines higher-timeframe trend filtering , trend detection , volatility-based SL management , and advanced trade management to adapt market conditions. It uses style logic focused on trend strength, volatility, and capital protection. NOTE:   Based on backtests, I found better trading results with the following setup: D1/H4/H2 (Trend/ADX/ATR & trade). The SET file can be downloaded here … bohe
FREE
Market Hours Pro shows Tokyo, London, and New York trading sessions directly on your MT5 chart, including scheduled overlap periods. It’s designed to give you a clear view of global market timing so you can plan trades, spot high-activity periods, and align strategies with standard Forex hours. How It Works Displays scheduled session times visually on your chart. Highlights session overlaps for London/New York and Tokyo/London. Automatically adjusts times for your timezone or broker time. Shows
FREE
THE DAILY DECIDER BUYSELL PRO INDICATOR OVERVIEW Unlock the Market's Daily Secret: The Daily Decider BuySell Indicator is Here! Tired of analysis paralysis? Struggling with false signals and noisy markets? What if you could know the market's primary intention within the first few hours of the day and trade with unwavering confidence? Introducing the Daily Decider BuySell Indicator for MetaTrader 5. Pro Tip: Never Miss the first signal of the day This isn't just another indicator cluttering yo
Trend Indicator Pro Use any currency and any time period you want For greater profitability use a risk return of at least 1:3 or 1:4 Entry Signal : Appears after the moving average crossover closes ️️ Histogram Flip : Signals important trend changes ️ Easy to use : Perfect for those who want fast, confident decisions! Boost your accuracy : Find the best market entry moments with more confidence! Get straight to the point and seize the best trend opportunities!
ZumikoFX Trading Stats - Professional Account Dashboard Overview ZumikoFX Trading Stats is a comprehensive, real-time account monitoring dashboard designed for serious traders who need complete visibility of their trading performance. This indicator displays all crucial trading statistics in an elegant, easy-to-read panel positioned in the top-right corner of your chart. Key Features Complete Account Monitoring Balance & Equity - Real-time account status with current balance and equity includ
FREE
Advanced Session Boxes with World Clock This indicator provides a comprehensive solution for visualizing the major forex trading sessions directly on your chart. It is designed to help traders identify the market's most active periods by highlighting the price action during the Sydney, Tokyo, London, and New York sessions. In addition to session boxes, the indicator includes a sleek, on-screen dashboard that acts as a world clock and session status panel, ensuring you're always in sync with glob
# ** Malaysian SnR Enhanced – Multi-Timeframe Support & Resistance Indicator ** Are you tired of guessing where the key support and resistance levels are on your chart? Say hello to **Malaysian SnR Enhanced**, the ultimate **multi-timeframe Support & Resistance indicator** designed for serious traders who want a clear, top-down view of critical price levels across **W1, D1, H4, H1, M30, and M15 timeframes**. ## What is Malaysian SnR Enhanced? **Malaysian SnR Enhanced** is a powerful,
このプロダクトを購入した人は以下も購入しています
SuperScalp Pro
Van Minh Nguyen
4.53 (19)
SuperScalp Pro — 高度なマルチフィルター対応スキャルピングインジケーターシステム SuperScalp Pro は、クラシックな Supertrend と複数のインテリジェントな確認フィルターを組み合わせた高度なスキャルピング用インジケーターシステムです。M1〜H4 のすべての時間足で効率的に機能し、特に XAUUSD、BTCUSD、および主要なFX通貨ペアに適しています。単体のシステムとして、また既存の取引戦略へ柔軟に統合して使用できます。 本インジケーターは 11 以上のフィルターを統合しており、短期・長期の EMA、トレンド判定に用いる 3 本の EMA、EMA スロープ(EMA slope)、RSI、ADX、出来高、VWAP、ボリンジャーバンドのブレイクアウト、MACD ダイバージェンスフィルターなどを含みます。スマートキャンドルフィルターはローソク足の終値を確認して弱いシグナルを排除し、3 本の EMA と MACD ダイバージェンスを組み合わせたトレンド認識メカニズムにより勝率の高いシグナルの選別を支援します。 SuperScalp Pro は ATR に基
Entry In The Zone and SMC Multi Timeframe is a real-time 2-in-1 market analysis tool that combines market structure analysis and a No Repaint BUY / SELL signal system into a single indicator, built on Smart Money Concepts (SMC) — a widely adopted framework used by professional traders to understand market structure. This indicator helps you see the market more clearly, make decisions based on structure rather than guesswork, and focus on high-probability zones where price is more likely to react
Azimuth Pro
Ottaviano De Cicco
5 (6)
Azimuth Pro V2:MT5向けシンセティック・フラクタル構造分析と確認済みエントリー 概要 Azimuth Pro は Merkava Labs によるマルチレベルスイング構造インジケーターです。4つのネストされたスイングレイヤー、スイングアンカーVWAP、ABCパターン検出、3タイムフレーム構造フィルタリング、そして確定バーでの確認済みエントリー — 1つのチャートで、ミクロスイングからマクロサイクルまでを網羅するワークフロー。 これはブラインドシグナル製品ではありません。ロケーション、コンテキスト、タイミングを重視するトレーダーのための構造ファーストワークフローです。 V2発売記念オファー — Azimuth Pro V2をUSD 399で(次の100本)。最終価格:USD 499。 1. V2での変更点 シンセティック・マルチタイムフレームエンジン 上位タイムフレーム分析をMeridian Proと同じ独自のシンセティックアーキテクチャで一から再構築。よりクリーンなHTFコンテキスト、安定したライブ動作、従来のMTF同期問題なし。シンセティックエンジンは 固定比率タ
Power Candles – あらゆる市場に対応した強度ベースのエントリーシグナル Power Candles は、Stein Investments が長年培ってきた強度分析を価格チャート上に直接反映します。価格だけに反応するのではなく、各ローソク足は実際の市場の強さに基づいて色分けされ、モメンタムの蓄積、強度の加速、明確なトレンド転換を瞬時に把握できます。 すべての市場に共通する単一ロジック Power Candles は すべての取引シンボル で自動的に動作します。現在のシンボルが Forex か非 Forex 市場かを自動判別し、内部で適切な強度モデルを適用します。 Forex および Gold :FX Power のデルタ値を使用(絶対値レンジ最大 100) 指数、暗号資産、CFD :IX Power の強度値を使用(絶対値レンジ最大 50) 必要な強度計算は Power Candles に直接組み込まれています。ローソク足のカラーリングやシグナルロジックに、追加のインジケーターは不要です。 価格ノイズではなく「強度状態」 各ローソク足は、以下の 9 つの明確に定義された強
このインジケーターを購入された方には、以下の特典を 無料 で提供しています: 各トレードを自動で管理し、ストップロスとテイクプロフィットを設定し、戦略ルールに基づいてポジションを決済する補助ツール 「Bomber Utility」 様々な銘柄に合わせたインジケーターの設定ファイル(セットファイル) 「最小リスク」、「バランスリスク」、「待機戦略」 の3つのモードで使用できる Bomber Utility 用の設定ファイル このトレーディング戦略をすぐに導入・設定・開始できる ステップバイステップのビデオマニュアル ご注意: 上記の特典を受け取るには、MQL5のプライベートメッセージシステムを通じて販売者にご連絡ください。 オリジナルのカスタムインジケーター 「Divergence Bomber(ダイバージェンス・ボンバー)」 をご紹介します。これは、MACDのダイバージェンス(乖離)戦略に基づいた 「オールインワン」型のトレーディングシステム です。 このテクニカルインジケーターの主な目的は、価格とMACDインジケーターの間に発生するダイバージェンスを検出 し、将来の価格の動きを示す
OmniSync Projection
Antonio-alin Teculescu
5 (1)
Chronos Fractal Engine is an innovative price projection indicator for MetaTrader 5, designed to transform your technical analysis by intelligently identifying and projecting historical price patterns. Built upon an advanced correlation algorithm and the fractal principles of the market, this powerful tool visualizes potential future price movements, giving you a unique edge in your trading decisions. What is Chronos Fractal Engine? At its core, the Chronos Fractal Engine employs a sophisticat
このインジケーターを購入すると、プロ仕様のトレードマネージャーを無料で差し上げます。 まず第一に、このトレーディングシステムがノンリペイント、ノンリドロー、ノンラグのインジケーターであることを強調する価値がある。これにより、手動取引とロボット取引の両方に理想的なものになっています。 オンラインコース、マニュアル、プリセットのダウンロード。 「スマートトレンドトレーディングシステム MT5」は、新規および経験豊富なトレーダー向けにカスタマイズされた包括的なトレーディングソリューションです。10以上のプレミアムインジケーターを組み合わせ、7つ以上の堅実なトレーディング戦略を備えており、多様な市場状況に対応する多目的な選択肢となっています。 トレンドフォロー戦略:トレンドを効果的に乗り越えるための正確なエントリーとストップロス管理を提供します。 リバーサル戦略:潜在的なトレンドの反転を特定し、トレーダーがレンジ相場を活用できるようにします。 スキャルピング戦略:高速で正確なデイトレードおよび短期取引のために設計されています。 安定性:すべてのインジケーターはノンリペイント、ノンリドロー、ノ
トレンド スクリーナー インジケーターでトレンド取引の力を解き放ちます。ファジー ロジックと複数通貨システムを活用した究極のトレンド取引ソリューションです。 ファジー ロジックを活用した革新的なトレンド インジケーターである Trend Screener を使用して、トレンド取引を向上させます。 これは、13 を超えるプレミアム ツールと機能、および 3 つの取引戦略を組み合わせた強力なトレンド追跡インジケーターであり、Metatrader をトレンド アナライザーにする多用途の選択肢となります。 期間限定オファー : トレンド スクリーナー インジケーターは、わずか 100 ドルで生涯ご利用いただけます。 (元の価格 50$ ) (オファー延長) Trend Screener の 100% 非再描画精度の揺るぎない精度を体験して、取引の決定が過去の価格変動の影響を受けないようにしてください。 マルチタイムフレームおよびマルチ通貨機能の多用途性を解放し、比類のない自信を持って外国為替、商品、暗号通貨、インデックスの世界を取引できるようにします。 Trend Screener の包括的な
Meridian Pro
Ottaviano De Cicco
5 (1)
Meridian Pro:MT5用プロフェッショナル・マルチタイムフレーム・トレンドマトリックス 概要 Meridian Pro は Merkava Labs が開発したマルチタイムフレーム・トレンドマトリックスで、方向性の状態、強度、モメンタムの状況、マトリックスの合意をひとつのコンパクトなパネルに集約します。ひとつのアダプティブエンジンがM1からW1まで一貫して適用されます。シンボルごとの調整は不要。インジケーターの積み重ねも不要。すべてのアセットとすべてのタイムフレームをカバーするひとつの構造化された読み取りです。 発売キャンペーン — Meridian Proを USD 99 (導入価格)で入手。通常価格:USD 149 。 1. Meridian Proが他と異なる理由 ひとつのエンジン、バラバラなインジケーターのダッシュボードではない 多くのMTFダッシュボードは、タイムフレームごとに生のインジケーター値を繰り返すだけです。Meridian Proはマトリックス全体でひとつのアダプティブ・トレンドエンジンを使用するため、パネルの各行が同じ構造化フレームワークから導出されます
Quantum TrendPulse を ご紹介します。これは、   SuperTrend   、   RSI   、および Stochastic のパワーを 1 つの包括的なインジケーターに組み合わせて、取引の可能性を最大限に引き出す究極の取引ツールです。精度と効率を求めるトレーダー向けに設計されたこのインジケーターは、市場のトレンド、勢いの変化、最適なエントリー ポイントとエグジット ポイントを自信を持って特定するのに役立ちます。 主な特徴: SuperTrend 統合: 現在の市場動向に簡単に追従し、収益性の波に乗ることができます。 RSI精度: 買われすぎと売られすぎのレベルを検出し、市場の反転のタイミングに最適で、SuperTrendのフィルターとして使用されます。 確率的精度: 確率的振動を活用して、変動の激しい市場で隠れたチャンスを見つけます。SuperTrend のフィルターとして使用されます。 マルチタイムフレーム分析:   M5 から H1 または H4 まで、さまざまなタイムフレームで市場を常に把握します。 カスタマイズ可能なアラート: カスタム取引条件が満たされ
FX Trend NG:次世代マルチマーケット・トレンドインテリジェンス 概要 FX Trend NG は、複数の時間足に対応したプロフェッショナル向けトレンド分析およびマーケット監視ツールです。 市場全体の構造を数秒で把握することができます。 複数のチャートを切り替える必要はありません。どの銘柄がトレンド中なのか、どこでモメンタムが弱まっているのか、そしてどの時間足で強い整合性があるのかを瞬時に確認できます。 ローンチ特別オファー – FX Trend NG を $30(6ヶ月) または $80 永久ライセンス でご利用いただけます。 すでに Stein Investments のユーザーですか? -> メッセージを送信 して、プライベートグループへアクセスしてください。 セットアップや詳細情報が必要ですか? -> Stein Investments 公式ページ をご覧ください。 1. FX Trend NG が他と異なる理由 3ステート・トレンドロジック ― Buy と Sell だけではない • 多くのインジケーターは Buy または Sell の2状態のみを表示します。
BTMM State Engine Pro is a MetaTrader 5 indicator for traders who use the Beat The Market Maker approach: Asian session context, kill zone timing, level progression, peak formation detection, and a multi-pair scanner from a single chart. It combines cycle state logic with a built-in scanner dashboard so you do not need the same tool on many charts at once. What it does Draws the Asian session range; session times can follow broker server offset or be set in inputs. Tracks level progression (L
Gann Made Easy   は、ミスター・ギャンの理論を使用した取引の最良の原則に基づいた、プロフェッショナルで使いやすい外国為替取引システムです。 W・D・ガン。このインジケーターは、ストップロスとテイクプロフィットレベルを含む正確な買いと売りのシグナルを提供します。 PUSH通知を利用して外出先でも取引可能です。 ご購入後、取引方法の説明と優れた追加インジケーターを無料で入手するには、私にご連絡ください! おそらく、ギャンの取引手法についてはすでに何度も聞いたことがあるでしょう。通常、ギャンの理論は初心者のトレーダーだけでなく、すでにある程度の取引経験がある人にとっても非常に複雑なものです。なぜなら、ギャンの取引手法は理論的にはそれほど簡単に適用できるものではないからです。私はその知識を磨き、最良の原則を私の外国為替インジケーターに組み込むために数年を費やしました。 このインジケーターは非常に簡単に適用できます。必要なのは、それをチャートに添付し、簡単な取引推奨事項に従うだけです。このインジケーターは常に市場分析の仕事を行い、取引の機会を探します。適切なエントリーポイントを検
ARICoin is a powerful trading companion designed to generate high-probability entry signals with dynamic TP/SL/DP levels based on volatility. Built-in performance tracking shows win/loss stats, PP1/PP2 hits, and success rates all updated live. Key Features: Buy/Sell signals with adaptive volatility bands Real-time TP/SL/DP levels based on ATR Built-in MA Filter with optional ATR/StdDev volatility Performance stats panel (Success, Profit/Loss, PP1/PP2) Alerts via popup, sound, push, or email Cust
Trend Ai indicatorは、トレンドの識別と実用的なエントリポイントと反転アラートを組み合わせることで、トレーダーの市場分析を強化する優れたツールです。 この指標は、ユーザーが自信と正確さで外国為替市場の複雑さをナビゲートすることを可能にします トレンドAiインジケーターは、主要なシグナル以外にも、プルバックやリトレースメント中に発生するセカンダリエントリポイントを識別し、トレーダーが確立されたトレンド内の価格修正を活用できるようにします。 重要な利点: *MT4およびMT5の仕事 *明確な買いまたは売りシグナル *再描画しません ·すべての資産で動作します 私はeaやセットをtelegram it詐欺で販売しないように注意してください。 すべての設定はここでブログで無料です。  重要! 指示とボーナスを得るために購入後すぐに私に連絡してください! 私の他のプロダクトと同様、実質操作の監視はここに見つけることができます: https://www.mql5.com/en/users/mechanic/seller&nbsp ; 設定および入力: すべての
あなたのシンボルでどの戦略が実際に機能するか確認しましょう - リアルマネーをリスクにさらす前に。 Power Barは、あらゆるシンボルとあらゆるタイムフレームで 極端な価格バー を検出し、3つの異なるトレード戦略を即座にバックテストします。勝率、プロフィットファクター、損益を並べて比較できます。すべてが1つのインタラクティブなパネルに集約されています。 推測なし。カーブフィッティングなし。データだけです。 Power Barが特別な理由 ほとんどのインジケーターはシグナルを出すだけで、それが機能するかどうかは推測に任されます。Power Barはさらに先を行きます - すべてのシグナルを 3つの戦略 に対してテストし、統計を表示します。FlipFlop、Momentum、Reversalをワンクリックで切り替え、数値が即座に変化するのを確認できます。 FlipFlop - 常にポジションを保有。シグナルでエントリーし、反対シグナルでイグジット。当社のリサーチでは、US30、US500、DAXなどのトレンドのあるインデックスで最も効果的です。 Momentum - シグナルの方向に
まず第一に、この取引ツールはノンリペイント、ノンリドロー、ノンラグの指標であり、プロの取引に理想的ですことを強調する価値があります。 オンラインコース、ユーザーマニュアル、デモ。 スマートプライスアクションコンセプトインジケーターは、新米から経験豊富なトレーダーまで、非常 に強力なツールです。Inner Circle Trader AnalysisやSmart Money Concepts Trading Strategiesなど、20以上の有用な指標を1つに組み合わせています。このインジケーターはスマートマネーコンセプトに焦点を当て、大手機関の取引方法を提供し、彼らの動きを予測するのに役立ちます。 特に、流動性分析に優れており、機関がどのように取引しているかを理解しやすくしています。市場のトレンドを予測し、価格の動きを慎重に分析するのに優れています。機関の戦略とトレードを合わせることで、市場の動向についてより正確な予測ができます。このインジケーターは多目的であり、市場構造を分析し、重要な注文ブロックを特定し、さまざまなパターンを認識するのに優れています。 このインジケーター
Crystal Heikin Ashi Signals - Professional Trend & Signal Detection Indicator Advanced Heikin Ashi Visualization with Intelligent Signal System for Manual & Automated Trading Final Price: $149 ---------> Price goes up $10 after every 10 sales . Limited slots available — act fast . Overview Crystal Heikin Ashi Signals is a professional-grade MetaTrader 5 indicator that combines pure Heikin Ashi candle visualization with an advanced momentum-shift detection system. Designed for both manual traders
FX Power: 通貨の強弱を分析して、より賢い取引を実現 概要 FX Power は主要通貨と金の実際の強弱をあらゆる市場状況で理解するための必須ツールです。強い通貨を買い、弱い通貨を売ることで、 FX Power は取引の意思決定を簡素化し、高い確率の取引機会を見出します。トレンドを追従する場合でも、極端なデルタ値を使用して反転を予測する場合でも、このツールはあなたの取引スタイルに完全に適応します。ただ取引するだけではなく、 FX Power で賢く取引をしましょう。 1. なぜ FX Power がトレーダーにとって非常に有益なのか 通貨と金のリアルタイム強弱分析 • FX Power は主要通貨と金の相対的な強弱を計算し、マーケットダイナミクスに関する明確な洞察を提供します。 • どの資産がリードしているか、または後れを取っているかを監視して、取引するペアを賢く選びましょう。 マルチタイムフレームの包括的なビュー • 短期、中期、長期のタイムフレームで通貨と金の強弱を追跡し、マーケットトレンドに基づいて取引戦略を調整できます。 • スキャルピングからスイングトレード
Auto Optimized Parabolic RSI: 高度な3Dモメンタムエンジン ほとんどのリテール向けインジケーターは、市場のボラティリティが変化した瞬間に破綻する静的な入力値に依存しているため、失敗に終わります。Auto Optimized Parabolic RSIは、自らの数学的優位性を継続的に再計算することで「インジケーターの陳腐化」問題を解決し、機関投資家レベルの定量的適応力をMT5ターミナルに直接もたらします。 最大の強み: カスタムインメモリ3D最適化 標準的な自動最適化ツールは、インジケーターの呼び出しで端末に過負荷をかけるため、頻繁にMT5プラットフォームをフリーズさせます。本ツールは、このボトルネックを完全に回避しています。RAMベースのカスタムネイティブ計算機を内蔵した内部エンジンは、チャートを読み込んだりタイムフレームを変更したりするたびに、超高速の3Dグリッド探索を実行します。RSI期間(頻度)、SARステップ(加速度)、SAR最大値(制限速度)を同時にスイープし、プラットフォームを遅延させることなく、数万通りものパラメーターの組み合わせを絶対的なミ
まず第一に、この取引インジケーターは再描画されず、再描画されず、遅延しないことを強調する価値があります。これにより、手動取引とロボット取引の両方に理想的なものになります。 ユーザーマニュアル:設定、入力、戦略。 アトミックアナリストは、価格の強さとモメンタムを利用して市場でより良いエッジを見つけるためのPA価格アクションインジケーターです。ノイズや誤ったシグナルを除去し、取引ポテンシャルを高めるための高度なフィルターを備えています。複雑なインジケーターの複数のレイヤーを使用して、アトミックアナリストはチャートをスキャンし、複雑な数学的計算をシンプルなシグナルと色に変換します。これにより、どのような初心者トレーダーでも理解して使用し、一貫した取引の決定を行うことができます。 「アトミックアナリスト」は、新規および経験豊富なトレーダー向けにカスタマイズされた包括的な取引ソリューションです。プレミアムインジケーターとトップノッチの機能を1つの取引戦略に組み合わせ、すべてのタイプのトレーダーにとって汎用性のある選択肢にします。 デイリートレーディングとスキャルピング戦略:高速で正確なデイ
Bill Williams Advanced is designed for automatic chart analysis using Bill Williams' "Profitunity" system. The indicator analyzes four timeframes at once. Manual (Be sure to read before purchasing) Advantages 1. Analyzes the chart using Bill Williams' "Profitunity" system. Signals are displayed in a table in the corner of the screen and on the price chart. 2. Finds all known AO and AC signals, as well as zone signals. Equipped with a trend filter based on the Alligator. 3. Finds "Divergence Bar
Smart Stop Indicator – チャート上で実現するインテリジェントなストップロス精度 概要 Smart Stop Indicator は、ストップロスを勘や感情ではなく、明確で体系的に設定したいトレーダーのために設計されています。本ツールは、クラシックなプライスアクション(高値更新・安値切り下げ)と最新のブレイクアウト認識ロジックを組み合わせ、次に来るべき論理的なストップレベルを正確に特定します。トレンド相場、レンジ、急速なブレイクアウト局面のいずれであっても、最適な SL ゾーンとその状態(“new”、“broken”、“valid”)をチャート上に直接表示します。さらに今回、SL 距離の %ADR 表示も新たに追加されています。 主な特徴 マーケット構造に基づく自動ストップ配置 • 市場構造とリアルタイムの値動きに基づき、意味のあるストップロスレベルを自動検出します。 スマートなブレイクアウト感知 • 急激な方向転換やブレイクアウトにも柔軟に対応し、早すぎるストップ調整を避けます。 SL %ADR の表示 • ストップロスまでの距離を ADR(Averag
Introducing Indicator for PainX and GainX Indices Traders on Weltrade Get ready to experience the power of trading with our indicator, specifically designed for Weltrade   broker's PainX and GainX Indices.  Advanced Strategies for Unbeatable Insights Our indicator employs sophisticated strategies to analyze market trends, pinpointing optimal entry and exit points.  Optimized for Maximum Performance To ensure optimal results, our indicator is carefully calibrated for 5-minute timeframe charts on
RelicusRoad Pro: 定量的市場オペレーティングシステム 【期間限定】無制限アクセス 70% OFF - 2,000人超のトレーダーと共に なぜ多くのトレーダーは「完璧な」インジケーターを使っても失敗するのでしょうか? それは、文脈を無視して 単一の概念 だけでトレードしているからです。文脈のないシグナルは単なるギャンブルです。勝ち続けるには、 根拠の重なり(コンフルエンス) が必要です。 RelicusRoad Proは単なる矢印インジケーターではありません。完全な 定量的市場エコシステム です。独自のボラティリティモデリングを用いて、価格が推移する「適正価値の道(Fair Value Road)」をマッピングし、ノイズと真の構造的ブレイクを判別します。 推測はやめましょう。機関投資家レベルの「ロード・ロジック」でトレードを。 コアエンジン:「Road」アルゴリズム システムの中心となる Road Algo は、市場環境にリアルタイムで適応するダイナミックなボラティリティチャネルです。 安全ライン(平衡点) と、価格が数学的に反転しやすい 拡張レベル を投影します。 Si
Berma Bands
Muhammad Elbermawi
5 (8)
Berma Bands (BBs) インジケーターは、市場のトレンドを特定して活用したいトレーダーにとって貴重なツールです。価格と BBs の関係を分析することで、トレーダーは市場がトレンド段階にあるか、レンジ段階にあるかを判断できます。 詳細については、[ Berma Home Blog ] をご覧ください。 バーマ バンドは、上部バーマ バンド、中部バーマ バンド、下部バーマ バンドの 3 つの異なる線で構成されています。これらの線は価格の周りにプロットされ、全体的な傾向に対する価格の動きを視覚的に表します。これらのバンド間の距離から、ボラティリティや潜在的な傾向の反転についての洞察を得ることができます。 バーマ バンドの線がそれぞれ離れると、市場が横ばいまたはレンジ相場の期間に入っていることを示すことがよくあります。これは、明確な方向性の偏りがないことを示しています。トレーダーは、これらの期間中にトレンドを特定するのが難しいと感じる可能性があり、より明確なトレンドが出現するまで待つ場合があります。 バーマ バンドの線が 1 本の線に収束すると、強いトレンド環境の兆候となること
ARIPoint is a powerful trading companion designed to generate high-probability entry signals with dynamic TP/SL/DP levels based on volatility. Built-in performance tracking shows win/loss stats, PP1/PP2 hits, and success rates all updated live. Key Features: Buy/Sell signals with adaptive volatility bands Real-time TP/SL/DP levels based on ATR Built-in MA Filter with optional ATR/StdDev volatility Performance stats panel (Success, Profit/Loss, PP1/PP2) Alerts via popup, sound, push, or email Cu
現在33%オフ 初心者にもエキスパートトレーダーにも最適なソリューション このインジケーターは独自の機能と新しい公式を多数内蔵しており、ユニークで高品質かつ手頃な取引ツールです。このアップデートでは、2つの時間枠ゾーンを表示できるようになります。より長いTFだけでなく、チャートTFとより長いTF(ネストゾーンを表示)の両方を表示できます。すべてのSupply Demandトレーダーの皆さんのお気に召すはずです。:) 重要情報の公開 Advanced Supply Demandの可能性を最大化するには、 https://www.mql5.com/ja/blogs/post/720245 にアクセスしてください。   エントリーまたはターゲットの正確なトリガーポイントを正確に特定できれば取引がどのように改善されるか想像してみてください。新しい基盤となるアルゴリズムに基づいて構築されているため、買い手と売り手の間の潜在的な不均衡をさらに簡単に特定できます。これは、最も強い需要と供給のゾーンと、過去のパフォーマンス(古いゾーンを表示)がグラフィカルに表現されるためです。これらの機能は、最適な
トレンドトレーディング は、タイミングのプルバックとブレイクアウトにより、市場で起こっているトレンドから可能な限り利益を得るように設計された指標です。確立されたトレンドの中で価格が何をしているかを分析することにより、取引の機会を見つけます。 [ インストールガイド | 更新ガイド | トラブルシューティング | よくある質問 | すべての製品 ] 自信を持って効率的に金融市場を取引する むち打ちにならずに確立されたトレンドから利益を得る 収益性の高いプルバック、ブレイクアウト、早期の逆転を認識する この指標は、独自の品質とパフォーマンスを分析します 複数時間枠のダッシュボードを実装します インジケーターは再描画されていません 電子メール/音声/視覚アラートを実装します 確立されたトレンドは多くの取引機会を提供しますが、ほとんどのトレンド指標はそれらを完全に無視しています。インジケーターの解釈はかなり簡単です: (1) トレンドの変化 (2) トレンドの方向への後退 (3) トレンドの方向へのブレイクアウト 赤いダッシュ は下降トレンド中の修正です 青いダッシュ は上昇トレンド中
Easy SMC Trading
Israr Hussain Shah
4 (1)
自動RR&BOSスキャナー搭載ストラクチャートレンド バージョン: 1.0 概要 自動RRスキャナー搭載ストラクチャートレンドは、プライスアクションとマーケットストラクチャーを重視するトレーダー向けに設計された包括的なトレーディングシステムです。平滑化されたトレンドフィルターとスイングポイント検出、そしてストラクチャーブレイク(BOS)シグナルを組み合わせ、高確率のトレードセットアップを生成します。 このツールの最大の特徴は、自動リスク管理です。有効なストラクチャーブレイクを検出すると、インジケーターはリスク/リワードゾーン(1:1、1:2、1:3)を瞬時に計算・描画し、価格が目標値に到達すると自動的にトレードの視覚化を管理します。これにより、手動で描画ツールを使用する必要がなくなり、トレーダーは執行のみに集中できます。 主な機能 ダイナミック・ストラクチャーブレイク(BOS)検出 スイングハイ(HH/LH)とスイングロー(HL/LL)を自動的に識別します。 価格が主要なストラクチャーレベルをブレイクすると、チャート上にBOSラインを直接描画し、トレンドの方向を確認します。
作者のその他のプロダクト
Wilder Trend Indicator (MT5) The Wilder Trend Indicator is a clean and lightweight trend-following tool based on Wilder’s Moving Average smoothing method . It visually highlights market direction by separating uptrend and downtrend movements directly on the price chart. The indicator is designed to be simple, flexible, and non-intrusive , making it ideal for discretionary traders who want clear trend confirmation without cluttering the chart. Key Features Uses Wilder-style smoothing for st
FREE
フィルタ:
レビューなし
レビューに返信