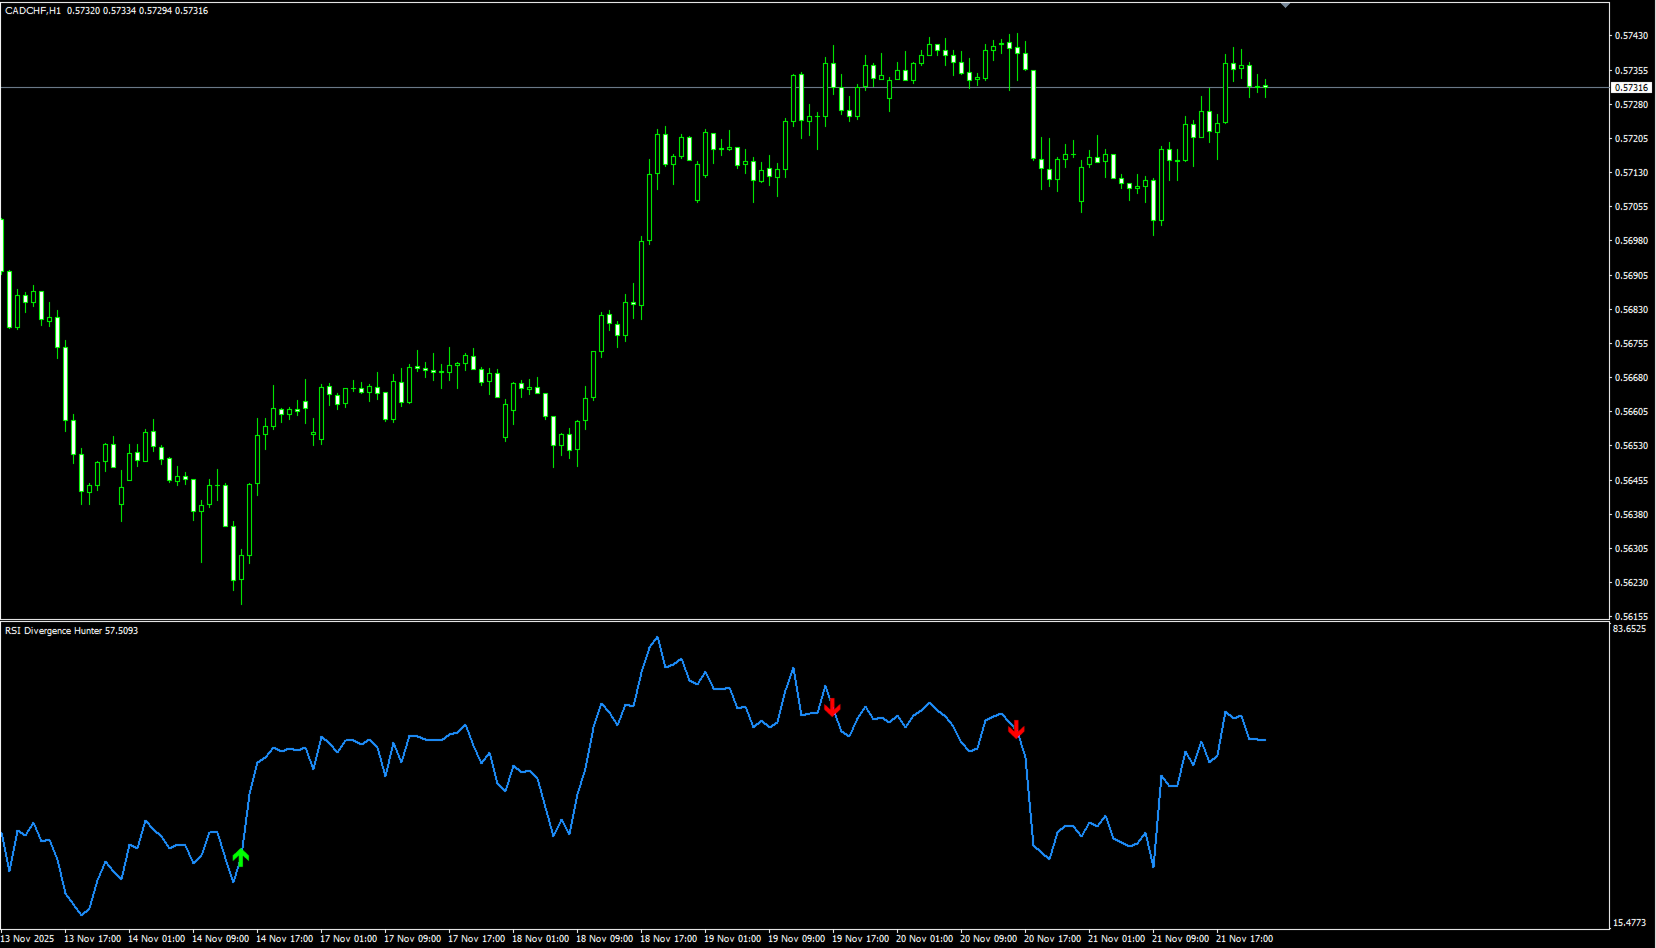
RSI Divergence Hunter
- インディケータ
- バージョン: 1.0

Powered by SVX Strategies Quant Team
Divergences are among the most powerful signals in technical analysis, but spotting them in real-time is difficult and subjective. RSI Divergence Hunter automatically scans the market for these discrepancies between price and momentum.
Eliminate Subjectivity, Automate Profit
Drawing lines manually leads to errors. If you prefer a fully automated, mathematical approach to trading, copy our official institutional algorithms:
WHAT IS A DIVERGENCE?
It is a disagreement between price action and the RSI oscillator, often predicting a reversal.
- Bullish: Price makes a lower low, but RSI makes a higher low (Buy Signal).
- Bearish: Price makes a higher high, but RSI makes a lower high (Sell Signal).
Key Features:
- Auto Detection: Smart algorithm identifies price pivots and compares RSI values instantly.
- Clear Signals: Arrows appear directly on the RSI window where the divergence occurs.
- Fully Customizable: Adjust the pivot sensitivity to fit your trading style.
Strategy:
- Trend Reversals: Use divergences to enter at the very beginning of a new trend.
- Continuation: Spot hidden divergences to ride the existing trend.
SVX Strategies | Chief Investment Officer: Alberto Boada
Disclaimer: Educational tool. Past performance does not guarantee future results.