Labels

Prints ALL current chart's symbol and timeframe as customizable labels, ensuring precise anchoring and automatic repositioning during window resizes, timeframe switches, or other chart events. It supports layered display options (background, forefront, or combined color modes) for enhanced visibility without obstructing price data. The accompanying script facilitates global application by attaching or updating the indicator across all open charts in a single execution, promoting efficiency in multi-chart trading environments.

Parameters

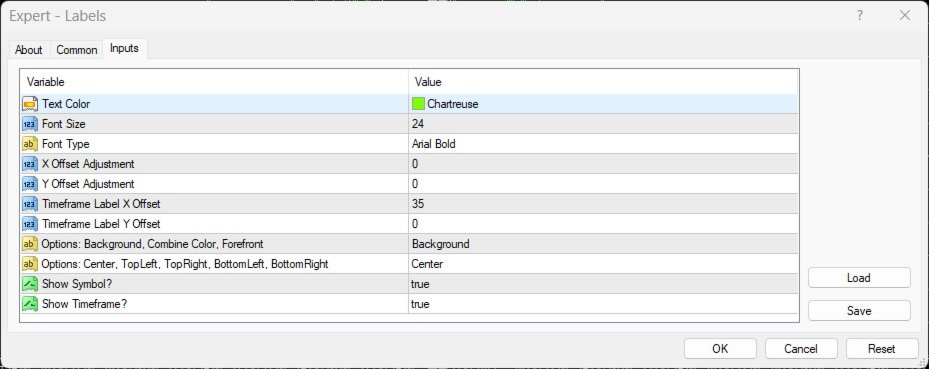
  • TF_Color: Specifies the color of the label text (default: clrChartreuse).
  • TF_FontSize: Defines the font size for the labels (default: 24).
  • TF_Font: Sets the font type for the labels (default: "Arial Bold").
  • TF_X_Offset: Adjusts the horizontal offset for label positioning (default: 0).
  • TF_Y_Offset: Adjusts the vertical offset for label positioning (default: 0).
  • TF_Label_X_Offset: Provides a specific horizontal offset for the timeframe label (default: 35).
  • TF_Label_Y_Offset: Provides a specific vertical offset for the timeframe label (default: 0).
  • Timeframe_Labeled: Controls the display layer and mode; options include "Background" (labels behind chart elements), "Combine Color" (alternating colors for visibility), or "Forefront" (labels in front) (default: "Background").
  • LabelPosition: Determines the anchor position of the labels on the chart; options include "Center", "TopLeft", "TopRight", "BottomLeft", or "BottomRight" (default: "Center").
  • ShowSymbol: Enables or disables the display of the symbol label (default: true).
  • ShowTimeframe: Enables or disables the display of the timeframe label (default: true).
おすすめのプロダクト
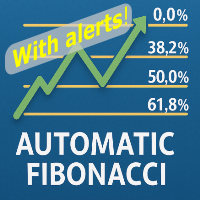
Free automatic Fibonacci is an indicator that automatically plots a Fibonacci retracement based on the number of bars you select on the BarsToScan setting in the indicator. The Fibonacci is automatically updated in real time as new highest and lowest values appears amongst the selected bars. You can select which level values to be displayed in the indicator settings. You can also select the color of the levels thus enabling the trader to be able to attach the indicator several times with differe
FREE
Automatic fibonacci with alerts is an indicator that automatically plots a fibonacci retracement based on the number of bars you select on the BarsToScan setting in the indicator. The fibonacci is automatically updated in real time as new highest and lowest values appear amongst the selected bars. You can select which level values to be displayed in the indicator settings. You can also select the color of the levels thus enabling the trader to be able to attach the indicator several times with d
FREE
The indicator displays signals according to the strategy of Bill Williams on the chart. Demo version of the indicator has the same features as the paid, except that it can work only on a demo account . Signal "First Wise Man" is formed when there is a divergent bar with angulation.  Bullish divergent bar - with lower minimum and closing price in the upper half. Bearish divergent bar - higher maximum and the closing price at the bottom half. Angulation is formed when all three lines of Alligator
FREE
PZ Penta O MT4
PZ TRADING SLU
2.33 (3)
The Penta-O is a 6-point retracement harmonacci pattern which usually precedes big market movements. Penta-O patterns can expand and repaint quite a bit. To make things easier this indicator implements a twist: it waits for a donchian breakout in the right direction before signaling the trade. The end result is an otherwise repainting indicator with a very reliable trading signal. The donchian breakout period is entered as an input. [ Installation Guide | Update Guide | Troubleshooting | FAQ | A
FREE
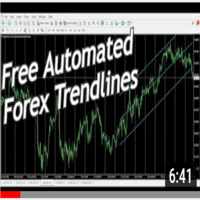
Are you tired of drawing trendlines every time you're analyzing charts? Or perhaps you would like more consistency in your technical analysis. Then this is for you. This indicator will draw trend lines automatically when dropped on a chart. How it works Works similar to standard deviation channel found on mt4 and mt5. It has 2 parameters: 1. Starting Bar 2. Number of bars for calculation The   starting bar   is the bar which drawing of the trend lines will begin, while the   number of bars for c
FREE
Tipu Heikin-Ashi Panel is the modified version of the original Heiken Ashi indicator published by MetaQuotes here . A professional version of this indicator is available here . Features An easy to use Panel that shows the Heiken Ashi trend of selected timeframe. Customizable Buy/Sell alerts, push alerts, email alerts, or visual on-screen alerts. Customizable Panel. The panel can be moved to any place on the chart or minimized to allow more space. Heikin means "the average", and Ashi means "foot
FREE
Follow The Line
Oliver Gideon Amofa Appiah
3.94 (16)
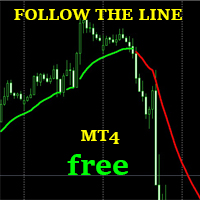
FOLLOW THE LINE GET THE FULL VERSION HERE: https://www.mql5.com/en/market/product/36024 This indicator obeys the popular maxim that: "THE TREND IS YOUR FRIEND" It paints a GREEN line for BUY and also paints a RED line for SELL.  It gives alarms and alerts of all kinds. IT DOES NOT REPAINT and can be used for all currency pairs and timeframes. Yes, as easy and simple as that. Even a newbie can use it to make great and reliable trades. NB: For best results, get my other premium indicators for more
FREE
Perfect for one minutes high trading and scalping. This indicator is very effective for trading on one minutes, in the hour. A combination of moving averages and STOCHASTICS calculation to produce a very convincing signal every hour. Blue colour signals a buy opportunity. Follow the X signs for possible buy points. The Blue average line serves as possible trend direction and support. Red colour signals a sell opportunity. Follow the X signs for possible sell points. The Red average line serves a
FREE
Candle Countdown — MT4用 正確なローソク足カウントダウン Candle Countdown は、 現在のローソク足が閉じるまでの残り時間 をチャート上に表示するシンプルで正確なツールです。 エントリーがローソク足のクローズに依存する場合、数秒の違いが重要になります。 このインジケーターは正確な時間を表示し、焦らずに判断できるようサポートします。 ローソク足のクローズ時間を正確に把握するためのインジケーターです。 表示内容: ローソク足が閉じるまでの残り時間 サーバー現在時刻 スプレッド ストップレベル(Stop Level) タイマーはティックに依存せず、プラットフォームの内部タイマーによって更新されるため、市場の動きが少ない場合でも安定した表示を維持します。 これにより、低ボラティリティの環境でも滑らかで安定したカウントダウンを実現します。 情報は背景付きのブロック内に表示されるため、どのチャートカラーでも見やすく、分析の妨げになりません。 ローソク足のクローズが近づくと、タイマーの色が変化し、視覚的に状況を把握しやすくなります。 MT5版はこちら: Cand
FREE
The indicator calculates the current spread for each tick using the formula Spread=(ASK-BID)/Point. Schedule of changes in the boundaries spread over the timeframe displayed in a separate window from the date of accession of the indicator. Two lines corresponding to the minimum and maximum spread values are displayed. The indicator window is self-adjusted according to the minimum and maximum values from the moment of launch. The minimum and maximum values for the entire period of the indicator o
FREE
This is a multi-timeframe version of the popular Hull Moving Average (HMA). The Double HMA MTF Light indicator combines two timeframes on a single chart. The HMA of the higher timeframe defines the trend, and the HMA of the current timeframe defines short-term price movements. The indicator is freely distributed and hasn't audio signals or messages. Its main function is the visualization of price movements. If you need advanced functionality of the HMA multi-timeframe indicator (information ab
FREE
Rainbow MT4 is a technical indicator based on Moving average with period 34 and very easy to use. When price crosses above MA and MA changes color to green, it’s a signal to buy. When price crosses below MA and MA changes color to red, it’s a signal to sell. The Expert advisor ( Rainbow EA MT4) based on Rainbow MT4 indicator, as you can see in the short video below is now available here .
FREE
Aroon Classic インジケーターの概要 Aroon Classic は、チャート上でトレンドの発生と持続性を定量的に把握できるテクニカル指標です。トレンドの強さや転換タイミングを「Aroon Up」と「Aroon Down」という2本のラインで示し、0~100 の範囲で表示されます。Aroon Up が高値圏にあるほど上昇トレンドが強く、Aroon Down が高値圏にあるほど下降トレンドが強いことを意味します。 主な特徴 トレンドの発生から転換までを視覚的に判別可能 カスタマイズ可能な計算期間(デフォルト14期間) 線の色・太さ・スタイルを自由に設定可能 インジケーターのパラメーター パラメーター名 説明 デフォルト値 Period Aroon の計算に使用するバー数 14 Aroon Up Color Aroon Up ラインの色 DodgerBlue Aroon Down Color Aroon Down ラインの色 Tomato Line Width ラインの太さ(ピクセル) 2 インジケーターの計算方法 Aroon Up は、直近期間内の最高値が発生してからのバー数
FREE
Arrow Indicator (Buy/Sell Alerts) – Simple Yet Powerful Tool!             Product Version: 1.01           Indicator Type: Trend Reversal Signals           Timeframes Supported: All (Recommended: H1, H4, D1)           Key Features: Buy Signal: Green upward arrow () appears below the candle  Sell Signal : Red downward arrow () appears above the candle Accurate Trend Reversal Detection – Based on tried and tested SMA strategy. ️ Clean Chart View – Minimalist, non-i
FREE
Blahtech VWAP
Blahtech Limited
5 (3)
Blahtech VWAP - Volume Weighted Average Price (VWAP) is the ratio of price to total volume. It provides an average price over a specified time interval.  Links [  Install  |  Update  |  Documentation   ] Feature Highlights Configurable VWAP Line Sessions, intervals, anchored or continuous Previous day settlement line Standard Deviation bands Alerts at bar close or real time Automatic Broker or Tick volumes Significantly reduced CPU usage Input Parameters Expert Advisor Mode  - Reserved for iC
FREE
DF Fib Trader Pro DF Fib Trader Proは、MetaTrader 4向けに設計された自動取引システムです。 フィボナッチベースの価格水準とトレンドおよびストラクチャー分析を組み合わせ、エントリーポイントとエグジットポイントを決定します。このEAはロングポジションとショートポジションの両方をサポートし、リスク管理パラメータも組み込まれています。 主な機能: • フィボナッチ・リトレースメントとエクステンション・ロジックを用いて、エントリーポイント、SLポイント、TPポイントをプロットします。 • ロットサイズと損切り/利益確定レベルを設定可能 • エントリーポイントは1つまたは2つから選択可能 • 市場状況に応じて、固定または動的な損切り/利益確定をサポート • 複数の時間枠と通貨ペアに対応 • 最大スプレッド、スリッページ、取引頻度の制御オプションを搭載 • 自動取引管理:損益分岐点、トレーリングストップ、部分決済オプション • 希望に応じて成行注文もサポート入力項目の概要: • リスク管理:ロットサイズ、取引ごとのリスク、最大取引回数 • エントリー
FREE
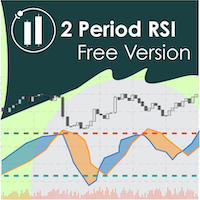
Two Period RSI compares long-term and short-term RSI lines, and plots a fill between them for improved visualization. Fill is colored differently according to an uptrend (short period RSI above long period RSI) or a downtrend (short period RSI below long period RSI). Short-term RSI crossing long-term RSI adds a more robust trend confirmation signal than using single period RSI alone. This is a small tool to help visualize and confirm RSI trends. We hope you enjoy! Looking for RSI alerts? You can
FREE
*This is TradingView indicator converted to mql4* The SuperTrend V indicator is a popular technical analysis tool used to identify trends and potential trend reversals in financial markets. It is based on the concept of the SuperTrend indicator but incorporates additional features and variations. The SuperTrend V indicator uses a combination of price action and volatility to determine the trend direction and generate trading signals. Here are the key components and features of the indicator: Ca
FREE
FFx Momentum
Eric Venturi-Bloxs
4 (1)
The purpose of this new version of the MT4 standard indicator provided in your platform is to display in a sub-window multiple timeframes of the same indicator. See the example shown in the picture below. But the display isn’t like a simple MTF indicator. This is the real display of the indicator on its timeframe. Here's the options available in the FFx indicator: Select the timeframes to be displayed (M1 to Monthly) Define the width (number of bars) for each timeframe box Alert pop up/sound/ema
FREE
MT5 Version Most indicators draw lines. This one draws the battlefield. If you ever bought an EA or indicator based on a perfect equity curve — and then watched it bleed out live — you’re not alone. The problem? Static logic in a dynamic market. Fibonacci Bollinger Bands adapts. It combines Bollinger structure with customizable Fibonacci levels to mark zones of control — where price reacts, pauses, or reverses. No magic. Just logic that follows volatility. Why this tool matters It shows yo
FREE
MTF Commodity Channel Index (CCI) Matrix (Free Advanced Trend Scanner Dashboard) The Multi-Timeframe Commodity Channel Index (CCI) Matrix is an institutional-grade technical scanner designed to evaluate cyclical trend momentum and structural threshold breakouts across 4 distinct execution timeframes simultaneously[cite: 18, 19]. By monitoring the M15, H1, H4, and D1 intervals concurrently[cite: 18, 19], this utility completely eliminates multi-chart cluttering and gives traders an instant execu
FREE
ハーモニックパターンは市場の転換点を予測するのに最適です。これらのパターンは高い勝率と1日の中での多くの取引機会を提供します。当社のインジケーターは、ハーモニックトレーディングの原則に基づいて、市場反転ポイントを予測する最も一般的なハーモニックパターンを特定します。 重要な注意事項: インジケーターは再描画されず、遅れることはありません(パターンはDポイントで検出されます);再描画されることはありません(パターンは有効またはキャンセルされます)。 使用方法: インジケーターをMT5チャートにドラッグアンドドロップします。 パターン検出をTRUE(ABCD;Gartley)に設定します。 任意のデバイスを設定します(高いデバイス=より多くのパターン;低いデバイス=より少ないパターン)。 好みに合わせて色を調整します。 バルブ/エントリーポイント、TP、SLの警告を有効または無効にします。 パターンが検出された場合: アルゴリズムはDポイントでパターンを検出します。 警告が有効になっている場合、パターン検出を通知します。 パターンが無効になった場合、「パターンがキャンセルされました」という
FREE
OrderBlock TS Roman
Vladislav Vlastovskii
4 (6)
Индикатор строит блоки заказов (БЗ) по торговой системе (ТС) Романа. Поиск блоков осуществляется одновременно на двух таймфремах: текущем и старшем (определяемым в настройках). Для оптимизации и игнорирования устаревших блоков в настройках задается ограничение количества дней в пределах которых осуществляется поиск блоков. Блоки строятся по правилам ТС состоящем из трех шагов: какую свечу вынесли (что?); какой свечой вынесли (чем?); правило отрисовки (как?).
FREE
MACD indicator in MetaTrader 4/5 looks different than MACD does in most other charting software. That is because the MetaTrader 4/5 version of MACD displays the MACD line as a histogram when it is traditionally displayed as a line. Additionally, the MetaTrader 4/5 version computes the Signal line using an SMA, while according to MACD definition it is supposed to be an EMA. The MetaTrader 4/5 version also does not compute a true MACD Histogram (the difference between the MACD/Signal lines). This
FREE
Auto Supply and Demand Oscillator is an indicator for MetaTrader 4 and MetaTrader 5 that detects supply and demand zones automatically and displays them as a single oscillator value at the bottom of the chart, instead of drawing rectangles directly on price. Concept Supply zones are price areas where strong selling created a sharp downward move away from a balance area. Demand zones are price areas where strong buying created a sharp upward move. Traditional implementations draw boxes on the
FREE
Power Trend Free - the indicator shows the trend strength in the selected period. Input Parameters The indicator has three input parameters: Period - a positive number greater than one, it shows the number of candlesticks used for calculations. If you enter one or zero, there will be no error, but the indicator will not be drawn. Applied Price - the standard "Apply to:" set meaning data used for the indicator calculation: Close - Close prices; Open - Open prices; High - High prices; Low - Low p
FREE
This indicator alerts you when/before new 1 or 5 minute bar candle formed. In other words,this indicator alerts you every 1/5 minutes. This indicator is especially useful for traders who trade when new bars formed. *This indicator don't work propery in strategy tester.Use this in live trading to check functionality. There is more powerful Pro version .In Pro version,you can choose more timeframe and so on. Input Parameters Alert_Or_Sound =Sound ----- Choose alert or sound or both to notify y
FREE
Where is price in the range - premium, discount or in the OTE zone? This indicator draws it, alerts you, and checks on your own chart what price did next. ICT Premium Discount OTE Honest Stats draws the current dealing range with premium, discount, equilibrium (50%) and the optimal trade entry zone (62-79%), alerts you when price reaches the OTE zone, and measures on that chart's own history how often price then went on with the leg, next to random candles. Free, part of the Honest Stats series.
FREE
.....................................hi....................... ................for showing high s and low s and support and resistanses .....................we have a lot of ways............................... it can be helpful for finding trends , higher highs , higher lows , lower highs , lower lows .......................today i write on of thems.......................... ........................you can enter the number of last support and resistanses .........................and it will dra
FREE
Update:ver1.53 (2023/08/16) ・概要と必要環境 手動発注もしくは他ツール等からの発注に対し、指値発注予約の複製を生成します。こちらは「発注操作の簡易化」に特化したものになります。発注判断となる分析は、資料を漁る、経験則を導く、他の分析ツールやEAを併用する等、利用者ご自身で頑張ってください。なお、ver1.28より、「決済後、自動で再発注する」機能が実装されました。(有償版でのみ有効化できます) ・導入と導入後の操作 導入そのものは簡単です。「自動売買可能なEA」として、適当なチャートにて動作させるだけです。(チャートの対象相場は問いません。このEAは、チャートを見ていません)。あとは、「このEAでのローカルコピー以外の発注」があれば、それに応じて「損失が出た場合に備えての追加取引の予約」という形で、指値発注が自動生成されます。 導入操作上の注意として、「本EAを、複数のチャートで動作」はできません。EAがチャート自体を見ておらず、注文状況だけを見ているため、複数のチャートで動かす意味もありません。また、ターミナルとEAの設定として「自動売買」を許可しない
FREE
このプロダクトを購入した人は以下も購入しています
Trade Manager EAへようこそ。これは、取引をより直感的、正確、そして効率的にするために設計された究極の リスク管理ツール です。これは単なるオーダー実行ツールではなく、包括的な取引計画、ポジション管理、リスク管理のためのソリューションです。初心者から上級者、迅速な実行を必要とするスキャルパーまで、Trade Manager EAはあらゆるニーズに対応し、為替、指数、商品、暗号通貨などさまざまな市場で柔軟に対応します。 Trade Manager EAを使用すると、複雑な計算が過去のものになります。市場を分析し、エントリーポイント、ストップロス、テイクプロフィットのレベルをチャート上のラインでマークし、リスクを設定するだけで、Trade Managerが最適なポジションサイズを即座に計算し、SLとTPをピップ、ポイント、口座通貨でリアルタイムに表示します。すべての取引が簡単かつ効果的に管理されます。 主な機能: ポジションサイズ計算機 :定義されたリスクに基づいて取引サイズを瞬時に決定します。 簡単な取引計画 :エントリー、ストップロス、テイクプロフィットを設定するためのド
Exp COPYLOT CLIENT for MT4
Vladislav Andruschenko
4.69 (65)
MetaTrader 4向け 高機能トレードコピーソフト MetaTrader 4 用の、高速・安定・高機能なトレードコピーソフトです。 COPYLOT は、 MetaTrader 4 と MetaTrader 5 間でFX取引をコピーでき、さまざまな口座タイプや運用スタイルに合わせて柔軟に同期できます。 COPYLOT MT4版の対応コピー方式: MetaTrader 4 → MetaTrader 4 MetaTrader 5 Hedge → MetaTrader 4 MetaTrader 5 Netting → MetaTrader 4   MT5版 詳細説明 + DEMO + PDF 購入方法 インストール方法 ログファイルの取得方法 テストと最適化の方法 Expforexの全製品 MetaTrader 5版 を使えば、 MetaTrader 5 → MetaTrader 5 および MetaTrader 4 → MetaTrader 5 のコピーにも対応します: COPYLOT CLIENT for MT5 COPYLOT は、2台、3台、さらには10台規模のターミナル環境でも
Local Trade Copier EA MT4
Juvenille Emperor Limited
4.96 (111)
Local Trade Copier EA MT4 は、同一の Windows PC または Windows VPS 上で稼働する複数の MetaTrader 4 口座間で、取引をコピーおよび管理するための高速で柔軟なトレードコピーツールです。 ローカルでの取引同期に加え、Receiver 側でロットサイズ、リスク管理、取引フィルター、シンボルマッピング、取引管理、口座保護を個別に設定できます。 Transmitter と Receiver のターミナルは約 1分 で設定でき、同一ブローカーまたは異なるブローカーの口座間で、手動取引や EA による取引をコピーできます。適切な条件下では、ローカルの MetaTrader ターミナル間で取引情報を 0.5秒未満 で同期できます。実際の約定速度は、ブローカーのレイテンシー、ネットワーク状況、PC/VPS の性能、ターミナルの負荷によって異なります。 ご購入前に無料デモをお試しください Local Trade Copier EA MT4 の完全機能版無料デモ を、MT4 デモ口座で 1回につき4時間 テストできます。 Local Trad
The product will copy all telegram signal to MT4   ( which you are member  ) , also it can work as remote copier.  Easy to set up, copy order instant, can work with almost signal formats, image signal, s upport to translate other language to English Work with all type of channel or group, even channel have "Restrict Saving Content", work with  multi channel, multi MT5 Work as remote copier: with signal have ticket number, it will copy exactly via ticket number. Support to backtest signal. How to
Trade Assistant MT4
Evgeniy Kravchenko
4.43 (197)
取引 ごとのリスクの 計算、新規注文 の 簡単 な 設置、部分的 な 決済機能 を 持 つ 注文管理、 7 種類 のトレーリングストップなど 、便利 な 機能 を 備 えています 。 追加の資料と説明書 インストール手順 - アプリケーションの手順   ライン機能 チャート上にオープニングライン、ストップロス、テイクプロフィットを表示します。この機能により、新規注文を簡単に設定することができ、注文を出す前にその特徴を確認することができます。   リスク計算 リスク計算機能は、設定されたリスクとストップロス注文のサイズを考慮して、新規注文のボリュームを計算します。ストップロスの大きさを自由に設定できると同時に、設定したリスクを守ることができます。 Lot calc ボタン - リスク 計算 を 有効 / 無効 にします 。 Risk フィールドでは 、必要 なリスクの 値 を 0 から 100 までのパーセンテージまたは 預金通貨 で 設定 します 。 設定」 タブで 、 リスク 計算 の 種類 を 選択 します :「 $ 通貨」、「 % 残高」、「 % エクイティ 」、「 % フリ
Trade Indicator Assistant is a powerful MT4 utility designed to turn indicators into automated trading systems. Its main feature is the ability to automatically detect an indicator’s   BUY and SELL signal buffers , without requiring you to know the buffer numbers, search through indicator settings, or modify the indicator source code. Bonus Indicator: After purchasing Trade Indicator Assistant, contact me to receive Trade Signal Pro completely free as a bonus indicator. [Download Demo Version]
TradePanel MT4
Alfiya Fazylova
4.84 (95)
Trade Panelは多機能なトレーディングアシスタントです。アプリには手動取引用の50以上のトレーディング機能が搭載されており、ほとんどの取引作業を自動化することができます。 アプリの説明書: https://www.mql5.com/en/blogs/post/756482 デモ口座用アプリの試用版: https://www.mql5.com/en/blogs/post/750865 アプリのインストール方法: https://www.mql5.com/en/blogs/post/756239 アプリをビジュアルモードでテストする方法: https://www.mql5.com/en/blogs/post/770277 VPSのMetaTraderにアプリをインストールする方法: https://www.mql5.com/en/blogs/post/770190 取引。 ワンクリックで取引操作を行うことができます: リスクを自動計算して指値注文やポジションを開く。 複数の注文やポジションをワンクリックで開く。 注文のグリッドを開く。 保留中の注文やポジションをグループごとに閉じる
サポートが必要ですか?設定方法は?ご質問は?こちらでお客様の言語でどうぞ、迅速に返信します: https://www.mql5.com/en/market/product/139089/comments 無料トライアル版ダウンロード Copy Cat More (コピーキャット・モア) MT4 トレードコピー (Trade Copier) は単なるローカルのトレードコピーではありません。今日のトレード課題のために設計された 完全なリスク管理・執行フレームワーク (risk management and execution framework) です。プロップファーム (prop firm) のチャレンジから個人のポートフォリオ管理まで、堅牢な執行、資金保護、柔軟な設定、高度なトレード処理の組み合わせによって、あらゆる状況に適応します。 このコピーは   マスター (Master、送信側) と スレーブ (Slave、受信側)   の両モードで動作し、成行注文・指値注文、トレードの変更、部分決済、そして両建て決済 (Close By) 操作をリアルタイムで同期します。デモ口座と実口
Trade copier MT4
Alfiya Fazylova
4.62 (37)
Trade Copierは、取引口座間の取引をコピーして同期するように設計された専門的なユーティリティです。 コピーは、同じコンピューターまたはvps にインストールされている、サプライヤーのアカウント/端末から受信者のアカウント/端末に行われます。 購入する前に、デモ アカウントでデモ バージョンをテストできます。 デモ版 こちら 。 詳細な説明は こちら 。 主な機能と利点: MT5ネッティングアカウントを含む、MT4> MT4、MT4> MT5、MT5> MT4のコピーをサポートします。 高いコピー速度(0.5秒未満)。 ベンダーモードと受信者モードは同じ製品内に実装されています。 チャートから直接リアルタイムでコピーを制御できる、簡単で直感的なインターフェイス。 接続が切断されたり、端末が再起動されたりしても、設定と位置が失われることはありません。 コピーするシンボルを選択できます。また、受信者のシンボルを置き換えることもできます(例:EURUSD> USDJPY)。 各シンボルごとにコピーの個別設定を行うことができます。 バックコピーをサポートします。 特定の注文のみのコピー
TelegramからMT4へ: 究極のシグナルコピーソリューション Telegram to MT4 は、DLLを必要とせず、TelegramのチャンネルやチャットからMetaTrader 4プラットフォームに取引シグナルを直接コピーできる最先端のユーティリティです。この堅牢なソリューションは、比類のない精度とカスタマイズオプションにより、シグナルのシームレスな実行を保証し、時間を節約し、効率性を向上させます。 [ Instructions and DEMO ] 主な特徴 直接的なTelegram API統合 電話番号とセキュアコードで認証します。 ユーザーフレンドリーな EXE ブリッジを使用して、チャット ID を簡単に取得および管理します。 複数のチャネル/チャットを追加、削除、更新して、同時に信号をコピーします。 高度なフィルターによる信号解析 カスタム例外語 (例: 「レポート」、「概要」) を含む不要な信号をスキップします。 柔軟な SL および TP 形式 (価格、ピップ、ポイント) をサポートします。 シグナルが価格ではなくポイントを指定する場合、エントリ ポイントを自動
News Filter EA: Advanced Algo Trading Assistant News Filter EA is an advanced algo trading assistant designed to enhance your trading experience. By using the   News Filter EA , you can integrate a Forex economic news filter into your existing expert advisor, even if you do not have access to its source code. In addition to the news filter, you can also specify   trading days   and   hours   for your expert. The News Filter EA also includes   risk management   and   equity protection   features
DoIt Trade Manager - Risk Panel and EA Position Manager for MT4 Finding an entry is only half the job. Many execution mistakes happen in position sizing, partial exits, breakeven, trailing and account protection. DoIt Trade Manager puts the complete workflow on the chart. Plan the risk before entry, execute the order and apply consistent management rules to your manual trades and selected positions opened by other EAs. Full setup guide + how the free version works and where PRO starts :  https:/
これは視覚的な取引パネルであり、取引を簡単に配置および管理し、人為的エラーを回避し、取引活動を強化するのに役立ちます。使いやすい視覚的なインターフェースと、健全なリスクおよび位置管理アプローチを組み合わせています。 [ インストールガイド | 更新ガイド | トラブルシューティング | よくある質問 | すべての製品 ] 驚くほど使いやすい チャートから簡単に取引 正確なリスク管理との取引、手間のかからない 資本の保存が最優先事項です 気をつけずに利益を上げましょう できるだけ早くリスクのない取引をお楽しみください 開かれているすべての取引の自動トレーリングストップ 最初のストップロスは、取引が行われるとすぐに配置されます EAは、取引を行った後に次のタスクを実行します。 最初のストップロス/テイクプロフィットは自動的に配置されます できるだけ早くフリーライドにロックします(オプション) ストップロスを初めて損益分岐点に移動します(オプション) 停止するまで、希望の方法を使用してストップロスを追跡します その他のクールな機能は次のとおりです。 優れたターミナルアクティビティレポート
The program is use to copy trading from MT4   to MT4 and MT5  on same Windows   PC or VPS .   Now you can easy copy trades to any MT4 account or MT5 account. Instants copy, speed smaller 0.1 seconds, easy to setup. Need run EA as Signal provider on one MT4 account, other MT4 / MT5 will run EA as Trade copier. You can download and try demo version on demo account Copi Trade MT4 demo   version   here   Copi Trade MT5 demo   version  here  
This is the simplest Lot Multiplier to manage trades open by signal, expert or manually.   How The Program Works: When a new trade is open in the terminal from any source (advisor, manually, signal), the program opens an additional trade (duplicates / copies the source with the specified parameters) in the same terminal and controls it as per source, when the source trade parameters (SL, TP) change, the program will automatically change the parameters of additional trade as well, when closing th
Az OrderGun
Jose Antonio Valle Magana
AZ_OrderGun MT4 - Professional 1-Click Trading Panel AZ_OrderGun is the all-in-one panel to execute and manage your trades without wasting time setting up SL/TP. KEY FEATURES: 1. 4 INSTANT ENTRIES: Buy SLL - Buy with SL on Low of previous candle Sell SLH - Sell with SL on High of previous candle Buy SLO / Sell SLO - SL on Open of previous candle > Fully configurable % Risk 2. ADVANCED VISUAL MANAGEMENT: Draggable lines for Pending and Market orders Auto calculation of Lot Size, $ Ri
注文管理やリスク管理など、手間のかかる作業をワンクリックまたは数クリックで行えるようにし、取引を楽にするためのユーティリティです。 特徴 リスク管理  リスク欄に%またはドルで指定されたリスクに基づいて自動的にロットを計算し、SL TPなどのラインを置くだけで入力でき、リスクリワードをリアルタイムで表示します。 TrueRiskは、FXペアのロットサイズ計算時に手数料を含むので、例えば1%を指定した場合、全ての取引手数料で1%のリスクを負うか、負わないかは、あなたの選択です。 シンボルごとの最大取引数量の10倍以上の取引をワンクリックで行えるビッグロッツハンドラーを搭載。 指数や他の資産で、自動計算されたロットサイズがロット単位に合わない場合でも、四捨五入して入力することができます。(1、0.1、0.01のロット単位に対応しています。) トレード管理  ワンクリックで可能です。 手数料とスプレッドを含む、または含まないブレイクイーブンのオープンポジションを設定することができます。 テキストフィールドにSLまたはTPの新しい価格を指定し、入力された新しいSLおよび
Trading History - A program for trading and money management on the history of quotes in stratagy tester. It can work with pending and immediate orders, and is equipped with trailing stop, breakeven and take profit functions. Very good for training and testing different strategies. Manual (Be sure to read before purchasing) Advantages 1. Allows you to test any trading strategy in the shortest possible time 2. An excellent simulator for trading training. You can gain months of trading experience
Close If Profit or Loss with Trailing for MetaTrader 4 — 総利益または総損失で自動決済 MetaTrader 4 用の実用的な取引管理ツールです。設定した総利益または総損失に到達すると、選択されたポジションを自動的に決済できます。 Expert Advisor は保有中の取引を監視し、含み損益を計算し、Trailing Profit を使用して、手動操作より素早くポジション管理を行うことができます。 MetaTrader 4 は現在でも、裁量トレーダー、スキャルピング、グリッド取引、EA 運用で広く使用されています。しかし、MT4 には複数ポジションを「合計結果」で簡単に自動決済する標準機能がありません。このユーティリティは、その不足している管理機能を追加します。 Close If Profit or Loss with Trailing は、裁量取引、他の Expert Advisors、グリッドシステム、ナンピン、リカバリー戦略、複数シンボルの取引と組み合わせて使用できます。ルールを設定すれば、EA が結果を監視し、条件に到
Shepherd Safety EA
AW Trading Software Limited
4.92 (13)
AW Shepherd Safety EA は、保有中のポジションを管理するエキスパートアドバイザーです。最初の注文はトレーダーがパネルから発注し、その後は EA がバスケットを自動で管理します。トレンドフィルターを通してリカバリー注文を追加し、TakeProfit、トレーリング、またはストップでサイドを決済し、決済の水準をチャートに表示します。 買いと売りは別々に管理され、両方のサイドを同時に保有できます。リカバリー注文は、価格が一定の間隔だけ動いたというだけでは発注されず、Parabolic SAR、2本の MA、またはローソク足の色でポジション方向への反転が確認されてから発注されます。Orders Magic number が一致していれば、手動や他の EA で発注したポジションも管理の対象になります。 EA によるポジション管理の流れ: 1 トレーダーが Open Buy または Open Sell ボタンで、Order Size 欄のロットで最初の注文を発注します。 2 価格がポジションに不利な方向へ Minimal step between recovery orders
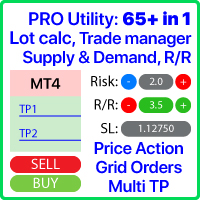
多機能取引ツール:ロット計算機、グリッド注文、R/R比率、トレードマネージャー、需給ゾーン、プライスアクションなど デモ版   |   ユーザーマニュアル トレードアシスタント はストラテジーテスターでは動作しません:この ユーティリティ をテストするには デモ版をこちら からダウンロードしてください。 ご質問 /改善のアイデア/バグ発見 の場合は 私に連絡 してください MT5版が必要な場合は、 こちら から入手できます 取引 プロセス を簡素化、高速化、自動化します。この ダッシュボード で標準ターミナルの機能を拡張します。 取引パネル はあらゆる取引銘柄で動作します:FX、株式、指数、暗号通貨など。 1. 新規取引の開始 :ロット/リスク/RR計算:手動取引のリスク管理 ロット計算機(リスクサイズに基づく取引量計算) リスク計算機(ロットサイズに基づくリスク額) リスクリワード比率 グリッド注文: + 動的間隔オプション、分割ロットオプション 注文アクショントリガー、+ 買いストップリミット/売りストップリミット:Mt4でも可能 仮想SL、仮想TP(非表示SL、非表示TP:ブロ
RS Trade Copier - 超高速 で動作するローカルトレードコピー機。 真の グラフィカルインターフェース搭載。口座番号の手動入力はもう終わりです。200項目を超える長大なパラメータリストとも、これでおさらばです。 複数のMT4とMT5ターミナル間で取引操作をコピーするための、信頼性が高く柔軟なツールです。経験豊富なトレーダーやシグナルサービス、個人投資家に適しています。1つまたは複数のシグナルソース(Provider)から1つまたは複数のレシーバー(Client)へ、高い精度と最小限の遅延で 取引を同期 します。シンプルな自動設定と高度な手動設定の両方をサポートしています。手動または他のEAで開かれた注文に干渉しません。すべての処理は MT4内でローカルに 行われ、サードパーティサーバーを使用しません。 RS Trade Copierと他のソリューションの比較 RS Trade Copier 他のソリューション 設定 ビジュアルステップバイステップウィザード。 設定時間は約1分。 200以上の分かりにくい入力パラメータ。 設定時間は約20分。 速度 非同期トレード操作。*
Telegram to MT4 Multi-Channel Copier   は、 Telegram と Discord チャンネルのトレードシグナルを MetaTrader 4 へ自動コピーします。ボット不要、ブラウザ拡張不要、手動コピー不要。Telegram や Discord にシグナルが届くと、EA が数秒であなたのターミナルに注文を出します。 さらに、チャンネルをコピーする前に、内蔵バックテスターでそのチャンネルがあなたの口座でどう動いたかを確認できます。 製品は 2 つのコンポーネントで構成されます:Telegram チャンネルを監視する Windows アプリと、MT4 ターミナルでシグナルを執行する本 EA です。MT5 版もあります   こちら . 購入前にお試しください:   アプリは無料でダウンロードできます。ご自身のチャンネルを接続し、各シグナルがどのように読み取られるかをご確認ください。Backtest タブと実際の取引には、購入またはレンタルした EA が必要です。このページの無料デモはストラテジーテスターでのみ動作し、テスターでは Telegram と D
Rhino Chart Drawing Tools は、MetaTrader 4 に TradingView スタイル の描画ワークフローを提供します。 54種類の描画ツール 、カスタマイズ可能なツールバー、お気に入り、クイックスタイル、オブジェクト設定、テンプレート、オブジェクトマネージャーを搭載しています。 ユーザーマニュアル: 製品の使い方 無料デモ版: デモ版をダウンロード MetaTrader 5版: Rhino Drawing Tools for MT5 描画ツール グループ オブジェクト一覧 ライン トレンドライン、レイ、延長ライン、水平線、垂直線、水平レイ、クロスライン、トレンド角度、矢印、パス、ポリライン、情報ライン。 チャネル 平行チャネル、回帰チャネル、フラットチャネル、ディスジョイントチャネル、ピッチフォーク。 フィボナッチ リトレースメント、エクステンション、チャネル、スピードファン、タイムゾーン。 ギャン ギャンボックス、ギャンファン。 図形 長方形、回転長方形、楕円、円、三角形、ポリライン。 注釈 テキスト、ノート、コールアウト、価格ラベル、サインポス
MT4 to Telegram Signal Provider は使いやすく、完全にカスタマイズ可能なツールで、Telegramに信号を送信し、あなたのアカウントを信号提供者に変えることができます。 メッセージのフォーマットは 完全にカスタマイズ可能です! しかし、簡単な使用のために、あらかじめ定義されたテンプレートを選択し、メッセージの特定の部分を有効または無効にすることもできます。 [ デモ ]   [ マニュアル ] [ MT5バージョン ] [ Discordバージョン ] [ Telegramチャンネル ]  New: [ Telegram To MT5 ] セットアップ ステップバイステップの ユーザーガイド が利用可能です。 Telegram APIの知識は必要ありません。開発者が必要なものをすべて提供します。 主要機能 購読者に送信される注文の詳細をカスタマイズする機能 例えばブロンズ、シルバー、ゴールドなど、階層型のサブスクリプションモデルを作成できます。ゴールドサブスクリプションでは、すべての信号が得られますなど。 ID、シンボル、またはコメントによる注文のフ
Multi Account Local Trade Copier は MetaTrader 向けの高速ローカルトレードコピーツールです。同じ Windows PC または VPS 上の MT4/MT5 ターミナル間で、1 つのマスター口座から複数のレシーバー口座へトレードをコピーします — ご自身のリアル口座、デモ口座、プロップファーム口座へ。同じブローカーでも、異なるブローカーでも構いません。 イベント駆動型 で、マスターは各トレードを発生した瞬間に公開し、レシーバーは すべてのコピーの実際の遅延を測定・記録 します — 通常 50〜150 ミリ秒 です。DLL 不要、インターネットブリッジ不要、設定ファイル不要。 ステップごとの設定ガイド: Multi Account Local Trade Copier — セットアップガイド 1 つの EA、2 つのモード コピー元ターミナルには MASTER として、各コピー先ターミナルには RECEIVER として適用します。 Master ID = AUTO にすると、レシーバーはアクティブなマスターを自動的に見つけます:ドラッグ&ドロッ
Equity Protect Pro: 安心取引のための総合的な口座保護エキスパート 口座保護、資産保護、ポートフォリオ保護、マルチ戦略保護、利益保護、利益確定、取引セキュリティ、リスク管理プログラム、自動リスク管理、自動決済、条件付き決済、スケジュール決済、動的決済、トレーリングストップロス、ワンクリッククローズ、ワンクリック決済、ワンクリック復元などの機能をお探しなら、Equity Protect Pro が最適なプログラムです。 設定は簡単で、事前設定された条件に達すると、すべてのチャートを閉じることができ、シグナルサブスクリプションのキャンセルもサポートします(これは、すべての取引プログラムも停止することを意味します)。この時点で、新しい注文は生成されなくなり、最終的にすべての注文が閉じられ、予期せぬ損失を効果的に防止し、安心して取引できるようになります。 Equity Protect Pro (Technical Manual) Equity Protect Pro Demo Version for yo u to test   Equity Protect Pro MT4
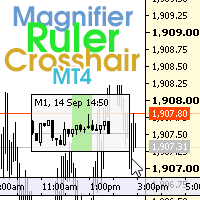
The indicator has three main tools: Magnifier (Zoom chart), Ruler  ( Time and Price scales ),   and Crosshair. You can move it all around with your mouse and customize different formats for  displaying , customize   size and color of each element. The Magnifier (zoom chart) allows you to display candles from any time frame and at different scales. Hotkeys: 'Q' - higher timeframe, 'A' - lower timeframe, 'W' - decrease candle size, 'S' - increase candle size, 'Z' - show/hide zoom chart You can
Automatic Trailing Stop Based on Take Profit Percentage with Profit Lock EA MT4   Lock in your profits and "let your winners run" past your 100% take profit target with this EA.  This Expert Advisor automatically adjusts your Stop Loss based on up to 4 user-defined Take Profit Target Percentages, locking in your profit.  If price pushes past your 100% take profit target, the EA will automatically trail the price by user-defined pips, so you won't miss that runaway train again.   EA Features The
Exit Manager
Victor Christiaanse
5 (2)
Close every trade at the right moment, automatically. Most traders spend their energy on the entry and then close too early, too late, or on a feeling. Exit Manager takes the exit off your hands. Open a trade the way you always do, by hand or with any Expert Advisor, and Exit Manager watches it and closes it, fully or partly, when the indicator signal you chose appears. You can see it working on the chart. A clean panel on your chart shows, for every open trade, which rule will close it next, ho
作者のその他のプロダクト
Traders need clear, volatility-adjusted reference levels across multiple timeframes without cluttering the chart with separate indicators or constant manual calculations. This indicator provides a single visual grid system that shows ATR-derived spacing from a chosen anchor (current open candle or last closed candle). This supports grid trading, mean-reversion setups, range identification, and multi-timeframe confluence analysis. The optional State 3 mode adds a time-based 12-hour cycle (AM/PM s
FREE
Lock multi-timeframe ATR grids to any candlestick you click. This gives a clear visual of volatility-based levels (from M1 through MN1) relative to a specific bar instead of always floating with the current price. Benefits Instant multi-TF ATR view locked to a chosen candle Color-coded grids (yellow fade) so each timeframe is easy to distinguish Optional side legend and pips labels for quick reading Fallback modes (open/closed candle or 12-hour cycle) when nothing is selected Clean, non-cluttere
FREE
is a native chart-management script. When run on a chart, it opens separate charts for the same symbol at the enabled timeframes, from M1 through MN1. By default, it opens M15, M30, H1, H4, and D1. You can enable or disable each supported timeframe to create a workspace suited to your analysis. Key Benefits One-Click Multi-Timeframe Access: Open all selected timeframes without manually creating each chart. Flexible Configuration: Enable or disable individual timeframes from M1 to MN1. Cleaner Wo
FREE
is a native chart-management script. When run on a chart, it opens separate charts for the same symbol at the enabled timeframes, from M1 through MN1. By default, it opens M15, M30, H1, H4, and D1. You can enable or disable each supported timeframe to create a workspace suited to your analysis. Key Benefits One-Click Multi-Timeframe Access: Open all selected timeframes without manually creating each chart. Flexible Configuration: Enable or disable individual timeframes from M1 to MN1. Cleaner W
FREE
Synchronizes all open charts to the symbol of the chart this indicator is applied to. SyncAllCharts is a MetaTrader 5 indicator that lets one main chart control the trading symbol shown on all other open charts. Change the symbol on the main chart, and the other charts follow while keeping their own timeframes. It helps you review the same market across several timeframes without changing each chart manually. How to use it Attach the indicator to one chart that you want to use as the main contr
FREE
A Market Watch multi-timeframe ATR dashboard that turns a chart into a full-screen table showing each selected symbol’s recent volatility across multiple timeframes. It calculates ATR for the symbols visible in Market Watch, then displays the result in pips, points, or raw price units. Its practical use is volatility scanning, quickly finding instruments and timeframes that are moving enough—or quietly enough—for your trading style.                                Period that is worth using Sty
FREE
gives you the power to close every open chart window at once — no matter the symbol, timeframe, number of indicators, Expert Advisors, or objects on them. When you attach it, a confirmation dialog appears. Only after you explicitly grant permission does the script shut down all charts, leaving you on the clean gray screen with Market Watch still fully available. From there you can rebuild your layout from scratch exactly the way you want it. Ideal for: Quickly clearing a cluttered multi-chart wo
FREE
designed to help traders monitor the long and short swap rates of available trading instruments through a clear, organized on-chart table. Its primary purpose is to make overnight financing costs and potential swap credits easier to observe across multiple symbols without repeatedly opening individual instrument specifications. By presenting swap information in a centralized display, the application helps traders incorporate holding costs into their market analysis and trade planning. Key Benef
FREE
Automatically cycles through every symbol in your Market Watch at a user-defined interval, letting you scan multiple pairs hands-free without manually changing charts. Benefits Hands-free multi-pair scanning with adjustable speed and optional reverse direction Reliable play/pause button that stays on-chart and can be placed in any corner with custom colors Optional large centered Symbol + Timeframe labels (stacked, with adjustable spacing) that can sit behind or in front of price Remembers its p
FREE
This indicator builds a live correlation matrix from the symbols currently selected in Market Watch . It calculates Pearson correlation on simple returns over a user-defined lookback and displays the results in a clean, auto-sized grid. Positive correlations appear in green, negative in red, and near-zero values stay neutral. An optional automatic timeframe scanner cycles through only the timeframes you enable (M1, M5, M15, M30, H1, H4, D1, W1, MN1), updating the entire matrix at a set interval.
FREE
motive is to turn market volatility and selected time/session reference points into a visual price grid . Instead of claiming to predict price direction, it gives the trader a structured way to judge where current price sits relative to ATR-derived or fixed-distance ranges. Potential Volatility awareness: ATR-based spacing expands and contracts with measured price volatility. Price-range context: Multiple grid levels show how far price has traveled from a reference point. Session analysis: The f
FREE
This EA gives traders a clean, full-window view of how large a position each Market Watch symbol can support at different percentages of account balance used as margin. It helps you quickly compare sizing options across symbols and risk levels without ever placing or modifying orders. The goal is simple position-size awareness so you can decide exposure before you trade. Benefits Shows lot size potential across Market Watch symbols at up to three different % of balance margin levels side-by-sid
FREE
is a multi-timeframe visual matrix that tracks the relative linear progression (log-return strength) of the eight major currencies — EUR, GBP, AUD, NZD, USD, CAD, CHF, and JPY — across selected timeframes in a single responsive panel. Motive Traders often struggle to quickly see which currencies are gaining or losing strength relative to one another across multiple timeframes. This indicator condenses that information into color-coded progression lines so you can immediately identify strong vers
FREE
This EA gives traders a clean, full-window view of how large a position each Market Watch symbol can support at different percentages of account balance used as margin. It helps you quickly compare sizing options across symbols and risk levels without ever placing or modifying orders. The goal is simple position-size awareness so you can decide exposure before you trade. Benefits Shows lot size potential across Market Watch symbols at up to three different % of balance margin levels side-by-sid
FREE
is a visual market-monitoring indicator that displays multiple trading instruments and timeframes within a single chart window. Developed using MQL5, the indicator transforms historical price data into a structured dashboard featuring custom candlesticks or price dots. Each row represents a symbol, while each column represents a selected timeframe. This arrangement allows traders to examine recent market behavior across several instruments and timeframes without continually opening and closing c
FREE
ボラティリティに適応し、取引ポジションに報酬を与えるための潜在的なリスクは、平均真の範囲に基づいて示されています。 "購入または売却"ボタンをクリックすると、リスク-報酬-ボックスが表示されます! ATR計算の有用性は、取引を終了するときのためのハードな決定の一部ではない問題で喜ぶ。 この問題は、あなたのリスク管理の決定を支援します。  仕様 平均真の範囲は、ピップまたは価格で市場のボラティリティを測定する一般的に使用される指標です。 真の範囲は、任意の期間におけるローソク足の最低取引価格と最高取引価格との差です。 平均真の範囲は、すべてで、日の"前の"期間のこれらの高値と安値を平均します。 例では、ATRインジケータのデフォルト設定は、私たちに14日間の期間を与えます。 ATRは、14日で割って、ピップ値で高値と安値を収集します。 しかし、もちろん、これは一般的な指標、ATRを超えています。 実際には、3つの全く異なるTPsは、異なるピップ消費のために独自の時間枠にのみ依存しています。 ローソク足のルールは、各時間枠で技術的に異なります。 したがって、同じ期間を使用すると、時間枠
FREE
The SymbolicTimeFramingUniverse indicator for MetaTrader 4 (MT4) is designed to enhance chart navigation by displaying the current symbol and timeframe as stacked labels directly on the chart window. It provides precise alignment and customization options, including positioning in the center or corners, adjustable offsets, font styling, and layer controls for visibility (such as background placement or color flashing). This tool supports professional trading workflows by ensuring quick identific
FREE
A versatile on-chart tool displaying real-time ATR values across up to 10 timeframes (M1 to MN1) in numerical format, bypassing subwindow charts for cleaner analysis. Key features: Toggle per-timeframe visibility, decimal/pips mode, customizable multiplier (e.g., for scaled stops), font/size/color adjustments, and corner/center positioning. Ideal for volatility-based trading—compute position sizes or filters instantly without manual math. Free download; compatible with MT4 Build 600+. Enhances m

FREE
is designed to simplify switching between trading instruments directly from the active chart. It allows traders to cycle through symbols listed in the broker's Market Watch using on-chart navigation buttons or keyboard arrow keys . The indicator's primary motive is to make multi-symbol market analysis faster, more convenient, and more organized by reducing the need to manually locate and open individual charts. Key Features Previous / Next Navigation: Switch between Market Watch symbols using t
FREE
Automated Timeframe cycling with Symbols centered.  Force every timeframe onto one clock window, so the story you see on Daily is the same story you are slicing on H4, H1, and M1.  Traders usually flip timeframes and lose the span. A Daily chart shows a few weeks, then M15 shows a few hours, and the eye treats them as different markets. This indicator locks the window to N bars of the highest enabled timeframe — default 10 Daily — and maps every lower timeframe to that same stretch. You stay ins
FREE
Displays broker-provided LONG and SHORT swap values for selected instruments in a full-chart, dynamically sized table. The Swaps Monitor Table provides a simple way to view the swap rates supplied by your broker for multiple trading instruments at once. The table can display instruments from Market Watch, all available instruments, or a manually selected list , allowing traders to monitor swap costs without opening each symbol individually. The indicator automatically adjusts the table cells an
FREE
Quote Cost Parity is  a MetaTrader 5 chart panel for forex majors and minors that share a quote currency. Pairs with the same quote have the same pip cost for a given lot. The indicator uses that correspondence directly: it calculates the cost once for the group, then shows that cost for three lot sizes. It acknowledges only these quote groups. JPY: USDJPY, EURJPY, GBPJPY, AUDJPY, NZDJPY, CADJPY, CHFJPY. Source : USDJPY. CHF: USDCHF, EURCHF, GBPCHF, AUDCHF, NZDCHF, CADCHF. Source : USDCHF. CAD:
FREE
visual trade planner for MetaTrader 5. It draws multi-timeframe ATR reward and stop zones on the chart so you can judge distance and payoff before you place the trade yourself. It does not send, modify, or close orders. Motive A single ATR on the chart timeframe often hides the larger and smaller ranges a trade is actually working against. This EA stacks three take-profit slices, each from its own timeframe, period, and multiplier, then places an ATR stop and an optional fixed stop beside them.
FREE
is designed to enhance the visual representation of financial charts in MetaTrader 4 by dynamically altering the colors of various chart elements, including candlesticks, bars, line charts, and volume bars. Its primary purpose is to improve trader intuition and engagement during market analysis by introducing smooth, cyclical color transitions that can highlight momentum shifts, trends, or volatility without overwhelming the display. This functionality is particularly beneficial for traders who
FREE
is a panel that groups FX Major & Minor quote currencies and shows the shared pip or point cost of a trade. View that cost for three fixed lot sizes or three account-balance risk percentages. Currency Cost Constellation is a MetaTrader 4 chart panel for forex majors and minors that share a quote currency. Pairs with the same quote have the same pip cost for a given lot. The indicator uses that correspondence directly: it calculates the cost once for the group, then shows that cost for three lo
FREE
is a multi-timeframe visual matrix that tracks the relative linear progression (log-return strength) of the eight major currencies — EUR, GBP, AUD, NZD, USD, CAD, CHF, and JPY — across selected timeframes in a single responsive panel. Motive Traders often struggle to quickly see which currencies are gaining or losing strength relative to one another across multiple timeframes. This indicator condenses that information into color-coded progression lines so you can immediately identify strong vers
FREE
is a user-friendly MetaTrader 4 indicator that creates a centralized dashboard for traders to oversee market symbols simultaneously across different timeframes, presenting price movements through simple dots or miniature candlestick charts, complemented by volume indicators to facilitate quick assessments of market trends and fluctuations. It automatically resizes grid cells according to the number of bars shown per timeframe for better use of screen space, features adjustable color schemes fo
FREE
A Market Watch multi-timeframe ATR dashboard that turns a chart into a full-screen table showing each selected symbol’s recent volatility across multiple timeframes. It calculates ATR for the symbols visible in Market Watch, then displays the result in pips, points, or raw price units. Its practical use is volatility scanning, quickly finding instruments and timeframes that are moving enough—or quietly enough—for your trading style.                                Period that is worth using Sty
FREE
is an exit manager for trades you open yourself. It does not open positions and it does not send signals. After a manual buy or sell, it gives that trade a stop and up to six exit stages based on volatility. Three stages come from Average True Range, each with its own timeframe. Three come from completed range: daily (ADR), weekly (AWR), and monthly (AMR). Each stage can be switched on or off. Enabled stages are sorted by distance. Nearer stages trail the stop. The furthest is posted as the take
FREE
Automated Timeframe cycling with Symbols centered.  Force every timeframe onto one clock window, so the story you see on Daily is the same story you are slicing on H4, H1, and M1.  Traders usually flip timeframes and lose the span. A Daily chart shows a few weeks, then M15 shows a few hours, and the eye treats them as different markets. This indicator locks the window to N bars of the highest enabled timeframe — default 10 Daily — and maps every lower timeframe to that same stretch. You stay ins
FREE
フィルタ:
レビューなし
レビューに返信