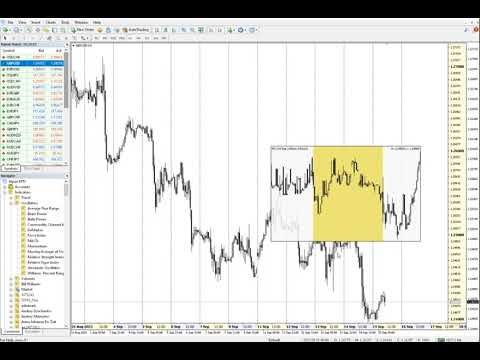
Magnifier Ruler Crosshair
- ユーティリティ
- バージョン: 3.20
- アップデート済み: 28 4月 2025
- アクティベーション: 20

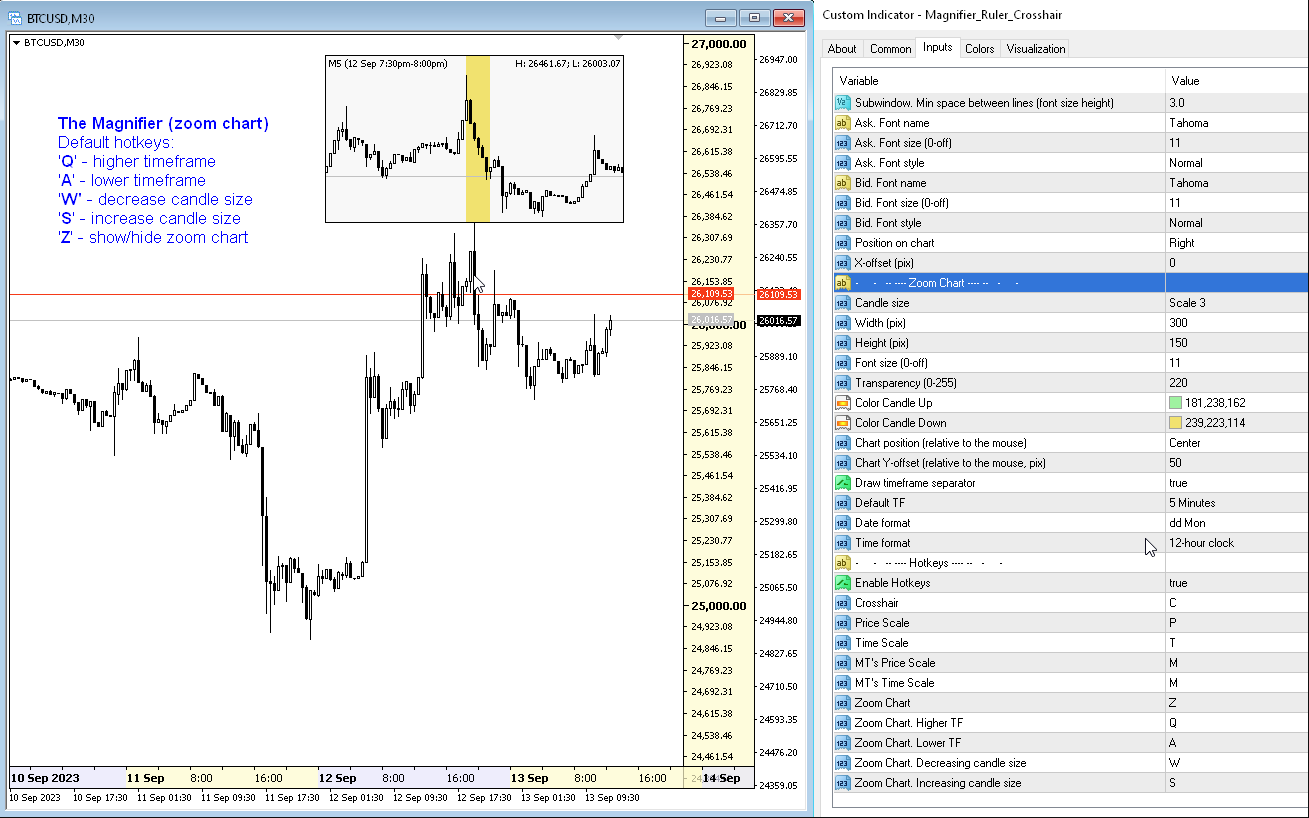
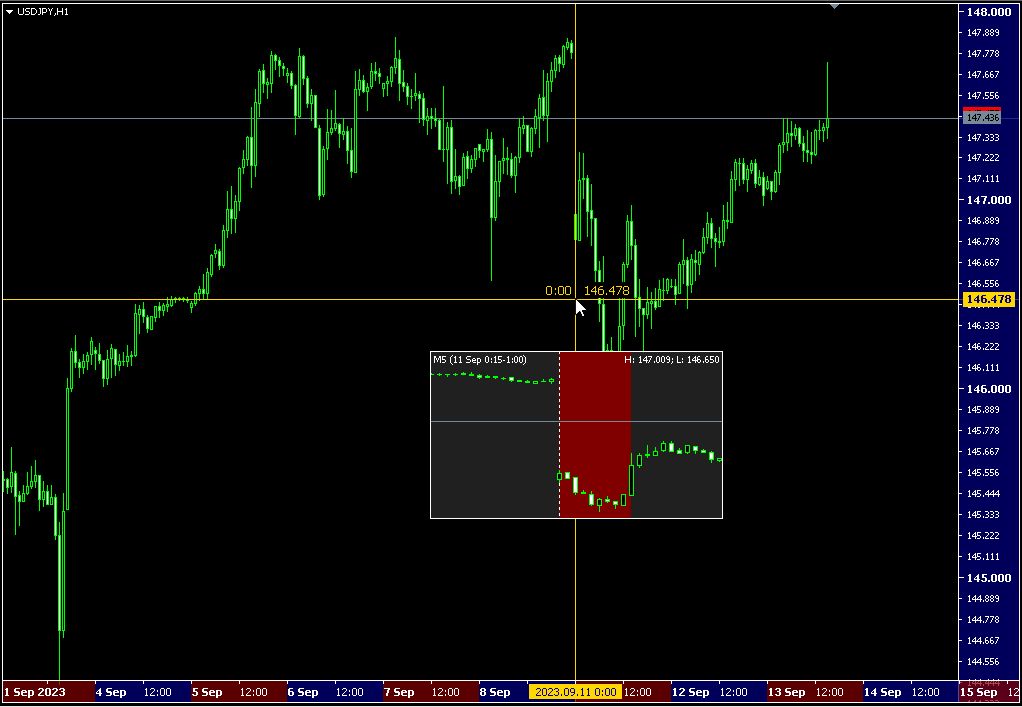
The Magnifier (zoom chart) allows you to display candles from any time frame and at different scales.
Hotkeys: 'Q' - higher timeframe, 'A' - lower timeframe, 'W' - decrease candle size, 'S' - increase candle size, 'Z' - show/hide zoom chart
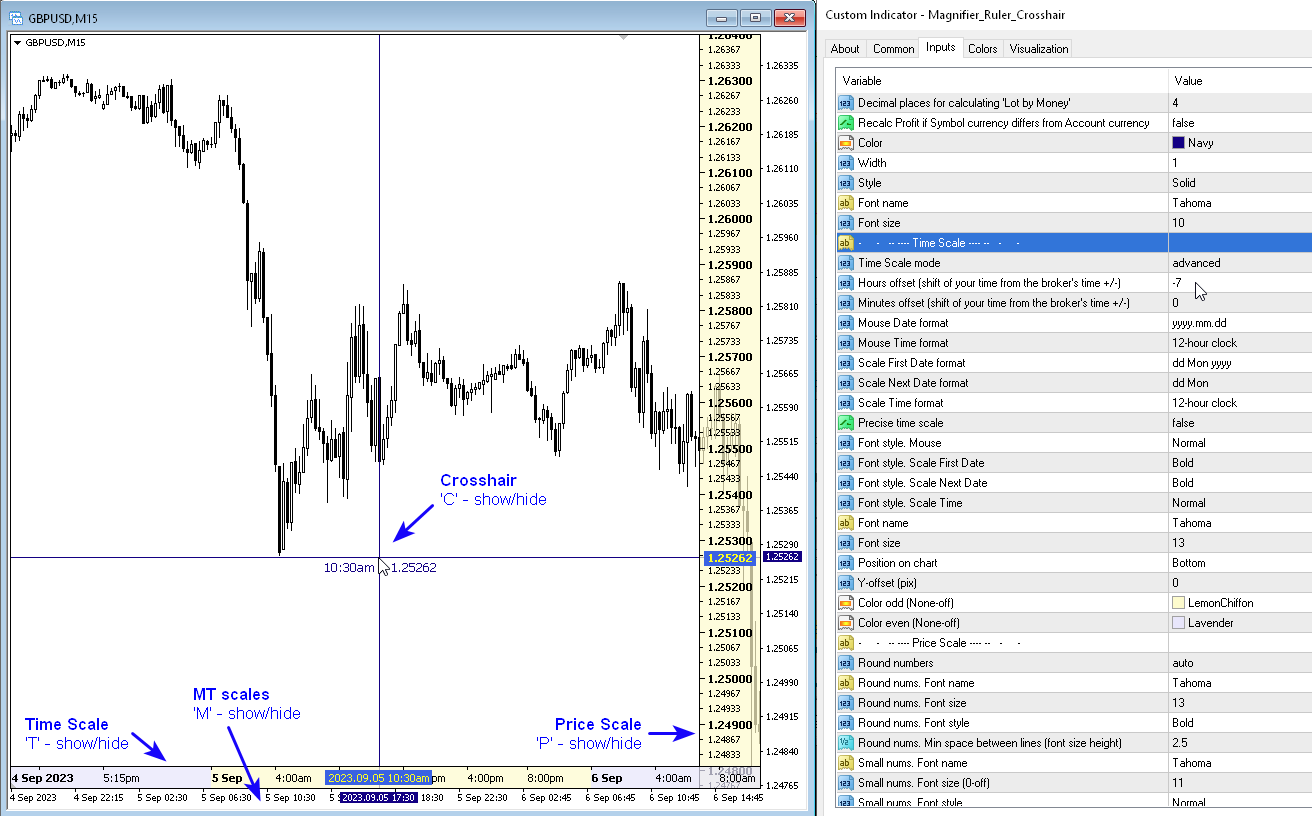
Hotkey 'T' - show/hide the Time Scale.
Hotkey 'P' - show/hide the Price Scale.
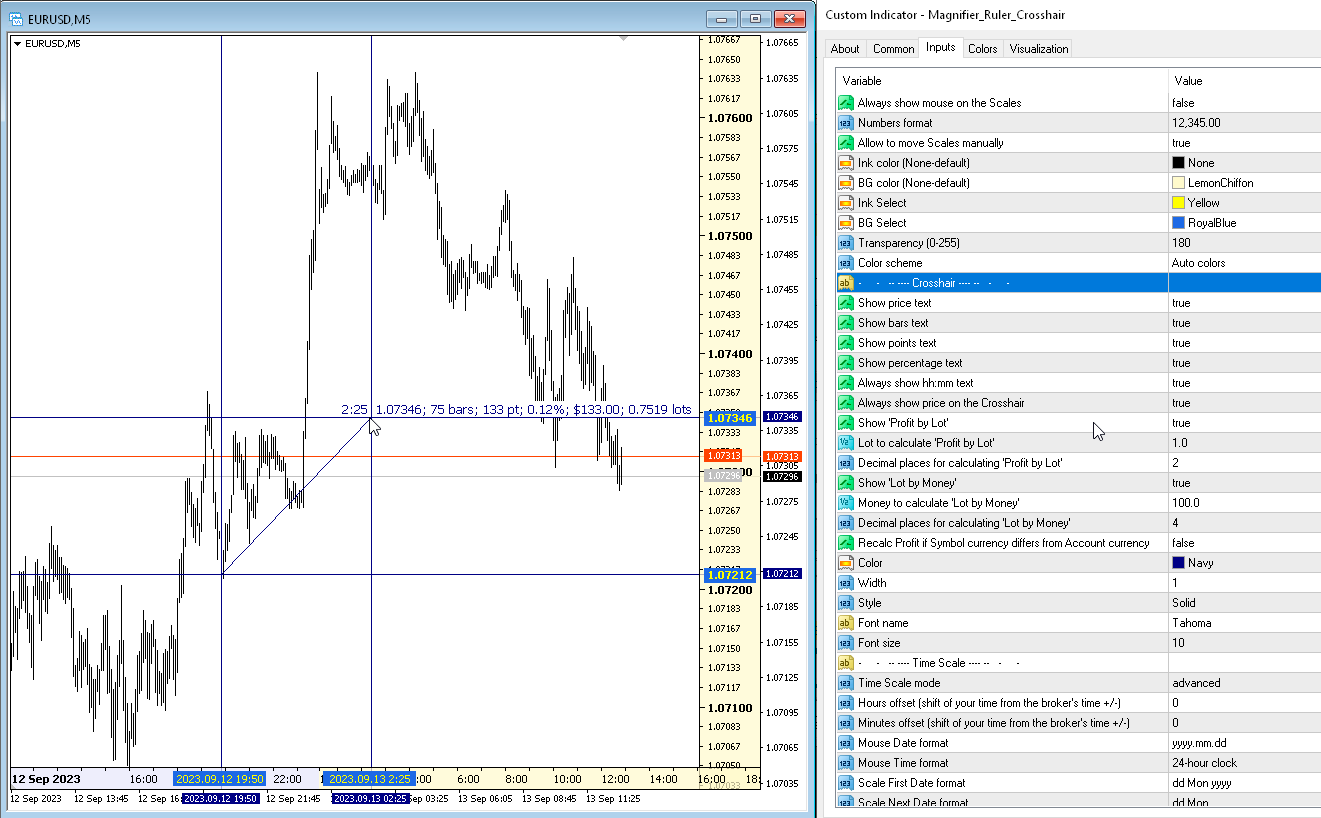
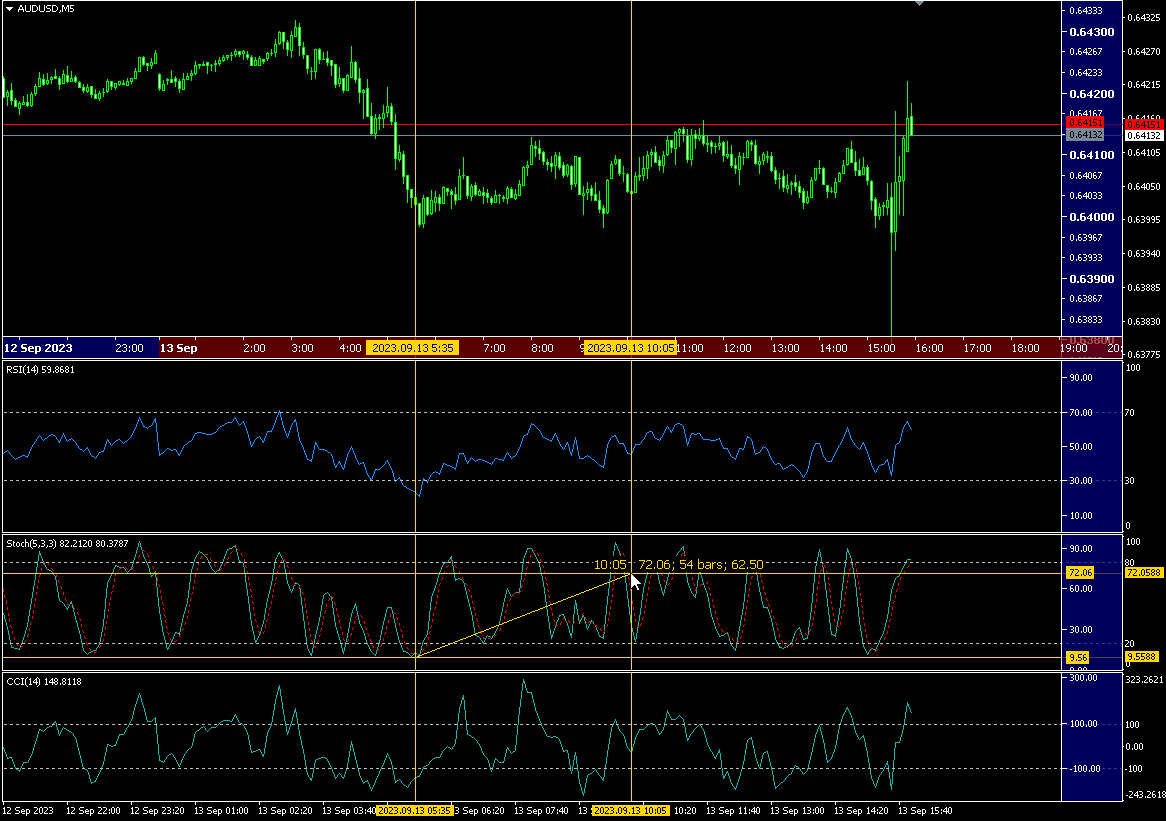
Hotkey 'C' - show/hide the Crosshair.
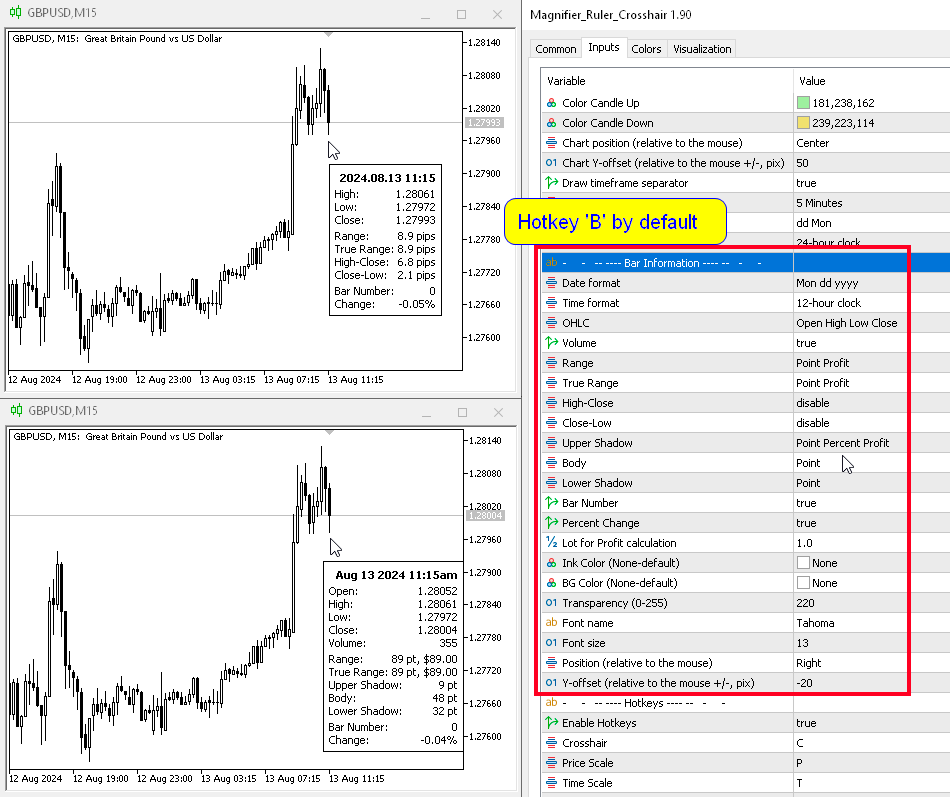
The Bar Information is the tooltip showing information about a candle (show candle Info). In addition to the standard OHLC, you can choose the time format, see the size of the candle body and shadows (in points, percentages and money), and the percentage change in price. And the True Range of the bar.
Hotkey 'B' by default.
To disable/enable standard MT scales, the hotkey 'M' is specified.
Parameters
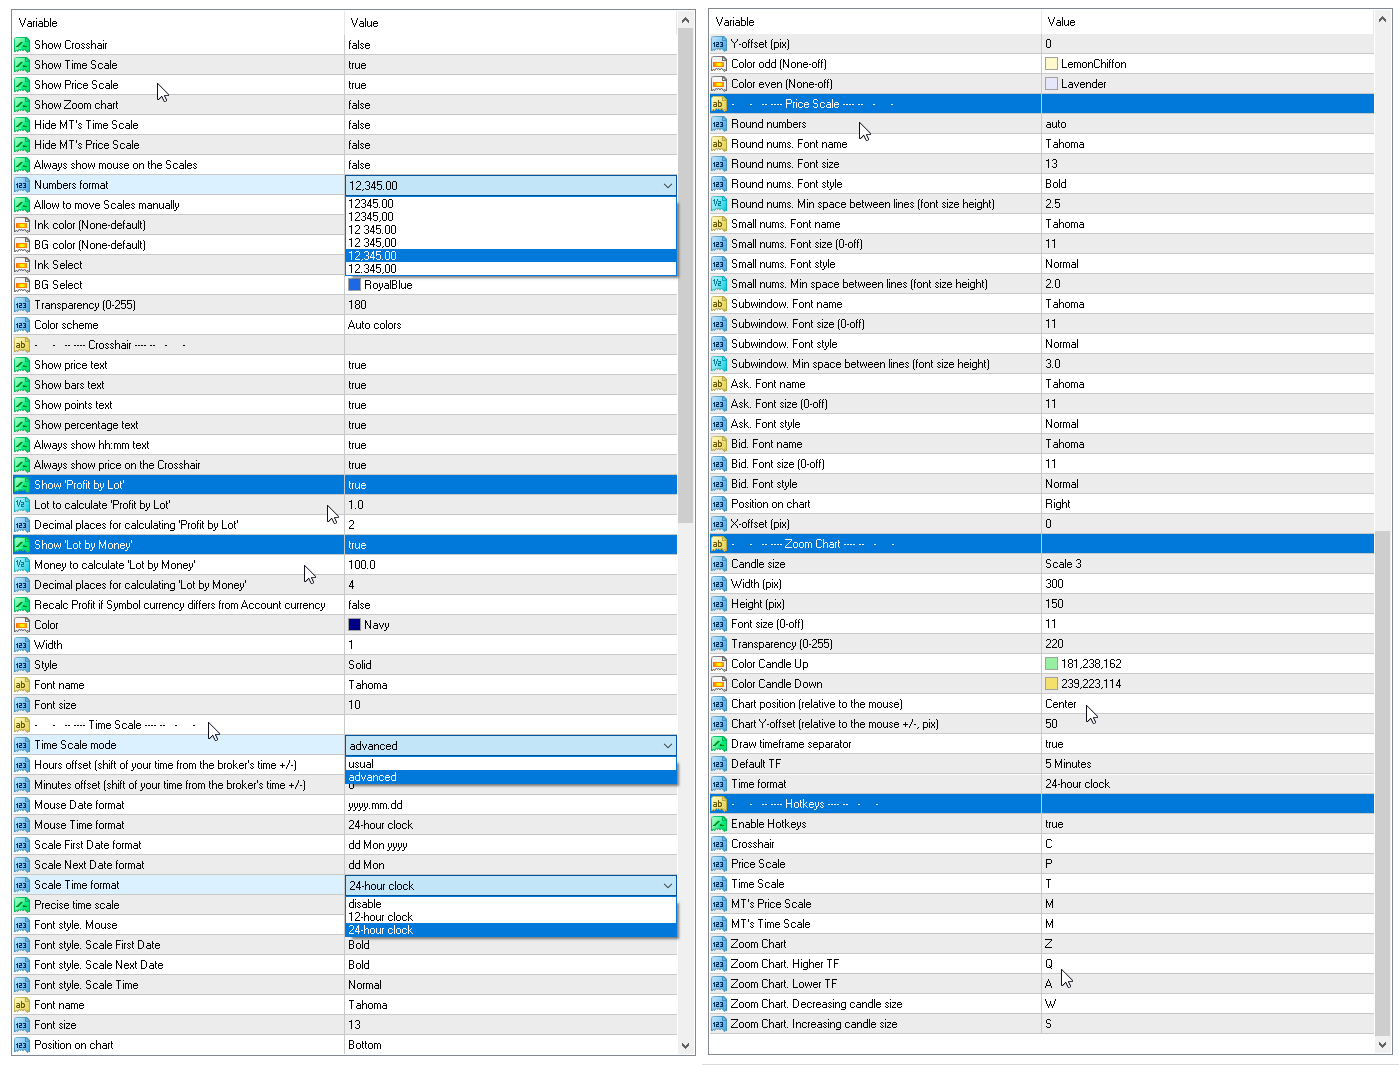
Show Crosshair
Show Time Scale
Show Price Scale
Show Zoom chart
Hide MT's Time Scale
Hide MT's Price Scale
Hide MT's Crosshair
Always show mouse on the Scales
Numbers format:
- 12345.00
- 12345,00
- 12 345.00
- 12 345,00
- 12,345.00
- 12.345,00
Allow to move Scales manually
Ink color (None-default)
BG color (None-default)
Ink Select
BG Select
Transparency (0-255)
Color scheme
- - -- ---- Crosshair ---- -- - -
Show price text
Show bars text
Show points text
Show percentage text
Show Volume text
Always show hh:mm text
Always show price on the Crosshair
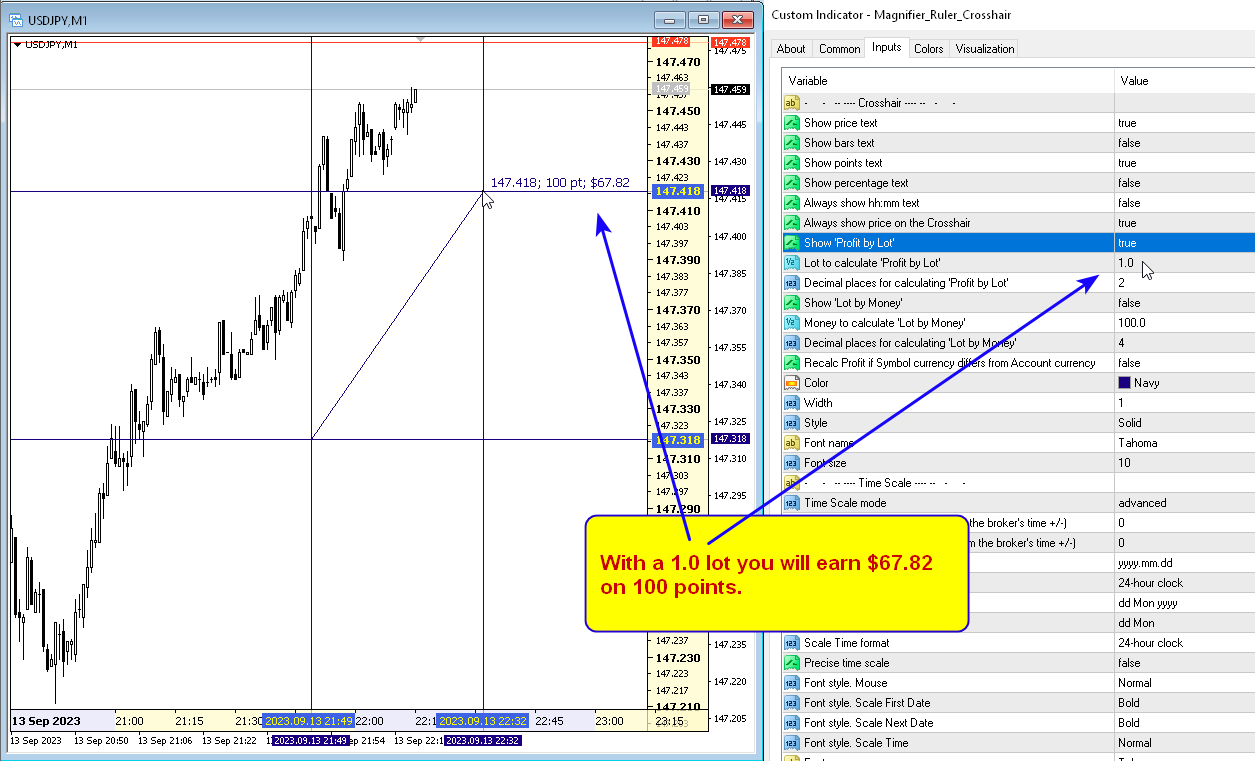
Show 'Profit by Lot' - this parameter will calculate profit according to the specified lot value.
Lot to calculate 'Profit by Lot'
Decimal places for calculating 'Profit by Lot'
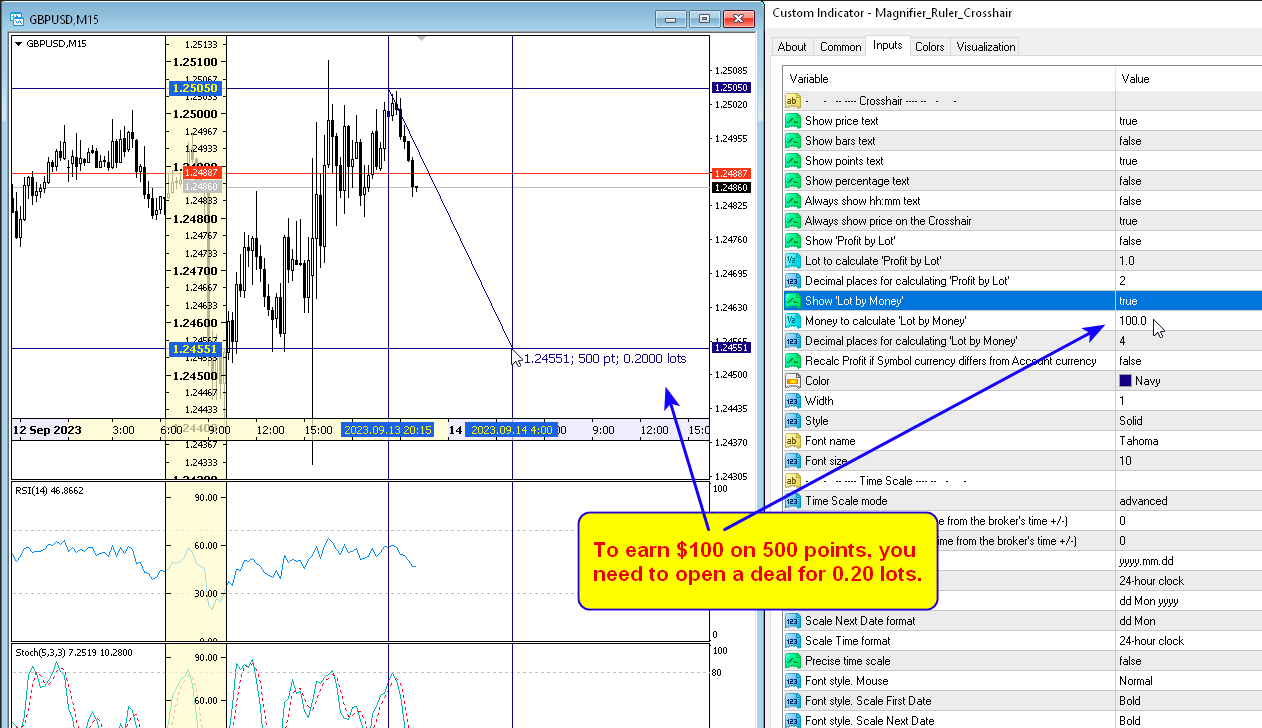
Show 'Lot by Money' - this parameter will calculate the lot size required to earn a given amount of money.
Money to calculate 'Lot by Money'
Decimal places for calculating 'Lot by Money'
Recalc Profit if Symbol currency differs from Account currency
Color
Width
Style
Font name
Font size
- - -- ---- Time Scale ---- -- - -
Time Scale mode:
- usual
- advanced
Hours offset (shift of your time from the broker's time +/-)
Minutes offset (shift of your time from the broker's time +/-)
Mouse Date format:
- disable
- dd Mon
- Mon dd
- dd Mon yyyy
- Mon dd yyyy
- yyyy.mm.dd
- yyyy.dd.mm
- yyyy
Mouse Time format:
- disable
- 12-hour clock
- 24-hour clock
Scale First Date format
Scale Next Date format
Scale Time format
Precise time scale
Use a fixed scale to adjust the height of the candles
Font style. Mouse
Font style. Scale First Date
Font style. Scale Next Date
Font style. Scale Time
Font name
Font size
Position on chart
Y-offset (pix)
Color odd (None-off)
Color even (None-off)
- - -- ---- Price Scale ---- -- - -
Show Ask.
Show Bid.
Round numbers - rounding of price values on the scale, auto or a given value.
Round nums. Font name
Round nums. Font size
Round nums. Font style
Round nums. Min space between lines (font size height)
Small nums. Font name
Small nums. Font size (0-off)
Small nums. Font style
Small nums. Min space between lines (font size height)
Subwindow. Font name
Subwindow. Font size (0-off)
Subwindow. Font style
Subwindow. Min space between lines (font size height)
Ask. Font name
Ask. Font size (0-off)
Ask. Font style
Bid. Font name
Bid. Font size (0-off)
Bid. Font style
Position on chart
X-offset (pix)
- - -- ---- Zoom Chart ---- -- - -
Candle size
Width (pix)
Height (pix)
Font size (0-off)
Transparency (0-255)
Color Candle Up
Color Candle Down
Chart position (relative to the mouse)
Chart Y-offset (relative to the mouse +/-, pix)
Draw timeframe separator
Default TF
Date format
Time format
- - -- ---- Bar Information ---- -- - -
Date format
Time format
OHLC
Volume
Range
True Range
High-Close
Close-Low
Upper Shadow
Body
Lower Shadow
Bar Number
Percent Change
Lot for Profit calculation
Ink Color (None-default)
BG Color (None-default)
Transparency (0-255)
Font name
Font size
Position (relative to the mouse)
Y-offset (relative to the mouse +/-, pix)
- - -- ---- Hotkeys ---- -- - -
Enable Hotkeys of the indicator.
Crosshair - default 'C'.
Price Scale - default 'P'.
Time Scale - default 'T'.
MT's Price Scale - default 'M'.
MT's Time Scale - default 'M'.
Zoom Chart - default 'Z'.
Zoom Chart. Higher TF - default 'Q'.
Zoom Chart. Lower TF - default 'A'.
Zoom Chart. Decreasing candle size - default 'W'.
Zoom Chart. Increasing candle size - default 'S'.
Bar Information - default 'B'.
I have to agree with both the comments below as this is very well done. Thank you.