Currency Progression Meter

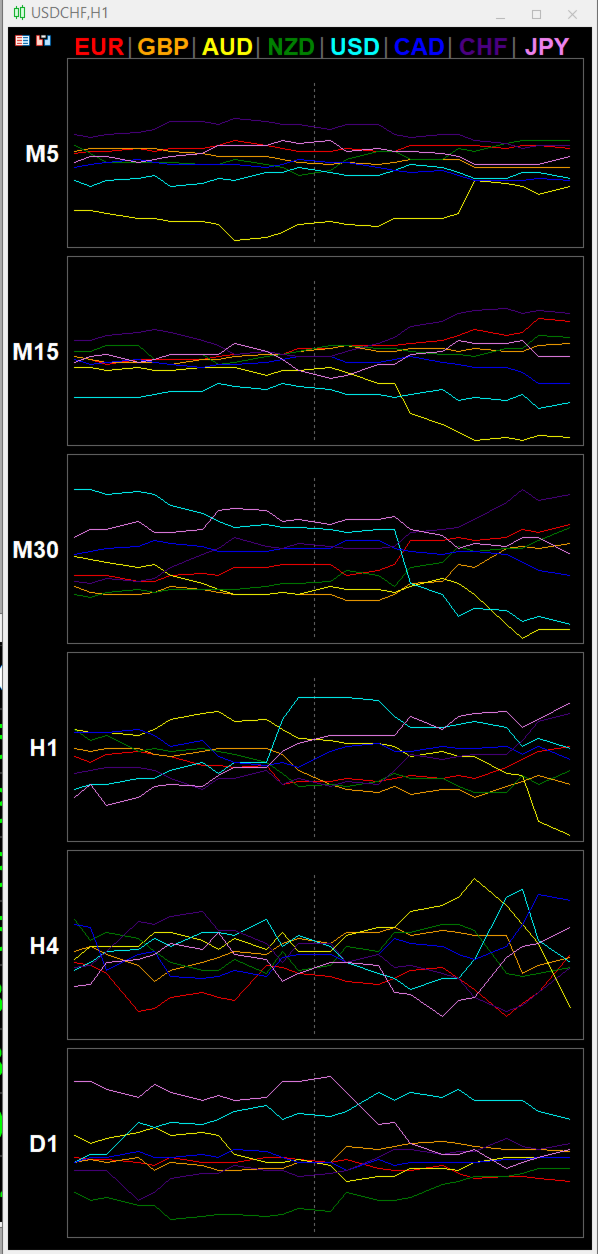
is a multi-timeframe visual matrix that tracks the relative linear progression (log-return strength) of the eight major currencies — EUR, GBP, AUD, NZD, USD, CAD, CHF, and JPY — across selected timeframes in a single responsive panel.

Motive

Traders often struggle to quickly see which currencies are gaining or losing strength relative to one another across multiple timeframes. This indicator condenses that information into color-coded progression lines so you can immediately identify strong versus weak currencies and align your pair selection and direction with the dominant force.

Functionality

For every enabled timeframe the indicator:

  • Scans available broker symbols for every unique pair combination among the eight currencies (direct or inverse).
  • Calculates the logarithmic return of each pair over the defined lookback period (LinearLookback).
  • Assigns the movement positively to the base currency and negatively to the quote currency.
  • Averages the results and centers them so the eight currencies sum to approximately zero.
  • Plots the last LinePoints values of each currency as a continuous colored line inside its timeframe cell.

A vertical zero line marks the neutral point. Currencies above zero are relatively strong; currencies below zero are relatively weak. The classic rule of thumb is: buy the strong currency against the weak currency.

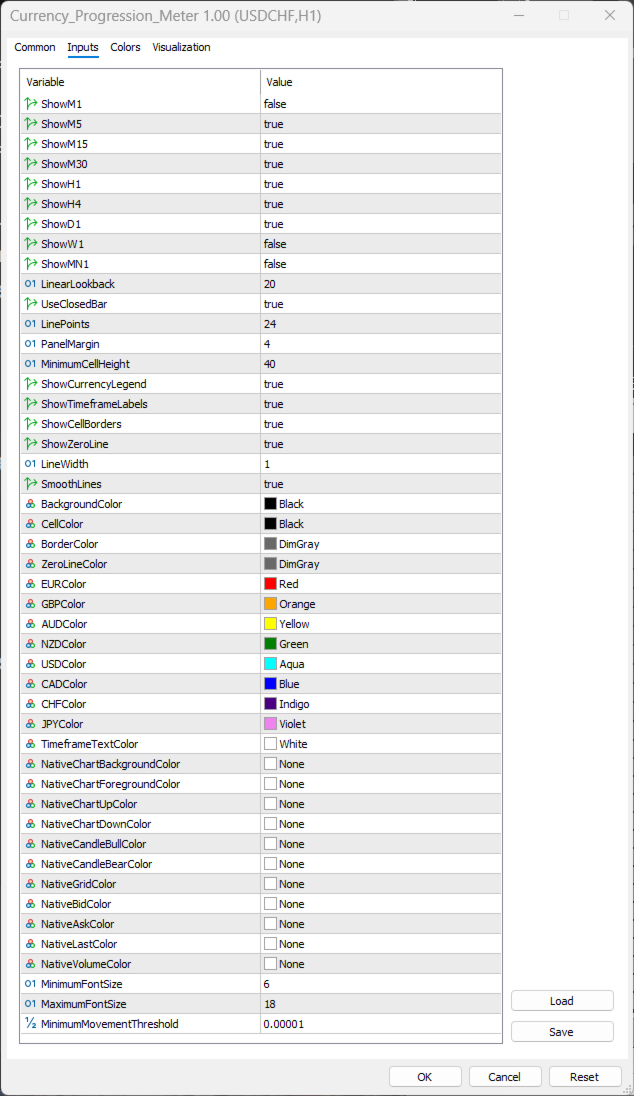
The panel is fully responsive. Cell height, font size, and spacing automatically adapt to chart size. You can toggle individual timeframes, the currency legend, timeframe labels, cell borders, and the zero line. Native chart elements are suppressed so the matrix occupies the full chart area cleanly.

Benefits for the Trader

  • Instant multi-timeframe currency strength overview without switching charts or using multiple indicators.
  • Clear visual separation of strong and weak currencies helps filter high-probability pair combinations.
  • Historical progression lines show whether strength is accelerating, decelerating, or reversing.
  • Customizable colors, line width, and visual elements make the display easy to read under different lighting and monitor setups.
  • Lightweight object-based drawing that updates only when data or chart dimensions change.

Limitations

  • Accuracy depends on the broker offering a sufficient number of the cross pairs. Missing symbols reduce the number of inputs used for that currency.
  • The calculation is a relative linear progression over a fixed lookback, not a volume-weighted or session-based strength index.
  • On very low timeframes (M1/M5) with a large number of line points and many enabled timeframes, object count rises and redraws can become heavier.
  • The indicator is designed for the eight listed currencies only; exotic or emerging-market currencies are not included.
  • Results are sensitive to the chosen lookback length and whether closed or forming bars are used.

Recommended Use

Enable the timeframes you actively trade, set LinearLookback to match your style (shorter for scalping, longer for swing), and watch for alignment: a currency that is positive and rising on several higher timeframes while its counterpart is negative and falling offers a higher-probability directional bias.

The indicator is intended as a decision-support tool. Always confirm signals with price action, structure, and your own risk rules.
おすすめのプロダクト
Apex Point is a trend-following indicator for MetaTrader 5, transforming complex market data into signals for traders. It displays blue dots for uptrends, red dots for downtrends, and yellow crosses at potential reversals, helping users identify momentum shifts quickly. Key features include a confirmation system requiring multiple bars (default: 3) to validate changes, reducing false signals; dynamic ATR-based offsets for adaptive trailing, with instant ratcheting in the trend direction and smo
FREE
Gold Venamax - これは最高の株式テクニカル指標です。 指標アルゴリズムは資産の価格変動を分析し、ボラティリティと潜在的なエントリーゾーンを反映します。 インジケーターの機能: これは、快適で収益性の高い取引のためのマジックとトレンド矢印の 2 つのブロックを備えたスーパー インジケーターです。 チャート上にブロックを切り替えるための赤いボタンが表示されます。 マジックはインジケーター設定で設定されているため、異なるブロックを表示する 2 つのチャートにインジケーターをインストールできます。 Gold Venamax は、異なる矢印バッファー (GV と SD) を備えた 2 つのチャートに配置できます。 これを行うには、設定で異なる Magic を選択する必要があります。たとえば、あるマジック = 999、別のマジック = 666 を選択します。次に、チャート上の赤いボタンで矢印バッファを選択できます。 インジケーター設定の各矢印バッファー (GV および SD) には、快適で収益性の高い取引のための個別の矢印フィルターがあります (UseFiltrGV = true;
MarketPro toolkit
Johannes Hermanus Cilliers
Start earning profits by copying All trades are sent by our successful Forex trader & are extremely profitable. You can earn profits by copying trades daily Trial Period included You'll also get access to extremely powerful trading education which is designed in a simple way for you to become a profitable trader, even if you have no trading experience. https://ec137gsj1wp5tp7dbjkdkxfr4x.hop.clickbank.net/?cbpage=vip
FREE
インディケータは現在のクオートを作成し、これを過去のものと比較して、これに基づいて価格変動予測を行います。インジケータには、目的の日付にすばやく移動するためのテキスト フィールドがあります。 オプション: シンボル - インジケーターが表示するシンボルの選択; SymbolPeriod - 指標がデータを取る期間の選択; IndicatorColor - インジケータの色; HorisontalShift - 指定されたバー数だけインディケータによって描画されたクオートのシフト; Inverse - true は引用符を逆にします。false - 元のビュー。 ChartVerticalShiftStep - チャートを垂直方向にシフトします (キーボードの上下矢印)。 次は日付を入力できるテキストフィールドの設定で、「Enter」を押すとすぐにジャンプできます。
Modern Dark Chart Theme for MT5 Upgrade your MetaTrader 5 chart into a clean, dark, professional trading workspace. Your chart is your trading office. It is where you analyze the market, test Expert Advisors, review setups, record videos, share screenshots, and make trading decisions. If your MT5 chart looks old, bright, noisy, or unprofessional, your trading environment can feel distracted before you even start your analysis. Modern Dark Chart Theme for MT5 helps you create a cleaner, darker,
FREE
TrendVision AI
Murtadha Majid Jeyad Al-Khuzaie
TrendVision AI – Smart Trend Channels & Price Forecasting for MetaTrader 5 Discover market structure and explore potential future price direction with TrendVision AI, an advanced technical indicator for MetaTrader 5 that combines automatic trendline analysis with a machine-learning-based price forecasting model. How Does TrendVision AI Work? TrendVision AI analyzes historical candlestick data within a configurable lookback window. It automatically draws two trendlines directly on the chart:
FREE
Price Magnet — Price Density and Attraction Levels Indicator Price Magnet is a professional analytical tool designed to identify key support and resistance levels based on statistical Price Density. The indicator analyzes a specified historical period and detects price levels where the market spent the most time. These zones act as “magnets,” attracting price action or forming a structural base for potential reversals. Unlike traditional Volume Profile tools, Price Magnet focuses on price-time d
GDS Renko Pip ST Chart - Pip-Based Renko Chart Indicator for MetaTrader 5 GDS Renko Pip ST Chart is a pip-based Renko chart indicator for MetaTrader 5. It helps traders build and study cleaner Renko price movement using a practical fixed pip or point-based brick structure. This tool is designed as a Renko chart foundation for manual analysis. It does not predict the market, does not generate buy or sell signals and does not decide whether a trade should be opened. Renko EDGE EA Golden Delta | A
PositionMap Pro — Account Overview Panel for MT5 A real-time panel that groups all open positions by symbol and shows Buy lots, Sell lots and net profit/loss directly on your chart — the whole account at a glance. Instead of counting lots symbol by symbol in the Terminal tab, PositionMap Pro groups everything automatically. You instantly see how much exposure you have on each symbol, split by direction. Panel example Symbol Buy Lot Sell Lot Net P/L EURUSD 0.50 — +12.30 XAUUSD — 1.00 −45.00 GBPUS
FREE
Aroon インジケーター - 完全解説 Aroon インジケーター — 概要と使い方 Aroon(アルーン) インジケーターは、トレンドの強さ、開始タイミング、そして勢いの弱まりを 判定するために開発されたテクニカル指標です。 Aroon Up と Aroon Down の2本のラインで構成されており、 価格が最後に高値または安値をつけてからの経過時間に基づいて計算されます。 Aroon Up が100付近で推移し、 Aroon Down が低い場合、市場は強い上昇トレンドにあります。逆の場合は下降トレンドを示します。 この特徴により、Aroonはトレンドフォロー、ブレイクアウト戦略、スイングトレードに最適な指標です。 Aroon が提供する主なシグナル トレンド転換の早期検出 トレンド強度の確認 レンジ相場・低ボラティリティの識別 トレンドの弱まりを示唆 ブレイクアウト戦略の補助シグナル Darwinex Zero 割引コード Darwinex Zero を始める方のために、 20%割引の特別コード をご用意しました: DWZ2328770MGM_20 登録時または支払い画面で入力
FREE
FibRetrace Zones 直近スイングのフィボナッチ・リトレースメント・ゾーン FibRetrace Zones は FibRetrace EA の無料ビジュアル補助インジケーターです。フィボナッチ・リトレースメント水準を描画し、直近スイングの押し目・戻りゾーンを強調表示するため、取引前にエントリー位置を確認できます。 ゾーンは方向別に色分けされます。強気セットアップは緑、弱気セットアップは赤。あらゆる銘柄・時間足で動作します。 主な機能 ルックバック調整可能な自動スイング検出 古典的フィボナッチ水準(23.6%、38.2%、50%、61.8%、78.6%)、個別に切替可能 色設定可能な押し目ゾーンの強調表示 方向による色分け:緑 = 強気、赤 = 弱気 バー確定で確定表示。形成中バーのリアルタイム更新はオプション 使い方 任意のチャートに適用します。価格が色付きゾーンまで押した位置が、FibRetrace がエントリーを探す場所です。フィボナッチラインを使って手動で指値注文を置くこともできます。 自動化する FibRetrace EA はこの同じゾーンを自動で取引します。1銘
FREE
== LT RAINBOW TREND - 36本の移動平均線を持つトレンドインジケーター == 概要 LT Rainbow Trendは、36本の移動平均線を同時に処理し、スマートなカラーシステム(レインボー)を搭載した先進的なトレンド分析テクニカルインジケーターです。主力のトレンド方向へ最大の視覚的明瞭さをもって取引したいトレーダーのために開発され、マルチタイムフレーム分析の複雑さを、シンプルでカラフル、かつ非常に直感的なビジュアルへと変換します。 「トレンドは友達(The trend is your friend)」であることを理解しているトレーダーに最適です。このインジケーターは、トレンドの強さ、方向、そして潜在的な反転を常に事前に見極めることを可能にします。 仕組み インジケーターは、4つのトレンドゾーンに分散された36本の移動平均線を監視します: 赤(トレンド転換ゾーン) 31〜20番目の移動平均線 トレンドが反転する可能性を示す強いサイン オレンジ(トレンド減速ゾーン) 19〜10番目の移動平均線 トレンドの勢いが失われつつあるが、継続の可能性もあるサ
概要 このインジケーターは、クラシックな ドンチャンチャネル を強化したバージョンで、実践的なトレード機能を追加しています。 標準の3本線(上限、下限、中央線)に加え、 ブレイクアウト を検出し、チャート上に矢印で視覚的に表示します。また、チャートを見やすくするために、 現在のトレンド方向と逆側のラインのみを表示 します。 インジケーターの機能: 視覚的シグナル :ブレイクアウト時にカラフルな矢印を表示 自動通知 :ポップアップ、プッシュ通知、Eメール RSIフィルター :市場の相対的な強弱に基づいてシグナルを検証 カスタマイズ可能 :色、ラインの太さ、矢印コード、RSI閾値など 動作原理 ドンチャンチャネルは次のように計算します: 上限線 :直近N本のクローズ済みローソク足の最高値 下限線 :直近N本のクローズ済みローソク足の最安値 中央線 :最高値と最安値の平均値 上方ブレイクアウト は終値が上限線を超えたときに発生し、 下方ブレイクアウト は終値が下限線を下回ったときに発生します。 インジケーターは以下を行います: 3本のドンチャンラインを描画 方向転換後の最初のブレイクアウト
FREE
GOM Trade Manager helps you execute trades the way you want it. Works on all instruments Forex, Commodities, & Crypto. It helps you with lot calculations, spread addition and balance calculations so you can just focus on actual trading. For full automatic planned management, stackable triggers and spread widening protection >> check out GOM Trade Manager Pro . ------------------------------------------NOTABLE FEATURES------------------------------------------ You set everything based on bid
FREE
GDS Renko Pip ST - Fixed Brick Renko Chart Tool for MetaTrader 5 GDS Renko Pip ST is a Renko chart tool for MetaTrader 5 designed for traders who want to build and study fixed brick Renko movement using a practical pip or point-based setup. The purpose of this tool is simple: create a cleaner Renko structure so the trader can observe direction, brick runs, pullbacks, support and resistance behavior without normal candle noise. This is not a signal indicator and it does not predict the market. It
Moving Spread
Jose Maria Molina Sanchez
Moving Spread – リアルタイム市場コストモニター 平均スプレッドをリアルタイムで監視し、高コスト期間の取引を回避します。 このインジケーターの機能 Moving Spread は、時間の経過とともに市場の 平均スプレッド(ポイント単位) を測定し、その変化を示します。これは、エントリー時のコストが高すぎる場合を把握するのに不可欠なツールです。このような状況では、取引開始前から利益が損なわれる可能性があります。 なぜこれが重要ですか? スプレッドが高いということは、市場への出入りに多くの費用がかかることを意味します。このインジケーターは、こうした瞬間を特定し、コストが高すぎるときに取引を避けるのに役立ちます。 動作方法 現在のスプレッドを別ウィンドウに表示 します。赤いラインが平均値を表しています。 スプレッドが設定されたしきい値(例:> 0)を超えると、 自動アラート を表示します。 スキャルパーおよびデイトレーダーに最適 です。これにより、「ブリーディング」(継続的な損失)による隠れた損失を回避できます。 実際の例 添付画像のように、資産や時間
FREE
The Horizontal Ray Tool is a lightweight, professional charting utility designed to streamline support and resistance mapping on MetaTrader 5. It brings rapid, one-click horizontal level placement directly to your live chart, eliminating the workspace clutter associated with infinite horizontal lines or manually drawn trendlines. Key Features: Interactive On-Screen Button: Spawns a clean, responsive "DRAW RAY" button docked directly on your chart canvas. A single click drops an independent hor
FREE
Deviation Trend Profile Overview Deviation Trend Profile is a MetaTrader 5 chart indicator that combines three visual layers in a single chart window: a moving average with momentum-based coloring, deviation bands calculated from volatility, and a horizontal distribution profile drawn to the right of the current price. The indicator is an analytical tool. It does not open, modify or close trades, and it is not a complete trading system. It is designed to help the user observe trend direction, mo
FREE
High Low Open Close
Alexandre Borela
4.98 (46)
このプロジェクトが好きなら、5つ星レビューを残してください。 このインジケータは、指定されたためのオープン、ハイ、ロー、クローズ価格を描画します 特定のタイムゾーンの期間と調整が可能です。 これらは、多くの機関や専門家によって見られた重要なレベルです トレーダーは、彼らがより多くのかもしれない場所を知るために有用であり、 アクティブ。 利用可能な期間は次のとおりです。 前の日。 前週。 前の月。 前の四半期。 前年。 または: 現在の日。 現在の週。 現在の月。 現在の四半期。 現年。
FREE
YOU CAN NOW DOWNLOAD FREE VERSIONS OF OUR PAID INDICATORS . IT'S OUR WAY OF GIVING BACK TO THE COMMUNITY ! >>>    GO HERE TO DOWNLOAD The   Volatility Ratio   was developed by Jack D. Schwager to identify trading range and signal potential breakouts. The volatility ratio is defined as the current day's true range divided by the true range over a certain number of days N (i.e. N periods).  How to Use Volatility Ratio The use of a volatility ratio helps to identify situations where the price of
FREE
Order Book, known also as Market Book, market depth, Level 2, - is a dynamically updated table with current volumes of orders to buy and to sell specific financial instument at price levels near Bid and Ask. MetaTrader 5 provides the means for receiving market book from your broker, but in real time only, without access to its history. The indicator OrderBook Cumulative Indicator accumulates market book data online and visualizes them on the chart. In addition, the indicator can show the market
RSI Currency Strength Meter is a powerful and elegant multi-currency indicator that measures the real-time relative strength of the 8 major currencies using RSI logic. By calculating the smoothed performance of each currency across its major pairs and applying the RSI formula, it delivers clean and responsive strength lines that make it easy to spot which currencies are truly strong or weak at any moment. This indicator is particularly useful for visualizing currency correlations and divergence
INTRODUCING MML Data Bridge The demand for bridging external data and machine learning with trading platforms is higher than ever. MetaTrader 5 is a powerful environment for trading and back testing, but without a data bridge, MT5 is largely isolated from using any external data. MML Bridge is a developer tool that allows users to bridge external data into MT5 for back testing, live trading, and optimization. It's built for ease of use, providing users with a simple function API that drip-feeds
FREE
The Mirror Chart MT5 is a overlay indicator specifically designed to project a second financial instrument directly onto the main chart window. This tool is invaluable for traders who rely on correlation analysis, as it visualizes the price movements of two different instruments in real time. Unlike traditional overlays, this indicator utilizes intelligent, dynamic centering and scaling logic. It continuously analyzes the visible price range in the current window for both symbols and calculates
FREE
CosmiCLab SMC FIBO CosmiCLab SMC FIBO is a professional trading indicator designed for traders who use Smart Money Concepts (SMC), market structure analysis and Fibonacci retracement levels. The indicator automatically detects market swings and builds Fibonacci levels based on the latest impulse movement. It also identifies market structure changes such as BOS (Break of Structure) and CHOCH (Change of Character), helping traders understand the current market direction. CosmiCLab SMC FIBO also pr
MQL5に投稿する用の、短く実用的な日本語版の説明です: Dynamic Market Profile (DMP) — カスタム・ボリュームプロファイル Dynamic Market Profile は、チャート上の任意の場所の出来高(ボリューム)を、手動かつ瞬時に分析できるインジケーターです。日足や週足といった固定のプロファイルに縛られる必要はありません。分析したい特定の値動き、レンジ(保ち合い)、トレンドの波をピンポイントで自由に選択できます。 インタラクティブな長方形(レクタングル)を使って、最大 5つの独立したエリアを同時に チャート上に描画できます。 普段のトレードでの使い方 エリアを作成: キーボードの 「1、2、3、4、5」 のいずれかを押すか(または画面上のボタンをクリック)、長方形をチャートに表示させます。 チャート上で調整: 長方形の端をドラッグして、分析したい正確な「期間」と「価格帯」を囲みます。 瞬時に分析: インジケーターがそのエリアのボリュームプロファイルを生配信のようにリアルタイムで計算・描画します。 特定のプロファイルを消したい場合は、その長方形を削
FREE
Rating Meter:26本のインジケーターを1つの総合レーティングに Rating Meter は、人気の高い26本のインジケーターのシグナルを自動で計算し、「売り/中立/買い」というシンプルなレーティングにまとめます。インジケーターのウィンドウをひとつずつ開いて数値を見比べる必要はありません。パネルをひと目見るだけで、選択した時間足で相場がどちらに傾いているかが分かります。 Our products: https://www.mql5.com/en/users/trendhunter/seller パネルの表示内容 **Oscillators ゲージ:**11本のオシレーターで構成されるグループのレーティングです。RSI、Stochastic、CCI、ADX、Awesome Oscillator、Momentum、MACD、Stochastic RSI、Williams %R、Bulls/Bears Power、Ultimate Oscillator が含まれます。 **Moving Averages ゲージ:**15本のトレンド系インジケーターで構成されるグループのレーティン
FREE
Fabii Half Trend Baseline
Fabien Georges Andre Guillemaud
上位足のトレンドに逆らう取引をやめましょう。2本のベースライン、1つのチャート。リペイントなし。 どの通貨ペアでも、どの時間足でも。2分でチャートに表示。Strategy Tester で無料デモを試せます。 Get more indicators here Baselines, volatility filters and oscillators. No repaint. 必要な理由 チャート上のラインが緑になったので、あなたはエントリーします。その後、上位足を開くと、大きなトレンドは逆方向を向いています。シグナルは本物でした。しかし、その背景のトレンドはあなたの味方ではありませんでした。 大きなトレンドに逆らう取引は、そのたびにエントリーの優位性を失わせます。 得られるもの Fabii Half Trend Baseline は、現在の時間足のトレンドと上位足のトレンドを1つのチャートに表示します。ウィンドウを切り替えて全体像を確認する必要がなくなります。 上位足の2本目のベースラインがメインのラインの後ろに描かれるため、別のチャートを開かずに大きなトレンドが分かります。 ベ
プレミアムレベルは、正しい予測の精度が80%を超える独自の指標です。 この指標は、最高のトレーディングスペシャリストによって2か月以上テストされています。 あなたが他のどこにも見つけられない作者の指標! スクリーンショットから、このツールの正確さを自分で確認できます。 1は、1キャンドルの有効期限を持つバイナリーオプションの取引に最適です。 2はすべての通貨ペア、株式、商品、暗号通貨で機能します 手順: 赤い矢印が表示されたらすぐにダウントレードを開き、青い矢印が表示されたら閉じます。青い矢印の後に開くこともできます。 試してテストしてください!推奨設定はデフォルトです! 日足チャートで最高の精度を示します! インディケータは、2600 Pipsの収益性に対して、約10Pipsという非常に小さなマージンを使用します。
Hourly Spread Map answers one question: at which hours does this symbol cost more to enter, and by how much. It reads the spread field that the terminal stores in every closed M1 bar of your own broker feed, sorts those measurements into 24 hours by 7 days of the week, and shows the result as a grid in the indicator sub-window. What It Measures Every closed M1 bar carries one spread measurement. The indicator collects them over the period you choose, groups them by the hour and weekday of the ba
FREE
このプロダクトを購入した人は以下も購入しています
Trade Assistant MT5
Evgeniy Kravchenko
4.43 (216)
取引 ごとのリスクの 計算、新規注文 の 簡単 な 設置、部分的 な 決済機能 を 持 つ 注文管理、 7 種類 のトレーリングストップなど 、便利 な 機能 を 備 えています 。 追加の資料と説明書 インストール手順   -   アプリケーションの手順   -   デモアカウント用アプリケーションの試用版 ライン機能 チャート上にオープニングライン、ストップロス、テイクプロフィットを表示します。この機能により、新規注文を簡単に設定することができ、注文を出す前にその特徴を確認することができます。   リスク計算 リスク計算機能は、設定されたリスクとストップロス注文のサイズを考慮して、新規注文のボリュームを計算します。ストップロスの大きさを自由に設定できると同時に、設定したリスクを守ることができます。 Lot calc ボタン - リスク 計算 を 有効 / 無効 にします 。 Risk フィールドでは 、必要 なリスクの 値 を 0 から 100 までのパーセンテージまたは 預金通貨 で 設定 します 。 設定」 タブで 、 リスク 計算 の 種類 を 選択 します :「 $ 通
Trade Manager EAへようこそ。これは、取引をより直感的、正確、そして効率的にするために設計された究極の リスク管理ツール です。これは単なるオーダー実行ツールではなく、包括的な取引計画、ポジション管理、リスク管理のためのソリューションです。初心者から上級者、迅速な実行を必要とするスキャルパーまで、Trade Manager EAはあらゆるニーズに対応し、為替、指数、商品、暗号通貨などさまざまな市場で柔軟に対応します。 Trade Manager EAを使用すると、複雑な計算が過去のものになります。市場を分析し、エントリーポイント、ストップロス、テイクプロフィットのレベルをチャート上のラインでマークし、リスクを設定するだけで、Trade Managerが最適なポジションサイズを即座に計算し、SLとTPをピップ、ポイント、口座通貨でリアルタイムに表示します。すべての取引が簡単かつ効果的に管理されます。 主な機能: ポジションサイズ計算機 :定義されたリスクに基づいて取引サイズを瞬時に決定します。 簡単な取引計画 :エントリー、ストップロス、テイクプロフィットを設定するためのド
Local Trade Copier EA MT5
Juvenille Emperor Limited
4.94 (149)
Local Trade Copier EA MT5 は、同一の Windows PC または Windows VPS 上で稼働する複数の MetaTrader 5 口座間で、取引をコピーおよび管理するための高速で柔軟なトレードコピーツールです。 ローカルでの取引同期に加え、Receiver 側でロットサイズ、リスク管理、取引フィルター、シンボルマッピング、取引管理、口座保護を個別に設定できます。 Transmitter と Receiver のターミナルは約 1分 で設定でき、同一ブローカーまたは異なるブローカーの口座間で、手動取引や EA による取引をコピーできます。適切な条件下では、ローカルの MetaTrader ターミナル間で取引情報を 0.5秒未満 で同期できます。実際の約定速度は、ブローカーのレイテンシー、ネットワーク状況、PC/VPS の性能、ターミナルの負荷によって異なります。 ご購入前に無料デモをお試しください Local Trade Copier EA MT5 の完全機能版無料デモ を、MT5 デモ口座で 1回につき4時間 テストできます。 Local Trad
================================================================================ POC BREAKOUT - V20.72. Full Professional Grade Toolkit ================================================================================ POC Breakout is a full MetaTrader 5 trading dashboard for discretionary traders who want breakout signals, Point of Control (POC) context, volume profiles, order flow, market structure, news, alerts, and advanced trade planning in one professional workspace. Attached directly to you
Telegram to MT5 Multi-Channel Copier   は、 Telegram と Discord チャンネルのトレードシグナルを MetaTrader 5 へ自動コピーします。ボット不要、ブラウザ拡張不要、手動コピー不要。Telegram や Discord にシグナルが届くと、EA が数秒であなたのターミナルに注文を出します。 さらに、チャンネルをコピーする前に、内蔵バックテスターでそのチャンネルがあなたの口座でどう動いたかを確認できます。 製品は 2 つのコンポーネントで構成されます:Telegram チャンネルを監視する Windows アプリと、MT5 ターミナルでシグナルを執行する本 EA です。MT4 版もあります   こちら . セットアップガイドとアプリのダウンロード:   https://www.mql5.com/en/blogs/post/768988 Telegramのシグナルチャンネルをバックテストする方法 をご覧ください。 現在の価格は今後値上げされます。 仕組み アプリはあなた自身の Telegram アカウントで接続するため、フォロ
Strategy Ledger Pro
Abdullah Uygar Tuna
5 (11)
日本語に対応しました。 Strategy Ledger Pro は、MetaTrader 5 用の読み取り専用の口座分析パネルです。口座の成績をエキスパートアドバイザー(EA)、戦略、銘柄、マジックナンバーごとに分け、それぞれが実際にどれだけ貢献しているかを明らかにします。 パネルは 11 言語に対応しています:English、Français、Deutsch、Español、Italiano、Português、Русский、Türkçe、中文、日本語、한국어。 デモをダウンロードする前に。 Market では、有料製品のデモはストラテジーテスター内でのみ実行されます。このパネルはご自身の口座の取引を分析しますが、ストラテジーテスターには読み取る口座履歴がないため、デモは空のパネルで起動し、その旨を表示します。これはデモの仕組みによるもので、製品の制限ではありません。 この説明内の動画では、実口座でのパネルの動作をご覧いただけます。 すべての機能を解説した詳しい マニュアル (英語)と、情報交換やお知らせのための AureusAI Trading Suite グループをご用意し
The Patch It never opens a trade. It walks behind the ones that did. Every open position, every pending order — checked twice a second for the one thing that's easy to forget: a stop, a target. Found bare, it doesn't ask. It writes the missing number in, measured in points from wherever the position began, and moves on to the next. No strategy, no opinion on direction. Just the quiet assumption that nothing should ever sit on the market unprotected — not because someone decided it shouldn't,
自分の取引ルールで Telegram のシグナルをコピー Telegram to MT5 Signal Trader は、Telegram の公開・非公開チャンネルやグループから、テキスト形式の取引シグナルを MetaTrader 5 へ自動でコピーします。1つのデスクトップアプリで複数の配信者と MT5 口座を管理し、 配信者ごとにリスクと取引設定を個別に指定 できます。 シグナルのコピーに Telegram ボットや API 設定は必要ありません。 電話番号または QR コードでご自身の Telegram アカウントにログインし、すでに参加しているチャンネルやグループを選ぶだけです。ボットの作成や、Telegram API トークン、API ID、API hash の入力は不要です。 ポジションサイズを選び、複数の利確水準に分けて決済し、建値へのストップ移動やトレーリングストップを自動化できます。配信者のシグナルを受け取りながら、実際の取引方法は自分で管理できます。 本製品は、この MT5 エキスパートアドバイザ(EA)と、必須の Windows 連携アプリで構成されます。 インス
TradePanel MT5
Alfiya Fazylova
4.88 (170)
Trade Panelは多機能なトレーディングアシスタントです。アプリには手動取引用の50以上のトレーディング機能が搭載されており、ほとんどの取引作業を自動化することができます。 アプリの説明書: https://www.mql5.com/en/blogs/post/756482 デモ口座用アプリの試用版: https://www.mql5.com/en/blogs/post/750865 アプリのインストール方法: https://www.mql5.com/en/blogs/post/756239 アプリをビジュアルモードでテストする方法: https://www.mql5.com/en/blogs/post/770277 VPSのMetaTraderにアプリをインストールする方法: https://www.mql5.com/en/blogs/post/770190 取引。 ワンクリックで取引操作を行うことができます: リスクを自動計算して指値注文やポジションを開く。 複数の注文やポジションをワンクリックで開く。 注文のグリッドを開く。 保留中の注文やポジションをグループごとに閉じる
Power Candles Strategy Scanner - 自動最適化型マルチシンボル設定ファインダー パワーキャンドル・ストラテジー・スキャナーは 、パワーキャンドル・インジケーターを駆動するのと全く同じ自己最適化エンジンを、マーケットウォッチに登録されているすべての銘柄に対して並行して実行します。1つのパネルで、現在統計的に取引可能な銘柄、各銘柄で勝率の高い戦略、最適なストップロス/テイクプロフィットの組み合わせが表示され、新たなシグナルが発生した瞬間に通知が届きます。 このツールは、Stein Investmentsのエコシステムの一部です。  18種類以上のツールをすべて閲覧し、AIを活用したセットアップの推奨を受け取り、  https://stein.investments でコミュニティに参加しましょう 市場動向を網羅。銘柄ごとに3,000件以上の自動最適化。2種類のアラート。ワンクリックでチャートを切り替えて即座にアクション。 なぜこれが必要なのか 多くのマルチ銘柄スキャナーは、 価格の動き (ボラティリティ、変動率、銘柄ごとのRSI)を表示するだけです。それ
The product will copy all telegram signal to MT5 ( which you are member) , also it can work as remote copier.  Easy to set up, copy order instant, can work with almost signal formats, image signal,  s upport to translate other language to English Work with all type of channel or group, even channel have "Restrict Saving Content", work with  multi channel, multi MT5 Work as remote copier: with signal have ticket number, it will copy exactly via ticket number. Support to backtest signal. How to s
Quant AI Agents are independent trading Expert Advisors. Instead of trading using a fixed strategy like other conventional EAs, Quant AI Agents   is a   multi-agent AI trading framework   that turns natural-language strategy prompts into live.  WANT THE SAME RESULTS AS MY LIVE SIGNAL?   Use the exact same brokers I do:   IC MARKETS , IC TRADING   .  Unlike the centralized stock market, Forex has no single, unified price feed.  Every broker sources liquidity from different providers, creating un
Exp COPYLOT CLIENT for MT5
Vladislav Andruschenko
3.97 (35)
MetaTrader 5 用のプロフェッショナル取引コピー機 MetaTrader 向けの高速・高性能・信頼性の高い 取引コピー機 です。 COPYLOT は、MT4 と MT5 のターミナル間で Forex 取引をコピーでき、 Hedge 口座と Netting 口座の両方に対応しています。 COPYLOT MT5 版の対応構成: - MT5 Hedge → MT5 Hedge - MT5 Hedge → MT5 Netting - MT5 Netting → MT5 Hedge - MT5 Netting → MT5 Netting - MT4 → MT5 Hedge - MT4 → MT5 Netting MT4 版 完全な説明 + DEMO + PDF 購入方法 インストール方法 ログファイルの取得方法 テストと最適化の方法 Expforex のすべての製品 MT4 ターミナルへのコピーも可能です(MT4 → MT4、MT5 → MT4): COPYLOT CLIENT for MT4 COPYLOT は、2台、3台、さらには10台のターミナル間で同時に動作できる、プロフェッ
Grid Manual MT5
Alfiya Fazylova
4.73 (22)
「Grid Manual」は、注文のグリッドを操作するための取引パネルです。 ユーティリティはユニバーサルで、柔軟な設定と直感的なインターフェイスを備えています。 それは、損失を平均化する方向だけでなく、利益を増やす方向でも注文のグリッドで機能します。 トレーダーは注文のグリッドを作成して維持する必要はありません。 すべてが「Grid Manual」によって行われます。 注文を開くだけで十分であり、「Grid Manual」は注文のグリッドを自動的に作成し、非常に閉じるまでそれに付随します。 完全な説明とデモバージョン ここ。 ユーティリティの主な機能と機能 ユーティリティは、モバイル端末から開かれた注文を含め、あらゆる方法で開かれた注文を処理します。 「制限」と「停止」の2種類のグリッドで機能します。 グリッド間隔の計算には、固定と動的(ATRインジケーターに基づく)の2つの方法で機能します。 オープンオーダーグリッドの設定を変更できます。 チャート上の各注文グリッドの損益分岐点を表示します。 各注文グリッドの利益率を表示します。 ワンクリックでグリッドから収益性の高い注文を閉じるこ
Signal TradingView to MT5 Pro Automator TradingViewとMetaTrader 5間の即時プロフェッショナル実行 TradingViewのシグナル(アラート)とMT5での実際の約定を繋ぐ、最も強固なコミュニケーションブリッジで、取引戦略を自動化します。スピード、柔軟性、そして完璧なリスク管理を求めるトレーダー向けに設計されたこのExpert Advisorは、あらゆるアラートメッセージを正確な成行または指値注文に変換します。 強みと利点 ユニバーサルパーシングエンジン(独自技術): あらゆるアラート形式からデータを自動的に認識し、抽出できる高度なテクノロジー。単一の固定フォーマットに制限されることはありません。システムはシンボル(銘柄)、アクション、価格、SL(ストップロス)、TP(テイクプロフィット)を自動的に理解します。 リアルタイム実行: レイテンシ(遅延)を最小限に抑えるよう最適化された、1秒未満の超高速ポーリング技術。シグナルを受信してから数ミリ秒以内に注文が実行されます。 機関投資家レベルのリスク管理: 以下に基づく自動かつ正確
Trade Dashboard simplifies how you open, manage, and control your trades, with built-in lot size calculation. It allows you to execute trades, manage risk, and control positions directly on the chart, with tools such as partial close, breakeven, and trailing stop. Designed to reduce manual work and help you stay focused on your trading decisions. A demo version is available for testing. Detailed explanations of features are provided within the MQL5 platform. Installation instructions are include
Seconds Chart - MetaTrader 5で秒足チャートを作成するユニークなツールです。 Seconds Chart を使用すると、秒単位のタイムフレームでチャートを構築でき、標準的な分足や時間足チャートでは得られない柔軟性と分析精度を実現します。例えば、 S15 は15秒足を表します。カスタムシンボルをサポートしているインジケーターやEAをすべて使用できます。標準的なチャートと同様に便利に操作できます。 標準的なツールとは異なり、 Seconds Chart は超短期のタイムフレームでも高い精度と遅延なく作業できるように設計されています。 Free Demo: Seconds Chart v2.29 Demo.ex5 無料デモをダウンロードしてご自身でお確かめください: 完全機能版 - すべての機能が利用可能 24時間テスト - 精度と利便性を評価するのに十分な時間 デモ口座のみ - ほとんどのブローカーで簡単に開設可能 GBPCADチャートのみ - ほとんどの端末で利用可能 これらの制限はデモ版のみに適用されます。製品版は、あらゆる口座タイプ(リアル、デモ、コンテス
Telegram To MT5 — シグナルコピア Telegram チャンネルのトレードコールを、実際の MT5 注文に変換します — 自動で、好きなだけの口座に対応し、リスクとルールは完全にあなたの管理下に置けます。 Telegram To MT5 は、あなたが Telegram で既にフォローしている VIP / シグナルチャンネルを MetaTrader 5 端末に接続します。無料の付属デスクトップアプリがメッセージを読み取り(ボットを禁止しているチャンネルでも可能)、この EA があなたの口座でそれらを執行します — あなた自身のリスク設定、シンボルマッピング、テイクプロフィット処理、セッションおよびニュースフィルターを適用します。 これはシグナルコピアであり、ブラックボックス戦略ではありません。どのチャンネルを信頼するか、各トレードのロットと管理方法をあなたが決めます。 ステップバイステップの設定と付属アプリのインストールガイド 仕組み [あなたの Telegram チャンネル] -> [付属デスクトップアプリ] -> [MT5 + この EA] -> 注文 付属デスクトッ
FUTURES ORDERFLOW FOOTPRINT CHART Professional OrderFlow EA for MetaTrader 5 Version 1.01| Professional tool for real traders | Institutional-Grade Visualization STRATEGY TESTER USERS - PLEASE SELECT EVERY REAL TICK WHEN TESTING AND YOU HAVE DOWNLOADED HISTORICAL DATA. IF YOU SEE A WAITING SCREEN AND IT IS NOT DOWNLOADING, IT MEANS YOU HAVE LOW HISTORICAL DATA. TRY 1 MIN AND 5 MIN FIRST ON 1 DAY DATA. ONE DAY DATA SHOULD BE THE NEWEST AND MOST CURRENT DATE. PLEASE WAIT UNTIL THE MARKET HAS ROL
HINN MAGIC ENTRY – the ultimate tool for entry and position management! SIMPLE. FASTEST. INTUITIVE. MAX AUTOMATED. Place orders by selecting a level directly on the chart! full description   ::  demo-version  :: 60-sec-video-description Key features: - Market, limit, and pending orders - Automatic lot size calculation - Automatic spread and commission accounting - Unlimited partitial take-profits  - Breakeven and trailing stop-loss and take-profit  functions - Invalidation leves - Intuitive, a
Your EAs cannot see each other, but Anchor can. Anchor gives you one place to coordinate your EAs, manage risk, and decide when trading is allowed. It works alongside the trading bots you already use without any changes to them. The Problem One EA opens a trade. Then another starts trading. The next thing you know, you wake up to multiple grids built across your account. Each EA may be doing exactly what it was designed to do, but together they can place far more risk on your account than you in
Trade copier MT5
Alfiya Fazylova
4.61 (57)
Trade Copierは、取引口座間の取引をコピーして同期するように設計された専門的なユーティリティです。 コピーは、同じコンピューターまたはvps にインストールされている、サプライヤーのアカウント/端末から受信者のアカウント/端末に行われます。 購入する前に、デモ アカウントでデモ バージョンをテストできます。 デモ版 こちら 。 詳細な説明は こちら 。 主な機能と利点: MT5ネッティングアカウントを含む、MT5> MT5、MT4> MT5、MT5> MT4のコピーをサポートします。 高いコピー速度(0.5秒未満)。 ベンダーモードと受信者モードは同じ製品内に実装されています。 チャートから直接リアルタイムでコピーを制御できる、簡単で直感的なインターフェイス。 接続が切断されたり、端末が再起動されたりしても、設定と位置が失われることはありません。 コピーするシンボルを選択できます。また、受信者のシンボルを置き換えることもできます(例:EURUSD> USDJPY)。 各シンボルごとにコピーの個別設定を行うことができます。 バックコピーをサポートします。 特定の注文のみのコピー
Daily Trading Limiter
AL MOOSAWI ABDULLAH JAFFER BAQER
5 (8)
• Please test the product in the Strategy Tester before purchasing to understand how it works. • If you face any issues, contact me via private message—I’m always available to help. • After purchase, send me a screenshot of your order to receive a FREE EA as a gift. Daily Trading Limiter — the rule you cannot break Every trader knows the number. Three trades. Two percent. One bad day and stop. And every trader has watched themselves take the fourth trade anyway. The problem was never knowing th
この製品は、ニュースタイム中にすべてのエキスパートアドバイザーと手動チャートをフィルタリングするため、急激な価格変動によるマニュアルトレードのセットアップの破壊や他のエキスパートアドバイザーによって入力された取引について心配する必要はありません。この製品には、ニュースのリリース前にオープンポジションとペンディングオーダーを処理できる完全な注文管理システムも付属しています。 The News Filter  を購入すると、将来のエキスパートアドバイザーのためにビルトインのニュースフィルターに頼る必要はなく、今後はすべてのエキスパートアドバイザーをここからフィルタリングできます。 ニュース選択 ニュースソースは、Forex Factoryの経済カレンダーから取得されます。 USD、EUR、GBP、JPY、AUD、CAD、CHF、NZD、CNYなど、任意の通貨数に基づいて選択できます。 Non-Farm(NFP)、FOMC、CPIなどのキーワード識別に基づいて選択することもできます。 影響レベルによってフィルタリングするニュースを選択することができ、低、中、高の影響範囲から選択できます。
Trade Indicator Assistant   is a powerful MT5 utility designed to turn indicators into automated trading systems. Its main feature is the ability to automatically detect an indicator’s   BUY and SELL signal buffers , without requiring you to know the buffer numbers, search through indicator settings, or modify the indicator source code. Bonus Indicator:   After purchasing Trade Indicator Assistant, contact me to receive   Trade Signal Pro   completely free as a bonus indicator. [Download Demo V
Floor Watch
Syed Tauqeer Hussain Shah
Floor Watch One number, watched every thirty seconds: how far equity has fallen since the day began — or since its highest point, if it's told to trail the peak instead of the open. Cross the line and it doesn't argue. Every open position closes, every pending order vanishes, and anything that slips through afterward gets shut the moment it appears. Not asked. Removed. The floor holds until the clock turns 5 AM Pakistan time — then, and only then, does the day start over. One rule. No except
YuClusters
Yury Kulikov
4.93 (43)
Attention: You can view the program operation in the free version  YuClusters DEMO .  YuClusters is a professional market analysis system. The trader has unique opportunities to analyze the flow of orders, trade volumes, price movements using various charts, profiles, indicators, and graphical objects. YuClusters operates on data based on Time&Sales or ticks information, depending on what is available in the quotes of a financial instrument. YuClusters allows you to build graphs by combining da
MT5 to Discord Signal Provider は、Discord へ直接トレーディングシグナルを送信するために設計された、使いやすく完全にカスタマイズ可能なユーティリティです。このツールは、あなたのトレーディングアカウントを効率的なシグナルプロバイダーに変えます。 スタイルに合わせてメッセージフォーマットをカスタマイズ!利便性を考え、事前にデザインされたテンプレートから選択し、メッセージのどの要素を含めるか除外するかを選択できます。 [ デモ ] [ マニュアル ] [ MT4 バージョン ] [ Telegram バージョン ]  New: [ Telegram To MT5 ] セットアップ 簡単なセットアップのために、私たちの詳細な ユーザーガイド に従ってください。 Discord API の事前知識は必要ありません。必要なツールはすべて提供されます。 主な特徴 購読者の更新のための注文詳細をカスタマイズ。 ブロンズ、シルバー、ゴールドなど、各レベルで異なるシグナルアクセスを提供する階層的サブスクリプションモデルを実装。 注文が実行されたチャートのスクリーン
OrderManager をご紹介:MT5用の革新的なユーティリティ 新しく設計されたOrder Managerユーティリティを使用して、MetaTrader 5での取引をプロフェッショナルなものにしましょう。シンプルさと使いやすさに焦点を当てたこのユーティリティは、各取引に関連するリスクを簡単に定義し、視覚化できます。これにより、情報に基づいた意思決定が可能になり、取引戦略を最適化できます。OrderManagerに関する詳細は、マニュアルをご参照ください。 [ マニュアル ] [ MT4 バージョン ] [ Telegram チャンネル ]  New: [ Telegram To MT5 ] 主な特長: リスク管理:取引のリスクを素早く簡単に定義し、より良い意思決定を行い、取引パフォーマンスを向上させます。 視覚表現:オープンなポジションとそれに関連するリスクをグラフィカルに表示し、明瞭かつ簡潔な理解が可能です。 注文変更:数回のクリックで注文を簡単に変更またはクローズし、取引プロセスを効率化し、貴重な時間を節約します。 手のひらの上の最新ニュース:ボタン一つで最新の市場ニュース
作者のその他のプロダクト
motive is to turn market volatility and selected time/session reference points into a visual price grid . Instead of claiming to predict price direction, it gives the trader a structured way to judge where current price sits relative to ATR-derived or fixed-distance ranges. Potential Volatility awareness: ATR-based spacing expands and contracts with measured price volatility. Price-range context: Multiple grid levels show how far price has traveled from a reference point. Session analysis: The f
FREE
Synchronizes all open charts to the symbol of the chart this indicator is applied to. SyncAllCharts is a MetaTrader 5 indicator that lets one main chart control the trading symbol shown on all other open charts. Change the symbol on the main chart, and the other charts follow while keeping their own timeframes. It helps you review the same market across several timeframes without changing each chart manually. How to use it Attach the indicator to one chart that you want to use as the main contr
FREE
is designed to simplify switching between trading instruments directly from the active chart. It allows traders to cycle through symbols listed in the broker's Market Watch using on-chart navigation buttons or keyboard arrow keys . The indicator's primary motive is to make multi-symbol market analysis faster, more convenient, and more organized by reducing the need to manually locate and open individual charts. Key Features Previous / Next Navigation: Switch between Market Watch symbols using t
FREE
Quote Cost Parity is  a MetaTrader 5 chart panel for forex majors and minors that share a quote currency. Pairs with the same quote have the same pip cost for a given lot. The indicator uses that correspondence directly: it calculates the cost once for the group, then shows that cost for three lot sizes. It acknowledges only these quote groups. JPY: USDJPY, EURJPY, GBPJPY, AUDJPY, NZDJPY, CADJPY, CHFJPY. Source: USDJPY. CHF: USDCHF, EURCHF, GBPCHF, AUDCHF, NZDCHF, CADCHF. Source: USDCHF. CAD: US
FREE
is a visual market-monitoring indicator that displays multiple trading instruments and timeframes within a single chart window. Developed using MQL5, the indicator transforms historical price data into a structured dashboard featuring custom candlesticks or price dots. Each row represents a symbol, while each column represents a selected timeframe. This arrangement allows traders to examine recent market behavior across several instruments and timeframes without continually opening and closing c
FREE
Displays broker-provided LONG and SHORT swap values for selected instruments in a full-chart, dynamically sized table. The Swaps Monitor Table provides a simple way to view the swap rates supplied by your broker for multiple trading instruments at once. The table can display instruments from Market Watch, all available instruments, or a manually selected list , allowing traders to monitor swap costs without opening each symbol individually. The indicator automatically adjusts the table cells an
FREE
Market Watch's Symbols,  Lot Sizing choice,  Spread, & Price are shown. The app is visually customizable. Click on any Symbol for interaction with its chart!   Trader Market Watch is a display-only MetaTrader 5 board. It fills the chart tab with the symbols already in Market Watch and does not place or modify orders. Each row shows the symbol, the spread in pips, and the price. Two lot columns sit beside them: the lot size that uses your chosen percent of balance as margin, and the largest
FREE
Automated Timeframe cycling with Symbols centered.  Force every timeframe onto one clock window, so the story you see on Daily is the same story you are slicing on H4, H1, and M1.  Traders usually flip timeframes and lose the span. A Daily chart shows a few weeks, then M15 shows a few hours, and the eye treats them as different markets. TASSERACT locks the window to N bars of the highest enabled timeframe — default 10 Daily — and maps every lower timeframe to that same stretch. You stay inside o
FREE
is an on-chart pre-trade planner for the symbol on that chart. It clears the price and time scales and fills the tab with a live reading of this account against this symbol: spread, pip value, point value, an ATR stop, three ATR targets, and ten lot sizes sized from a percent of balance. Targets are reduced by the live spread. The stop is increased by it. Commission and planned swap are then applied, so the money and percent figures are net of those costs before a buy or sell. It does not place
FREE
Automated Timeframe cycling with Symbols centered.  Force every timeframe onto one clock window, so the story you see on Daily is the same story you are slicing on H4, H1, and M1.  Traders usually flip timeframes and lose the span. A Daily chart shows a few weeks, then M15 shows a few hours, and the eye treats them as different markets. TASSERACT locks the window to N bars of the highest enabled timeframe — default 10 Daily — and maps every lower timeframe to that same stretch. You stay inside o
FREE
is a panel that groups FX Major & Minor quote currencies and shows the shared pip or point cost of a trade. View that cost for three fixed lot sizes or three account-balance risk percentages. Currency Cost Constellation is a MetaTrader 4 chart panel for forex majors and minors that share a quote currency. Pairs with the same quote have the same pip cost for a given lot. The indicator uses that correspondence directly: it calculates the cost once for the group, then shows that cost for three lo
FREE
is an exit manager for trades you open yourself. It does not open positions and it does not send signals. After a manual buy or sell, it gives that trade a stop and up to six exit stages based on volatility. Three stages come from Average True Range, each with its own timeframe. Three come from completed range: daily (ADR), weekly (AWR), and monthly (AMR). Each stage can be switched on or off. Enabled stages are sorted by distance. Nearer stages trail the stop. The furthest is posted as the take
FREE
This indicator builds a live correlation matrix from the symbols currently selected in Market Watch . It calculates Pearson correlation on simple returns over a user-defined lookback and displays the results in a clean, auto-sized grid. Positive correlations appear in green, negative in red, and near-zero values stay neutral. An optional automatic timeframe scanner cycles through only the timeframes you enable (M1, M5, M15, M30, H1, H4, D1, W1, MN1), updating the entire matrix at a set interval.
FREE
is designed to enhance the visual representation of financial charts in MetaTrader 4 by dynamically altering the colors of various chart elements, including candlesticks, bars, line charts, and volume bars. Its primary purpose is to improve trader intuition and engagement during market analysis by introducing smooth, cyclical color transitions that can highlight momentum shifts, trends, or volatility without overwhelming the display. This functionality is particularly beneficial for traders who
FREE
designed to help traders monitor the long and short swap rates of available trading instruments through a clear, organized on-chart table. Its primary purpose is to make overnight financing costs and potential swap credits easier to observe across multiple symbols without repeatedly opening individual instrument specifications. By presenting swap information in a centralized display, the application helps traders incorporate holding costs into their market analysis and trade planning. Key Benef
FREE
visual trade planner for MetaTrader 5. It draws multi-timeframe ATR reward and stop zones on the chart so you can judge distance and payoff before you place the trade yourself. It does not send, modify, or close orders. Motive A single ATR on the chart timeframe often hides the larger and smaller ranges a trade is actually working against. This EA stacks three take-profit slices, each from its own timeframe, period, and multiplier, then places an ATR stop and an optional fixed stop beside them.
FREE
is a user-friendly MetaTrader 4 indicator that creates a centralized dashboard for traders to oversee market symbols simultaneously across different timeframes, presenting price movements through simple dots or miniature candlestick charts, complemented by volume indicators to facilitate quick assessments of market trends and fluctuations. It automatically resizes grid cells according to the number of bars shown per timeframe for better use of screen space, features adjustable color schemes fo
FREE
A Market Watch multi-timeframe ATR dashboard that turns a chart into a full-screen table showing each selected symbol’s recent volatility across multiple timeframes. It calculates ATR for the symbols visible in Market Watch, then displays the result in pips, points, or raw price units. Its practical use is volatility scanning, quickly finding instruments and timeframes that are moving enough—or quietly enough—for your trading style.                                Period that is worth using Sty
FREE
Market Watch's Symbols,  Lot Sizing choice,  Spread, & Price are shown. The app is visually customizable. Click on any Symbol for interaction with its chart!   Trader Market Watch is a display-only MetaTrader 4 board. It fills the chart tab with the symbols already in Market Watch and does not place or modify orders. Each row shows the symbol, the spread in pips, and the price. Two lot columns sit beside them: the lot size that uses your chosen percent of balance as margin, and the largest
FREE
Predetermination is an exit manager for trades you open yourself. It does not open positions and it does not send signals. After a manual buy or sell, it gives that trade a stop and up to six exit stages based on volatility. Three stages come from Average True Range, each with its own timeframe. Three come from completed range: daily (ADR), weekly (AWR), and monthly (AMR). Each stage can be switched on or off. Enabled stages are sorted by distance. Nearer stages trail the stop. The
FREE
Analyze volatility by clicking on a specific candlestick, which triggers the display of horizontal grid lines centered around the candlestick’s closing price, spaced by multiples of the calculated ATR. A vertical line highlights the selected candlestick, and an optional text label can display the ATR value in pips above the candlestick. The indicator is lightweight, using no buffers, and relies on chart objects for visualization. It includes error handling for invalid candlestick selections and
FREE
Bigger chart labels would allow the user to be entirely aware of which chart he/she is on. Each chart window is unique, containing different patterns and economic motives so acknowledging the chart window would be absolutely essential! There are well known Economic Time Zones included in clear view, by choice!    Simple does it! Use your computing mouse scroller, clicking with the right finger on the label, in order to customize the label properties. From there, choose your preferred color, fon
FREE
This script paces itself to zoom into the deepest setting of ZOOM +     You may be in tune to know a few keyboard easter eggs. Pressing the  minus <->  button has the capability to Zoom the Chart Outward! Interesting to see the price reevaluate itself in perspective. This we could see is quite contagiously useful if we wanted to be quick with analyzing, examining through your tools, in your plans and such. So, if you ever wanted to zoom IN and OUT, here is Your play around with the chart poin
FREE
ボラティリティに適応し、取引ポジションに報酬を与えるための潜在的なリスクは、平均真の範囲に基づいて示されています。 "購入または売却"ボタンをクリックすると、リスク-報酬-ボックスが表示されます! ATR計算の有用性は、取引を終了するときのためのハードな決定の一部ではない問題で喜ぶ。 この問題は、あなたのリスク管理の決定を支援します。  仕様 平均真の範囲は、ピップまたは価格で市場のボラティリティを測定する一般的に使用される指標です。 真の範囲は、任意の期間におけるローソク足の最低取引価格と最高取引価格との差です。 平均真の範囲は、すべてで、日の"前の"期間のこれらの高値と安値を平均します。 例では、ATRインジケータのデフォルト設定は、私たちに14日間の期間を与えます。 ATRは、14日で割って、ピップ値で高値と安値を収集します。 しかし、もちろん、これは一般的な指標、ATRを超えています。 実際には、3つの全く異なるTPsは、異なるピップ消費のために独自の時間枠にのみ依存しています。 ローソク足のルールは、各時間枠で技術的に異なります。 したがって、同じ期間を使用すると、時間枠
FREE
Grid MATR is designed to map price against dynamically measured or fixed ranges so traders can better visualize volatility, market extension, and session-based price behavior—while requiring independent analysis for direction and trade decisions.  The motive is to turn market volatility and selected time/session reference points into a visual price grid.  Instead of claiming to predict price direction, it gives the trader a structured way to judge where current price sits relative to ATR-deriv
FREE
It computes BUY and SELL lot sizing in either % of balance or in fixed intervals. In market orders, this EA contains the adaptive slippage, logs tickets for instant confirmation of opening trades, and contains every market symbol at a glance. Real-time balance/equity display keeps margin health in view without tab-switching, toggling spread if needed for liquidity checks. Compact left-panel layout minimizes screen real estate, empowering blind trades where speed trumps overanalyze—perfect for
FREE
An on‑chart, data‑driven pre‑trade planner that turns your broker’s live market properties into clear, actionable numbers. It consolidates spread, commission, swaps, ATR‑based stop/targets, pip/point value and 10 risk‑profile lot sizes into one compact panel that auto‑scales to any chart size. The display is direction‑agnostic (no LONG/SHORT duplication) and emphasizes total trade cost and true risk/reward before you click “Buy/Sell.” What it shows (at a glance) Time & price context  (Local/Serv
FREE
Designed to mark a specific price and time point on an MT4 chart based on a single mouse click, synchronizing this data across all timeframes for the same symbol. Its primary purpose is to help traders pinpoint and track critical levels or events (e.g., support/resistance or entry points) with persistent visual markers. The indicator uses dashed lines for price and time crosshairs, accompanied by labels that dynamically adjust to stay within chart boundaries, ensuring clarity regardless of win
FREE
Symbol Cycler is a lightweight on-chart utility that lets you quickly switch between symbols in your Market Watch list using two simple arrow buttons (). With a single click, you can scroll forward or backward through your predefined symbols without leaving the chart. Key Features: One-click symbol switching from the chart Works with your Market Watch list order Buttons can be placed in any chart corner or even the center Timeframe remains locked while switching symbols Clean, responsive UI
FREE
Its primary motive is to overlay horizontal lines spaced according to multiples of the Average True Range (ATR), centered on a reference price from defined periods such as trading sessions, candlestick counts, or 12-hour intervals. This facilitates the identification of potential support and resistance levels or expected price ranges. Additionally, it marks major forex trading sessions (Sydney, Tokyo, London, and New York) with arrows to provide contextual awareness of market hours, enhancing d
FREE
フィルタ:
レビューなし
レビューに返信