MACD Custom Indicator CM

4

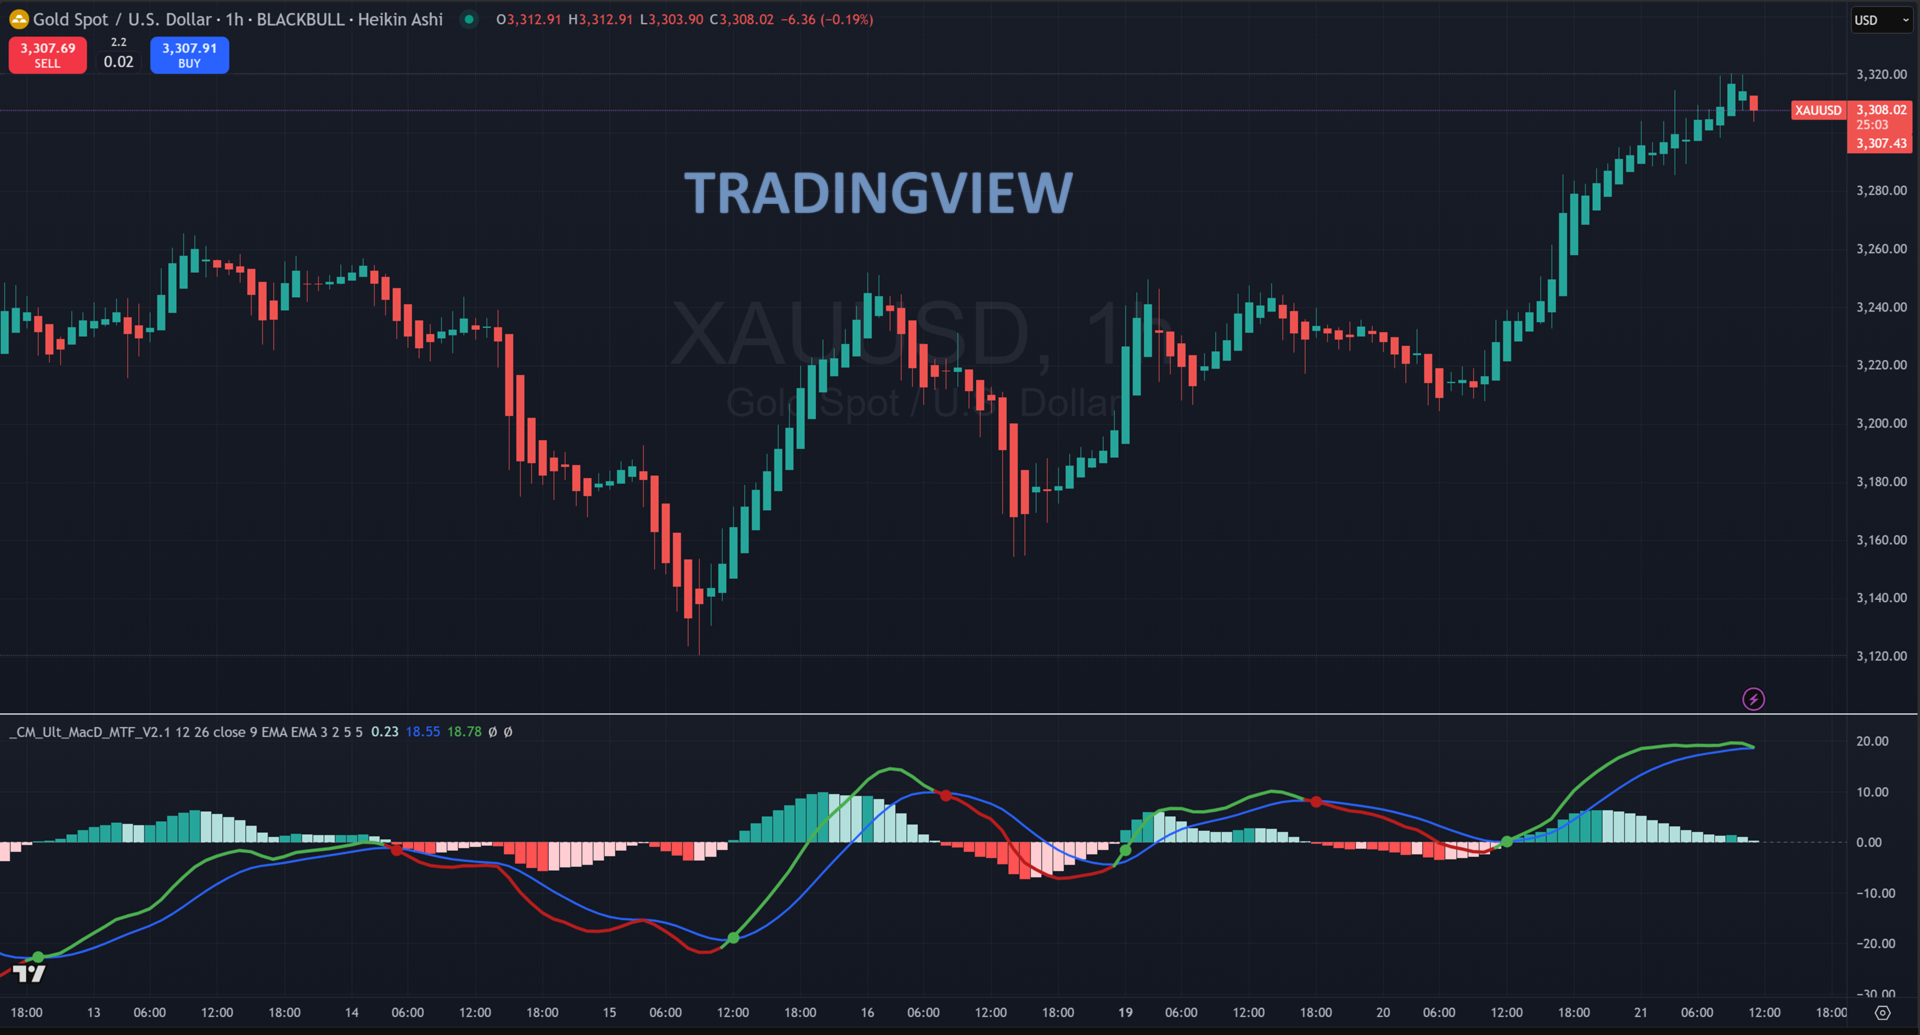
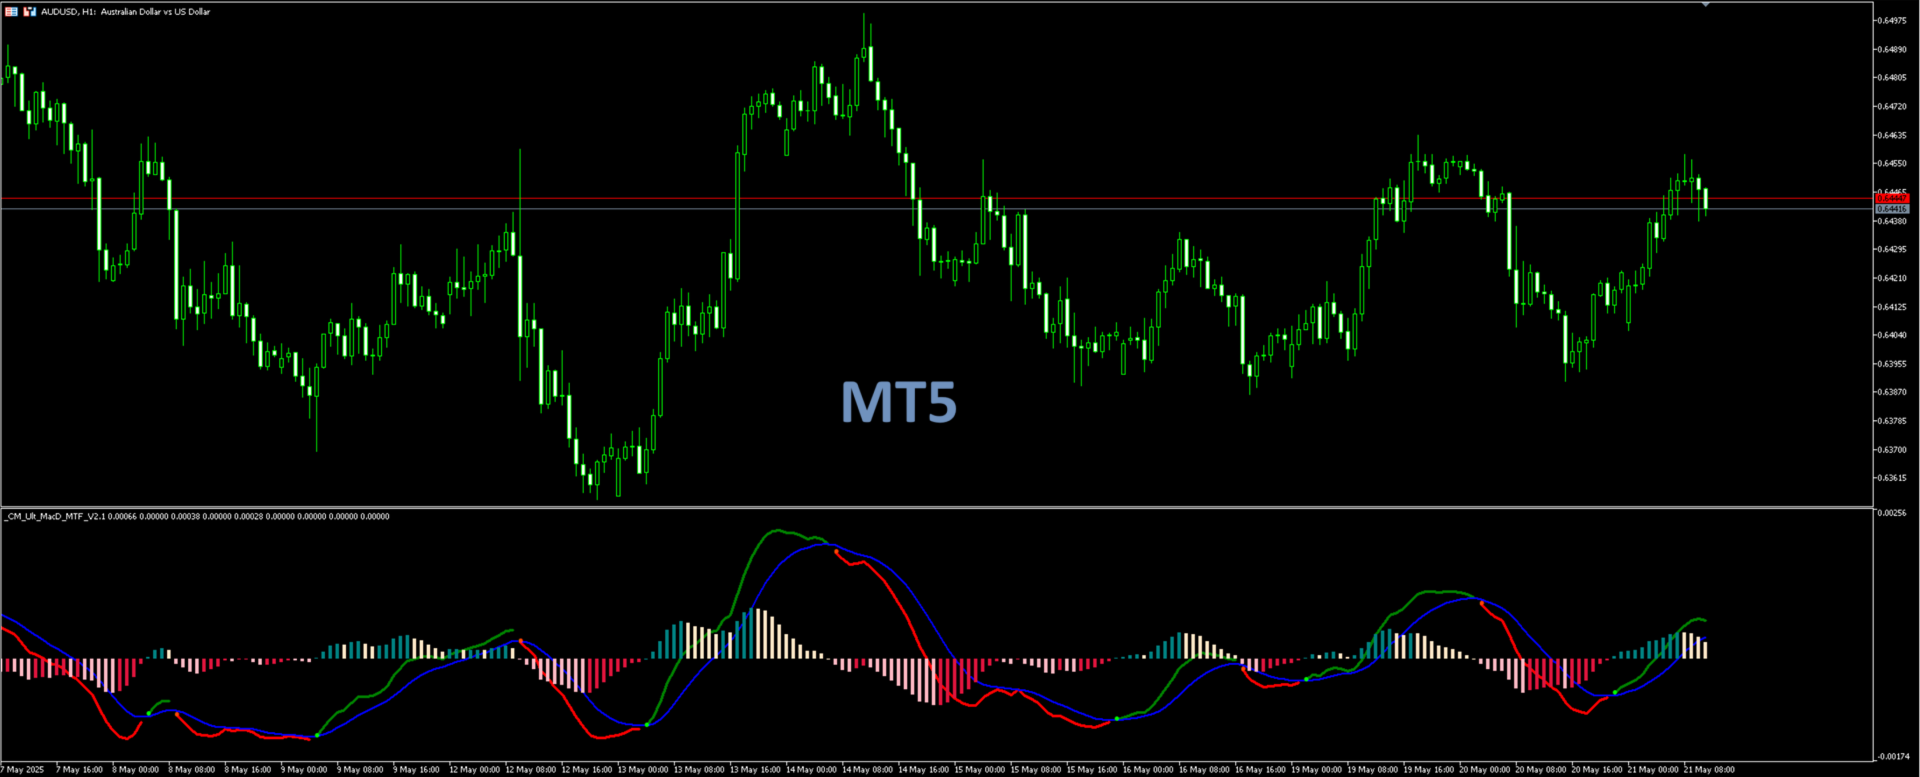
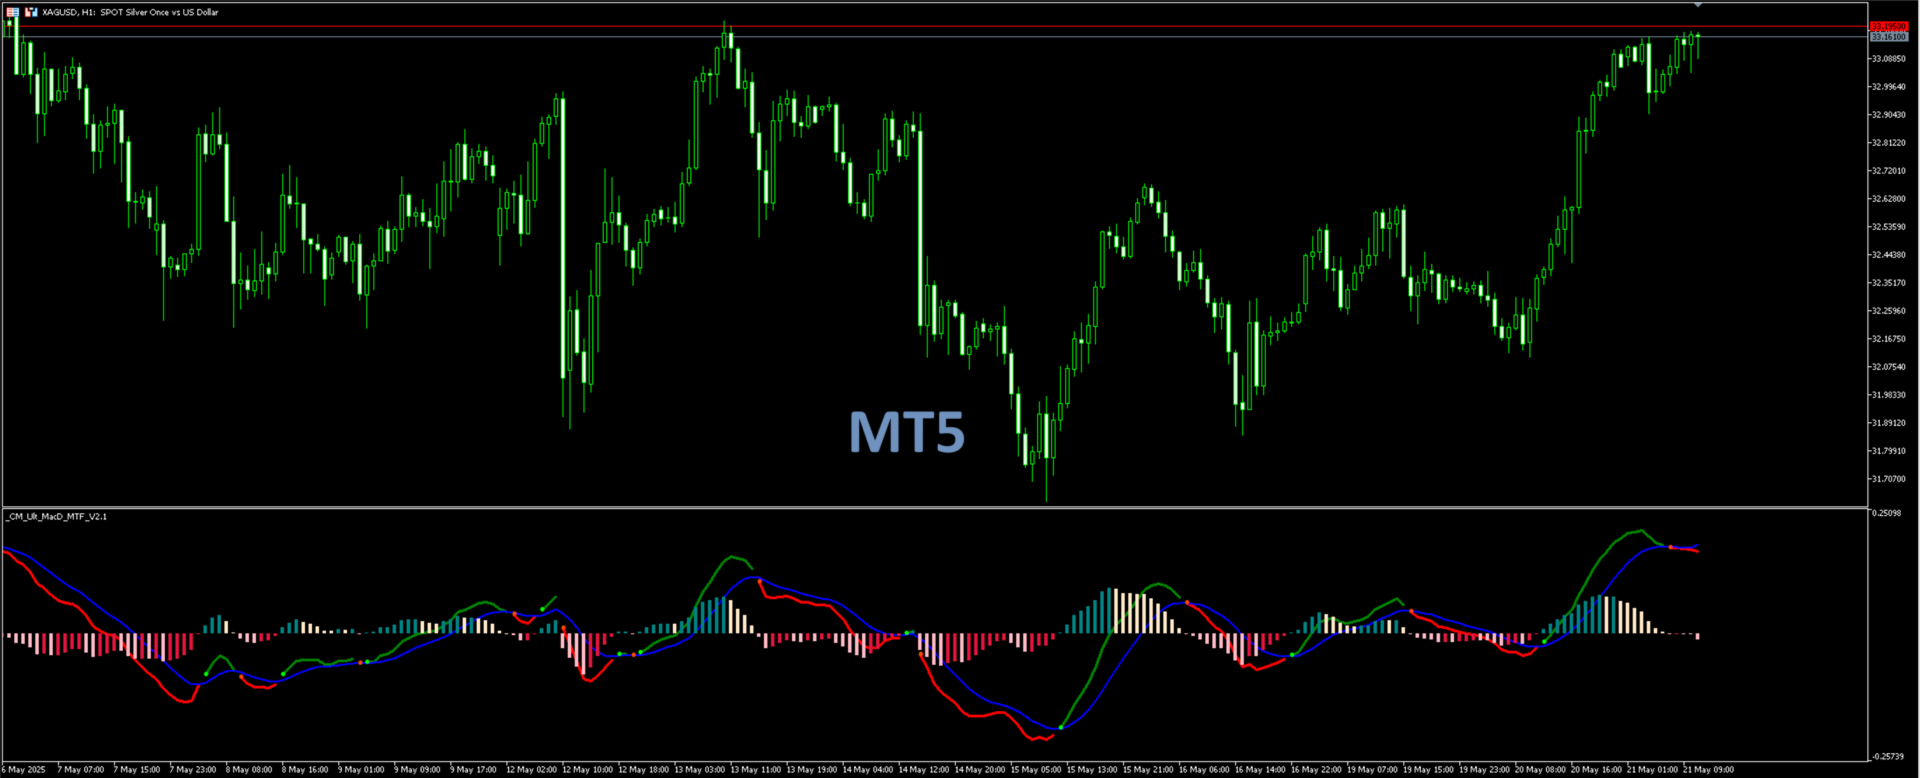
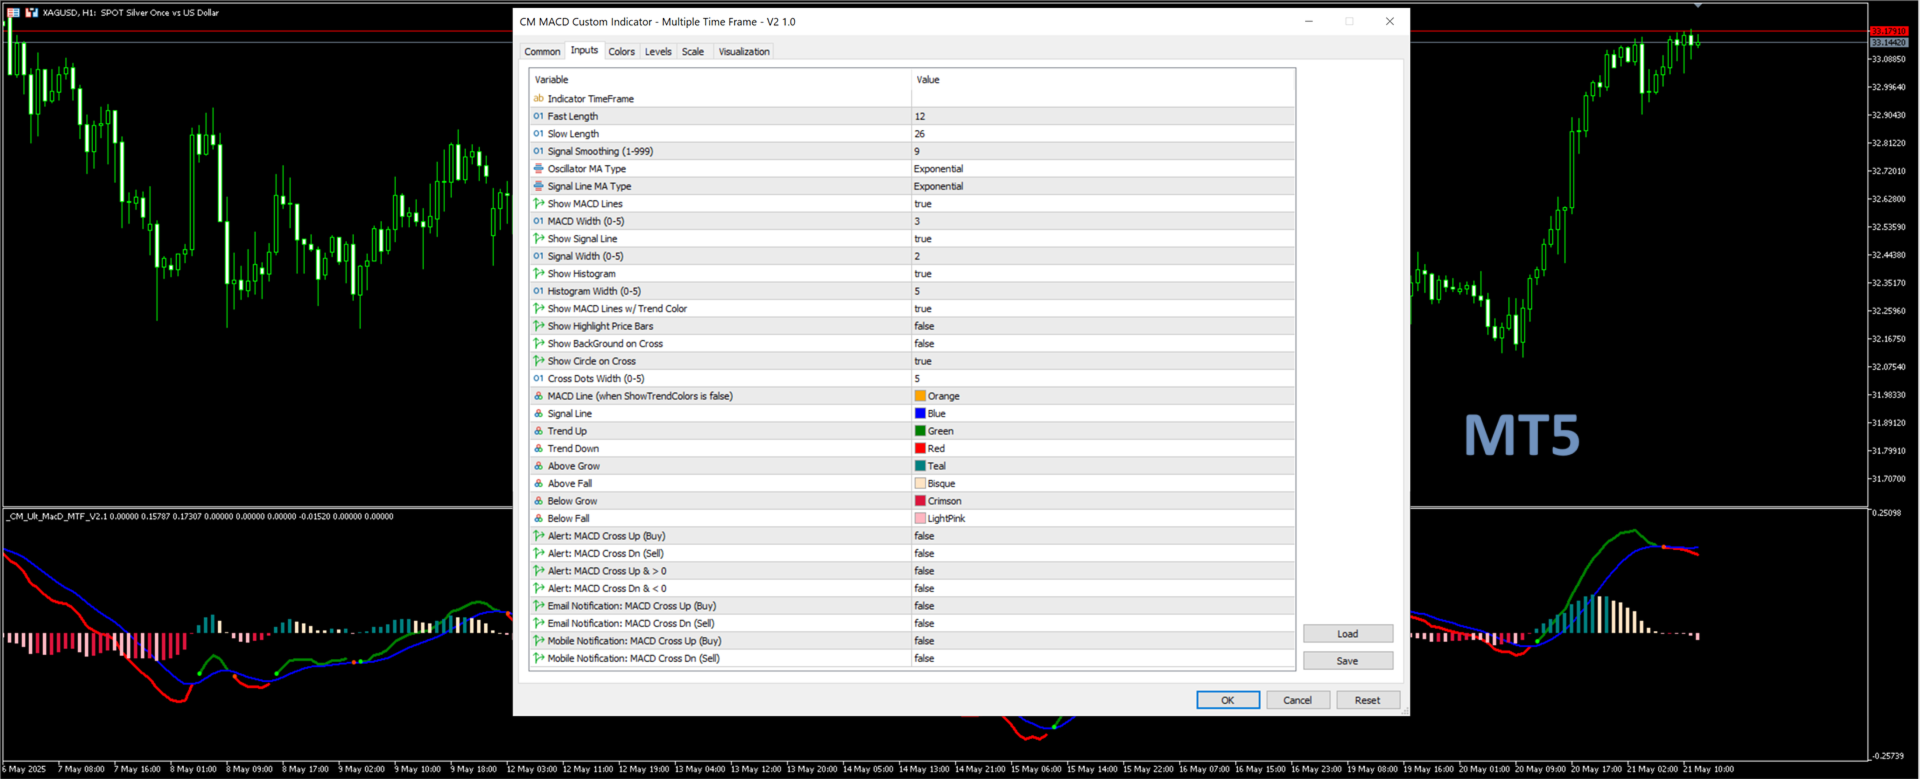
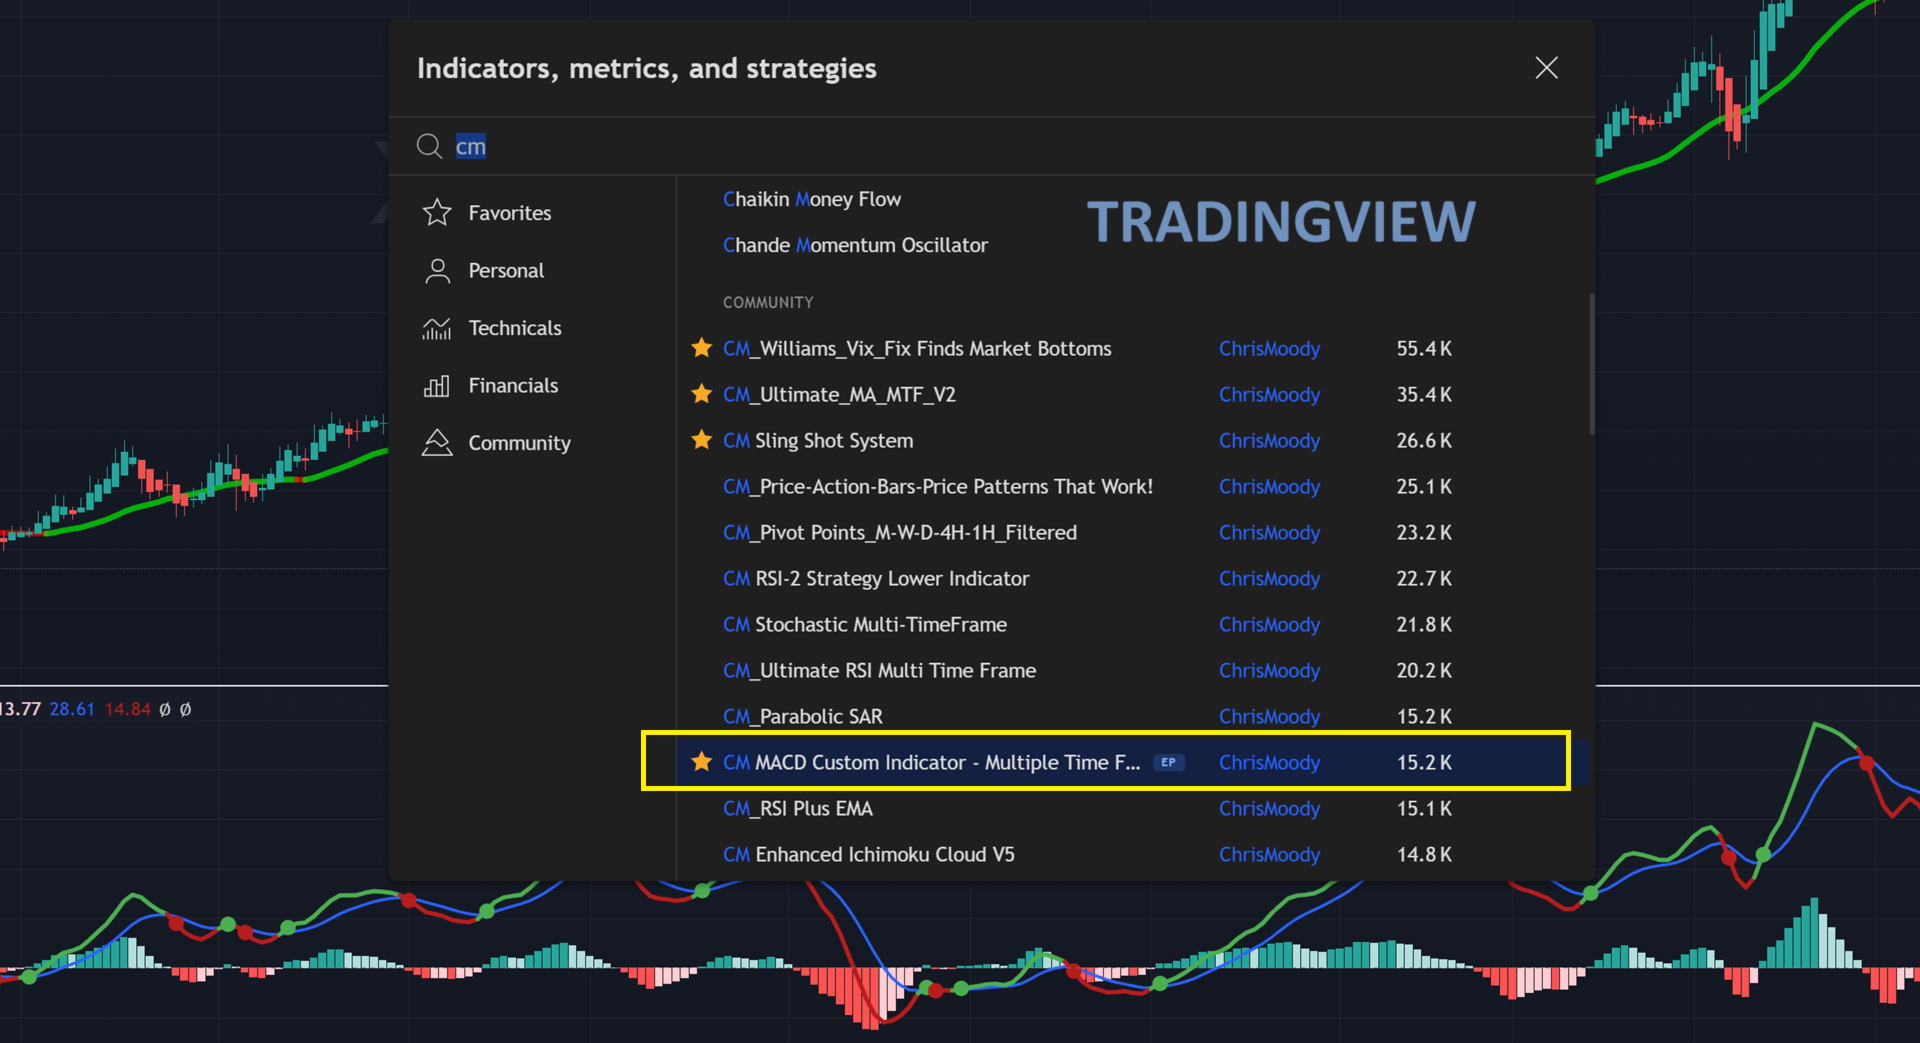
CM MACD Custom Indicator - Multiple Time Frame (V2.1)

This advanced MT5 indicator, adapted from ChrisMoody’s TradingView script, delivers a powerful Multi-Timeframe MACD with customizable visuals and alerts.

Plotting MACD lines, signal line, and a color-coded histogram, it highlights trend direction and momentum with distinct colors for growing/falling histograms above/below zero.

Cross signals are marked with arrows, and users can enable alerts, email, or mobile notifications for buy/sell opportunities.

Fully customizable parameters include timeframe, EMA periods, MA types, line widths, and colors, making it ideal for traders seeking precise momentum analysis across any timeframe.

Support and questions via MQL5 product comments.

For questions, updates, and to connect with other traders, join my official MQL5 group ForexEAandMore


Settings:

  • Indicator TimeFrame: Set a custom timeframe (e.g., M1, H1, D1) for Multi-Timeframe analysis; defaults to chart timeframe if blank.
  • Fast/Slow EMA: Adjust Fast (default: 12) and Slow (default: 26) EMA periods for MACD calculation.
  • Signal Smoothing: Set Signal line period (default: 9) and MA type (EMA/SMA) for smoothing MACD.
  • Show Plots: Toggle visibility and widths (0-5) for MACD lines, Signal line, Histogram, and Cross Dots.
  • Trend Colors: Enable/disable trend-based coloring for MACD lines (green for up, red for down) or use a single color.
  • Histogram Colors: Customize colors for growing/falling histograms above (teal/bisque) and below (crimson/light pink) zero.
  • Alerts/Notifications: Enable alerts, email, or mobile notifications for MACD crosses (buy/sell) and zero-line conditions.
Disclaimer

This indicator is provided for informational purposes only and does not constitute financial advice. Past performance calculated using historical data does not guarantee future results, and trading involves risk of loss. Always test the product in a demo account, combine it with appropriate risk management, and consult a professional advisor if necessary. The developer assumes no liability for any trading decisions made based on this tool. Translations are available via MQL5 tools for global accessibility.

レビュー 1
cham
914
cham 2026.03.20 12:38 
 

Всё бы ничего , только почему-то когда приходит время сигнала , алерт представляет из себя повторяющуюся продолжительное время какафонию , которая через несколько секунд начинает раздражать . А идея была хорошей

おすすめのプロダクト
SuperTrend Indicator for MetaTrader 5 Ride Trends Like a Pro — Never Miss a Move Again Description: The SuperTrend Indicator is your ultimate companion for mastering trend-following strategies. Designed to cut through market noise, this powerful tool combines the precision of Average True Range (ATR) with adaptive trailing stops to pinpoint trend reversals, confirm breakouts, and keep you on the right side of the market. Whether you’re trading forex, stocks, crypto, or commodities, the SuperTr
FREE
VolumeBasedColorsBars — Free Powerful Volume Analysis for All Traders Unlock the hidden story behind every price bar! VolumeBasedColorsBars is a professional-grade, 100% FREE indicator that colorizes your chart candles based on real, adaptive volume analysis. Instantly spot surges in market activity, identify exhaustion, and catch the moves that matter. This indicator gives you:    • Dynamic color-coded bars for instant volume context    • Adaptive thresholds based on historical, session-awar
FREE
Original MACD
Kirill Paskhin
4.86 (7)
Moving Average Convergence/Divergence — схождение/расхождение скользящих средних — технический индикатор, разработанный Джеральдом Аппелем (Gerald Appel), используемый в техническом анализе для проверки силы и направления тренда, а также определения разворотных точек. Встроенный в MetaTrader 5 индикатор MACD не соответствует задумке автора (Gerald Appel): -линия MACD графически изображена в виде гистограммы, однако гистограммой отражается разница между линией MACD и сигнальной линией;  -сигнальн
FREE
==============================================================================                     DIVERGENCE HUNTER PRO v2.01          Advanced Multi-Oscillator Divergence Detection System ============================================================================== OVERVIEW Divergence Hunter Pro is a professional-grade divergence detection indicator  that automatically identifies high-probability trading oppor
FREE
This is an ordinary MACD indicator displayed in the main window according to the selected chart style, i.e. Bars, Candlesticks or Line. When you switch the chart type, the indicator display also changes. Unfortunately I could not improve the chart type switching speed. After switching, there are delays before the arrival of a new tick. The indicator parameters Fast EMA period Slow EMA period Signal SMA period Applied price
FREE
PZ Multi TDI MT5
PZ TRADING SLU
4.85 (13)
All-in-one trading powerhouse: trend, reversal, and exhaustion detection This indicator is a personal implementation of the famous Traders Dynamic Index, which uses RSI, moving averages and volatility bands to find trends, reversals and price exhaustions. However, this particular implementation supports not only RSI, but many others. It is suitable for scalping, day trading, and swing trading and aims to provide a full picture of the current market conditions. [ Installation Guide | Update Guid
FREE
MACD indicators https://mql5.com This MACD indicator looks slightly different from the MACD indicator found in many other charting software. When the value of the signal line parameter is greater than the value of the MACD parameter, the indicator will give a buy prompt, and when the signal line parameter is less than the value of the MACD parameter, the indicator will give a sell prompt.
FREE
ほとんどの「即時RSIダイバージェンス」シグナルは間違っています RSIダイバージェンスのインジケーターを使用したことがある方は、恐らくこうした経験をしたことがあるでしょう。 リアルタイムでダイバージェンスが表示され、一瞬は正しいように見えますが、 数本のローソク足が経過すると消えてしまいます。 後でチャートを確認すると、過去のシグナルが最初に見たものと一致しなくなっています。 これはユーザーの操作ミスではありません。 論理的な問題です。 確認されていない高値や安値に基づくダイバージェンスは、本質的に不安定です。 過去の履歴を書き換えないRSIダイバージェンスインジケーターを探している場合は、 この説明をぜひ最後までお読みください。 ———————————————————— インジケーター概要 このインジケーターは、RSIダイバージェンスを特定するために設計されており、即時の推測ではなく、確認済みの市場構造に基づいています。 価格とRSIの間の強気・弱気のダイバージェンスを自動的に検出し、RSIウィンドウ内に明確に表示します。 主な特徴: RSIダイバージェンス構造の自動検出 RSIウ
FREE
Pivot Points Indicator – a fast, reliable, and fully customizable pivot detection for MetaTrader 5. This indicator uses MetaTrader’s native iHighest and iLowest functions to identify pivot highs and lows by scanning for the highest and lowest prices within a user-defined window of bars. A pivot is confirmed only when the current bar is the absolute maximum or minimum within the selected range, ensuring accurate and timely signals based on robust built-in logic. Key Features No Repainting : Onc
FREE
The Commitments of Traders Ratio Indicator is one of these things you never thought about it before you really see the magic behind it. The indicator shows the Ratio of long/short positions released by the CFTC once a week. If you have a look on the Sreenshot you can see two (three) zones of interest. Important note: MAs are not available in version 1.0. Zone 1: The Switches (Red -> Green, Green -> Red) Zone 2: MA cross Zone 3: If you combine this with the COX indicator an additional zone will
FREE
Impulse MACD
Elie Baptiste Granger
5 (1)
The Impulse MACD is a technical indicator that combines the power of multiple moving averages to create a unique momentum oscillator. Unlike traditional MACD indicators, this tool uses three different moving averages applied to high, low, and weighted price data to generate more precise market impulse signals. Its strength is its excellent filtering capability during ranging markets. Visual Elements Color-coded Histogram : Dynamic green/red bars that change color based on momentum direction Sign
FREE
This indicator is a straight port of a well known MetaTrader 4 indicator that is freely available on the Internet. It does not redraw at all. It implements a type of breakout strategy. The arrows indicate market direction. Use the indicator on M15 charts and higher. The indicator draws two bands near price action and generates signals when the price closes below the lower band and also above the upper band. The indicator uses periodic highs and lows to calculate upper and lower threshold bands.
FREE
マルチタイムフレーム対応、カスタマイズ可能なビジュアル信号、設定可能なアラートシステムを備えた相対力指数(RSI)インジケーター。 フリーランスプログラミングサービス、アップデート、その他のTrueTL製品は私の MQL5プロフィール からご利用いただけます。 フィードバックとレビューを心よりお待ちしております! RSIとは? 相対力指数(RSI)は、価格変化の速度と大きさを測定するモメンタムオシレーターです。このインジケーターは0から100の間で振動し、指定された期間にわたって最近の上昇幅と最近の下落幅の大きさを比較します。 RSIは主に買われすぎと売られすぎの状態を識別するために使用されます。高い値は買われすぎ状態を示し、低い値は売られすぎ状態を示します。トレーダーはまた、RSIと価格動作の間のダイバージェンスにも注目しており、これは潜在的なトレンド転換を示す可能性があります。 機能: 矢印と垂直線を使用したビジュアルシグナルマーカー 設定可能なトリガー付きの3つの独立したシグナルバッファ(方向変化、レベル交差、ピーク/谷、極端ゾーン) 時間帯フィルタリング付きの設定可能なア
FREE
The   OHLC indicator   shows the current and historical values of High, Low, Open, Close and Mid for a specific time period. It can plot the current values or the values from the previous session. The indicator's range can be calculated from a daily, weekly, monthly, or user-specified session. Levels High  of the current or previous session. Low  of the current or previous session. Open  of current or previous session. Close  of the current or previous session. Midpoint  of the current or prev
FREE
A simple indicator showing the size of the spread at the current time, the maximum for the day and the maximum for the entire duration of the indicator. Daily statistics of the maximum spread are also displayed, indicating the time when this spread was fixed. The location of the display of the received information can be changed depending on your preferences and positioned anywhere on the screen. It is possible to output alerts about exceeding the size of the spread specified in the input pa
FREE
MACD Pro – MACD Indicator for MetaTrader 5 Description MACD Pro is a Moving Average Convergence Divergence (MACD) indicator for MetaTrader 5. It follows the standard MACD calculation method and displays trend direction and momentum in a separate indicator window. Indicator Elements MACD line based on the difference between fast and slow exponential moving averages Signal line calculated as an exponential moving average of the MACD line Histogram showing the difference between the MACD and signa
FREE
Realized Volatility Indicator Description The Realized Volatility Indicator measures the actual volatility observed in the market over a specified period. Unlike implied volatility (which is based on options pricing), realized volatility is based directly on historical price movements, offering a pure and objective view of market turbulence. This indicator can be used to: Assess market conditions, Optimize risk management, Fine-tune trading strategies based on volatility behavior. Key Features
FREE
Stochastic indicator alerts  when  EA Available in comments , must have indicator installed buys stochastic main line is above  signal line stochastic is below 30 rsi 5 is below 20 sell stochastic main line is below signal line stochastic is above 70 rsi 5 is above 80 ADD to chart  Stochastic k 30 - d 9 - slowing 3, levels 30/70 rsi 5 lelels 20.80 Full alerts  push, mobile , email ect All input settings variable  feel free to contact for more information or alert sugestions
FREE
This indicator displays buy or sell signals according to Bill Williams' definition of the Trading Zone. [ Installation Guide | Update Guide | Troubleshooting | FAQ | All Products  |  Get Help ] Easy to use and understand Avoid trading flat markets Deterministic indicator with clear rules The indicator is non-repainting It implements alerts of all kinds It has straightforward trading implications. A blue arrow is a buy signal A red arrow is a sell signal According to Bill Williams trading in t
FREE
FTU Qqe for MT5 Qs indicator for mt5 draws objects as arrows which is fine for manual trading but not reliable for EA/Algo Many arrow changes at certain times, so best to filter the signals using minimum one concept/logic Essentially an Rsi and moving average indicator - draws an arrow for suggestion of entry or change in trend The indicator is for MT5 platform, can be used stand alone >> best combined with other indicators and strategies New stable version coming soon Indicator Features: Sell
FREE
Heikin Ashi MACD
Wojciech Daniel Knoff
4.5 (4)
Check out my TRADE PLANNER MT5 – strongly recommended to anticipate account scenarios before risking any money. This is the moving average convergence divergence (MACD) indicator based on Heikin Ashi calculations. Here you find multi-colored histogram which corresponds to bull (green) / bear(red) trend. Dark and light colors describes weakness/strenght of price trend in time. Also you can switch calculations between normal and Heikin Ashi price type. Note: Buffers numbers for iCustom: 0-MACD,
FREE
MACD Titanium は、MetaTrader 5 用の Zero-Lag MACD インジケーターであり、従来の MACD と比較してより高速で明確なモメンタムシグナルを提供します。 Zero-Lag EMA 計算を使用することで、シグナルの遅延を軽減し、市場モメンタムの変化により迅速に反応します。同時に、トレーダーが慣れ親しんだ MACD の構造を維持します。 特徴 • Zero-Lag EMA を使用して遅延を削減 • モメンタム変化への高速反応 • クロスオーバーポイントを明確に表示 • 背景カラーで現在のモメンタム方向を可視化 • すべての時間足と銘柄に対応 リペイントなし。 すべてリアルタイム計算。 視覚構造 アクアライン – MACD オレンジライン – シグナル 緑ドット – 強気クロス 赤ドット – 弱気クロス 背景色 – 現在のモメンタム方向 緑 = 強気優勢 赤 = 弱気優勢 視認性を重視した設計です。 用途 • トレンド継続エントリー • モメンタム確認 • 早期クロス検出 • レンジ相場でのダマシ回避 • マルチタイムフレーム分析 FX、指数、暗号資産、
FREE
The MultiFrameTrendAnalyzer is a versatile MetaTrader 5 (MT5) indicator designed to provide multi-timeframe trend analysis using Moving Average (MA) crossovers. This indicator synchronizes trend signals across multiple timeframes (M1, M5, M15, M30, H1, H4, D1, W1, MN1) and displays them with intuitive visual cues, including a colored trend line, signal arrows, and a customizable dashboard. Features Multi-Timeframe Analysis : Evaluates trends across up to nine timeframes, allowing traders to conf
FREE
MultiClock
Achadi Hari Soebagio
Indicator Name: DualClockWithSignalTime.mq5 Description: The DualClockWithSignalTime is a custom MetaTrader 5 (MT5) indicator designed to display three pieces of real-time information directly on the chart: Broker Server Time Local Computer Time Last Signal Time (BUY/SELL) This indicator is helpful for traders who need to monitor both the broker's time and their own local time, ensuring better synchronization of trading actions. Additionally, it automatically detects and displays the latest BUY
FREE
インディケータはチャート上にトレンドラインを描画します。このインジケーターには6つの入力があります。ユーザーは両方の行に代替ラベルを指定できます。インジケーターの複数のインスタンスが使用される場合、ラベルは異なっている必要があります。ユーザーは、線の幅と色、および使用する重要なピークを指定する深さを設定できます。たとえば、Depth = 10は、現在の山と谷を使用してトレンドラインを設定します。この山と谷は、左右に少なくとも10本のバーがあり、高/低がピークの高/低よりも小さい/大きいです。インジケーターは、以前の山と谷もペイントします。インジケーターには、価格がサポート/レジスタンスラインから事前に設定された距離にあるときにユーザーに通知するために使用できるアラート機能が追加されています。アラート距離はピップで設定されます。
FREE
Auto Fibonacci Retracement Indicator — Flexible and Reliable This isn’t just another Auto Fibonacci Retracement indicator. It’s one of the most flexible and dependable tools available . If you find it useful, please consider leaving a review or comment — your feedback means a lot! Check out my other helpful tools below: Smart Alert Manager   - Set up advanced alerts and send them to Mobile, Telegram, Discord, Webhook... Timeframes Trend Scanner    - Scan the trend of assets in difference timefr
FREE
This Indicator works as a momentum oscillator however it is most used to surf the trends. Despite of being an oscillator, MACD (Moving Average Convergence/Divergence) doesn't work with over limit conditions (such as OverBought or OverSold). Graphically it's shown as two lines and an histogram with the diference of them. Standard metatrader has this indicator, however with only the two lines and without the histogram. This way it is much easier to read and uderstand it.
FREE
WPR Scalper Indicator for MetaTrader 5 Now for free! The WPR Scalper is a powerful indicator designed for traders seeking precise entry and exit signals based on the Williams %R oscillator. Optimized for volatile markets like BTCUSD on the H1 timeframe, it combines three Williams %R calculations (Fast, Slow, and Tortle) to identify overbought and oversold conditions with high accuracy. In the context of the WPR Scalper indicator, “Tortle” refers to a user-defined term for a third, slow Williams
FREE
This indicator displays breakouts on Point-And-Figure-like or Kagi-like custom symbol charts, generated by special expert advisers, such as PointFigureKagiCharts . This indicator is applicable only for custom instruments generated in appropriate way (with time-invariant bars which are multiples of a predefined box size). It makes no sense to apply it to other charts. The breakouts in up or down direction are marked by arrows. The breakout price is found at crossing of one of imaginary lines of
FREE
What It Does This indicator shows up to 5 moving averages from any higher timeframe on your current chart. Instead of switching timeframes to see the bigger picture, you get the trend information in one place. Example: Trading on 1-hour chart while displaying Daily moving averages to see the longer-term trend. Key Features Flexible Configuration Display up to 5 moving averages with individual enable/disable options Choose any higher timeframe as your source (4-hour, Daily, Weekly, Monthly, etc.)
FREE
このプロダクトを購入した人は以下も購入しています
ARIPoint is a powerful trading companion designed to generate high-probability entry signals with dynamic TP/SL/DP levels based on volatility. Built-in performance tracking shows win/loss stats, PP1/PP2 hits, and success rates all updated live. Key Features: Buy/Sell signals with adaptive volatility bands Real-time TP/SL/DP levels based on ATR Built-in MA Filter with optional ATR/StdDev volatility Performance stats panel (Success, Profit/Loss, PP1/PP2) Alerts via popup, sound, push, or email Cu
SuperScalp Pro
Van Minh Nguyen
4.63 (24)
SuperScalp Pro – 高度なマルチフィルタースキャルピングインジケーターシステム SuperScalp Pro は、クラシックな Supertrend と複数のインテリジェント確認フィルターを組み合わせた高度なスキャルピングインジケーターです。M1 から H4 まで複数の時間足で効率的に動作し、XAUUSD、BTCUSD、主要 Forex 通貨ペア向けに最適化されています。 このインジケーターは明確な Buy / Sell シグナルを提供し、ATR に基づいてエントリー価格、Stop Loss、Take Profit を自動計算します。Fibonacci Take Profit 機能により、重要な価格帯で早期決済し、到達時に通知を送信します。 初期設定では Fibonacci Take Profit が有効化されており、より安定した取引体験を重視しています。チャートに適用するだけですぐ利用可能です。上級者向けに、すべてのパラメータは自由にカスタマイズできます。 EMA、RSI、ADX、Volume、VWAP、Bollinger Bands、MACD Divergence な
このインジケーターを購入された方には、以下の特典を 無料 で提供しています: 各トレードを自動で管理し、ストップロスとテイクプロフィットを設定し、戦略ルールに基づいてポジションを決済する補助ツール 「Bomber Utility」 様々な銘柄に合わせたインジケーターの設定ファイル(セットファイル) 「最小リスク」、「バランスリスク」、「待機戦略」 の3つのモードで使用できる Bomber Utility 用の設定ファイル このトレーディング戦略をすぐに導入・設定・開始できる ステップバイステップのビデオマニュアル ご注意: 上記の特典を受け取るには、MQL5のプライベートメッセージシステムを通じて販売者にご連絡ください。 オリジナルのカスタムインジケーター 「Divergence Bomber(ダイバージェンス・ボンバー)」 をご紹介します。これは、MACDのダイバージェンス(乖離)戦略に基づいた 「オールインワン」型のトレーディングシステム です。 このテクニカルインジケーターの主な目的は、価格とMACDインジケーターの間に発生するダイバージェンスを検出 し、将来の価格の動きを示す
Gold Entry Sniper – ゴールドスキャルピング&スイングトレード用プロフェッショナル多時間足ATRダッシュボード Gold Entry Sniper は、XAUUSDや他の銘柄向けに正確な 売買シグナル を提供する、MetaTrader 5用の高度なインジケーターです。 ATRトレーリングストップロジック と 多時間足分析ダッシュボード を搭載し、スキャルピングからスイングトレードまで対応します。 主な特徴と利点 多時間足シグナル分析 – M1、M5、M15 のトレンドを同時表示。 ATRベースのトレーリングストップ – ボラティリティに応じて動的に調整。 プロ仕様のチャートダッシュボード – シグナル状況、ATRレベル、回帰線、売買方向を表示。 明確な売買マーカー – 自動矢印とテキストラベル。 エグジットアラートとトレード管理 – 利益確定のための自動検出。 完全カスタマイズ可能 – パネル位置、色、フォント、ATR/回帰設定を調整可能。 ゴールド(XAUUSD)に最適化 – M1〜M15のスキャルピングに最適、FXや指数、暗号資産にも対応。 Gold Entry
Entry In The Zone and SMC Multi Timeframe is a real-time 2-in-1 market analysis tool that combines market structure analysis and a No Repaint BUY / SELL signal system into a single indicator, built on Smart Money Concepts (SMC) — a widely adopted framework used by professional traders to understand market structure. This indicator helps you see the market more clearly, make decisions based on structure rather than guesswork, and focus on high-probability zones where price is more likely to react
SignalTech MT5 is an unique fully rule based trading system for EURUSD, USDCHF, USDJPY, AUDUSD, NZDUSD, EURJPY, AUDJPY, NZDJPY, CADJPY.  All the winning trades with chart setups are published on the comments page. 2026-05 2802 Pips (Until 05-15 NY Closed) 2026-04 2243 Pips 2026-03 2165 Pips 2026-02 2937 Pips 2026-01 2624 Pips 2025-12 1174 Pips It can generate signals with Buy/Sell Arrows and Pop-Up/Sound Alerts. Each signal has clear Entry and Stop Loss levels, which should be automatically flag
Power Candles V3 - 自己最適化型強弱インジケーター Power Candles V3は 、通貨や銘柄の強さを、適用されたすべてのチャート上で実行可能なトレードプランに変換します。単にローソク足を色分けするだけでなく、バックグラウンドでリアルタイムの自動最適化を実行し、目の前の銘柄に対して最適なストップロス、テイクプロフィット、およびシグナルの閾値を提示します。ワンクリックで実取引に適用でき、エントリーポイント、ストップロス、テイクプロフィットのラインが正確な価格位置にチャート上に表示され、方向性を示すアラートがリアルタイムで発動します。 このツールは、Stein Investmentsのエコシステムの一部です。  18種類以上のツールをすべて閲覧し、AIを活用したセットアップの推奨事項を入手し、  https://stein.investments でコミュニティに参加しましょう クローズしたバーごとに3,000回以上のトレードシミュレーション。9つの強さの状態。2つの戦略を並行してテスト。勝率の高い設定をワンクリックで適用。 なぜこれが必要なのか ほとんどの強
Gann Made Easy   は、ミスター・ギャンの理論を使用した取引の最良の原則に基づいた、プロフェッショナルで使いやすい外国為替取引システムです。 W・D・ガン。このインジケーターは、ストップロスとテイクプロフィットレベルを含む正確な買いと売りのシグナルを提供します。 PUSH通知を利用して外出先でも取引可能です。 ご購入後、取引方法の説明と優れた追加インジケーターを無料で入手するには、私にご連絡ください! おそらく、ギャンの取引手法についてはすでに何度も聞いたことがあるでしょう。通常、ギャンの理論は初心者のトレーダーだけでなく、すでにある程度の取引経験がある人にとっても非常に複雑なものです。なぜなら、ギャンの取引手法は理論的にはそれほど簡単に適用できるものではないからです。私はその知識を磨き、最良の原則を私の外国為替インジケーターに組み込むために数年を費やしました。 このインジケーターは非常に簡単に適用できます。必要なのは、それをチャートに添付し、簡単な取引推奨事項に従うだけです。このインジケーターは常に市場分析の仕事を行い、取引の機会を探します。適切なエントリーポイントを検
このインジケーターを購入すると、プロ仕様のトレードマネージャーを無料で差し上げます。 まず第一に、このトレーディングシステムがノンリペイント、ノンリドロー、ノンラグのインジケーターであることを強調する価値がある。これにより、手動取引とロボット取引の両方に理想的なものになっています。 オンラインコース、マニュアル、プリセットのダウンロード。 「スマートトレンドトレーディングシステム MT5」は、新規および経験豊富なトレーダー向けにカスタマイズされた包括的なトレーディングソリューションです。10以上のプレミアムインジケーターを組み合わせ、7つ以上の堅実なトレーディング戦略を備えており、多様な市場状況に対応する多目的な選択肢となっています。 トレンドフォロー戦略:トレンドを効果的に乗り越えるための正確なエントリーとストップロス管理を提供します。 リバーサル戦略:潜在的なトレンドの反転を特定し、トレーダーがレンジ相場を活用できるようにします。 スキャルピング戦略:高速で正確なデイトレードおよび短期取引のために設計されています。 安定性:すべてのインジケーターはノンリペイント、ノンリドロー、ノ
まず正直に言いましょう。 どんなインジケーターも、それ単体であなたを利益化させることはできません。もしそう言う人がいるなら、それは夢を売っているだけです。完璧な売買シグナル(矢印)を表示するインジケーターは、いくらでも“完璧に見せる”ことができます。正しい過去の区間を拡大して、勝ちトレードだけを切り取ればいいだけです。私たちはそれをしません。 SMC Intraday Formula はツールです。 市場構造を読み取り、最も高い確率の価格ゾーンを特定し、今この瞬間のスマートマネーの痕跡をシンプルな言葉で正確に示します。最終判断はあなたが行います。トレードを実行するのもあなたです。しかし今は「希望」ではなく「精度」でエントリーできます。 私たちはこのインジケーターを、ゴールド(XAUUSD)および主要FX通貨ペアで約3年間、日々のスキャルピングに使用してきました。M1、M5、M15、M30の主要ツールです。これは未来を予測しようとするのではなく、今まさに形成されている高確率セットアップを示し、その理由を説明します。 他のすべてのインジケーターと何が違うのか? ほとんどのトレーディングイ
ご紹介     Quantum Breakout PRO は 、ブレイクアウト ゾーンの取引方法を変革する画期的な MQL5 インジケーターです。 13年以上の取引経験を持つ経験豊富なトレーダーのチームによって開発されました。     クォンタム ブレイクアウト プロ   は、革新的でダイナミックなブレイクアウト ゾーン戦略により、あなたのトレーディングの旅を新たな高みに押し上げるように設計されています。 クォンタム ブレイクアウト インジケーターは、5 つの利益ターゲット ゾーンを備えたブレイクアウト ゾーン上のシグナル矢印と、ブレイクアウト ボックスに基づいたストップロスの提案を提供します。 初心者トレーダーにもプロのトレーダーにも適しています。 量子EAチャネル:       ここをクリック 重要!購入後、インストールマニュアルを受け取るためにプライベートメッセージを送ってください。 推奨事項: 時間枠: M15 通貨ペア: GBPJPY、EURJPY、USDJPY、NZDUSD、XAUUSD アカウントの種類: ECN、Raw、またはスプレッドが非常に低い R
Azimuth Pro
Ottaviano De Cicco
5 (7)
Azimuth Pro V2:MT5向けシンセティック・フラクタル構造分析と確認済みエントリー 概要 Azimuth Pro は Merkava Labs によるマルチレベルスイング構造インジケーターです。4つのネストされたスイングレイヤー、スイングアンカーVWAP、ABCパターン検出、3タイムフレーム構造フィルタリング、そして確定バーでの確認済みエントリー — 1つのチャートで、ミクロスイングからマクロサイクルまでを網羅するワークフロー。 これはブラインドシグナル製品ではありません。ロケーション、コンテキスト、タイミングを重視するトレーダーのための構造ファーストワークフローです。 V2発売記念オファー — Azimuth Pro V2をUSD 399で(次の100本)。最終価格:USD 499。 1. V2での変更点 シンセティック・マルチタイムフレームエンジン 上位タイムフレーム分析をMeridian Proと同じ独自のシンセティックアーキテクチャで一から再構築。よりクリーンなHTFコンテキスト、安定したライブ動作、従来のMTF同期問題なし。シンセティックエンジンは 固定比率タ
Meridian Pro
Ottaviano De Cicco
5 (2)
Meridian Pro 2.00:MT5向けプロ仕様マルチタイムフレーム・トレンドマトリクス Meridian Pro 2.00 は、MetaTrader 5 向けのプロ仕様の適応型トレンドマトリクスです。オリジナルの Meridian トレンドエンジン、クリーンなチャート ribbon、確定足ベースのシグナル矢印、8時間足 dashboard、Fuel momentum、weighted consensus、synthetic HTF processing、そしてチャート上に直接表示される上位足コンテキストラインを統合します。 目的はシンプルです。現在のトレンド、マルチタイムフレーム構造、強度、momentum、EA-ready 状態を、複数チャートに無関係なインジケータを重ねるのではなく、1つの整理された workflow で読むことです。 Meridian Pro の違い 1つの適応型エンジン - 同じ volatility-aware Meridian ロジックを M1 から W1 まで適用します。 Synthetic HTF architecture - 上位足行は下位足デ
まず第一に、この取引ツールはノンリペイント、ノンリドロー、ノンラグの指標であり、プロの取引に理想的ですことを強調する価値があります。 オンラインコース、ユーザーマニュアル、デモ。 スマートプライスアクションコンセプトインジケーターは、新米から経験豊富なトレーダーまで、非常 に強力なツールです。Inner Circle Trader AnalysisやSmart Money Concepts Trading Strategiesなど、20以上の有用な指標を1つに組み合わせています。このインジケーターはスマートマネーコンセプトに焦点を当て、大手機関の取引方法を提供し、彼らの動きを予測するのに役立ちます。 特に、流動性分析に優れており、機関がどのように取引しているかを理解しやすくしています。市場のトレンドを予測し、価格の動きを慎重に分析するのに優れています。機関の戦略とトレードを合わせることで、市場の動向についてより正確な予測ができます。このインジケーターは多目的であり、市場構造を分析し、重要な注文ブロックを特定し、さまざまなパターンを認識するのに優れています。 このインジケーター
FX Trend NG:次世代マルチマーケット・トレンドインテリジェンス 概要 FX Trend NG は、複数の時間足に対応したプロフェッショナル向けトレンド分析およびマーケット監視ツールです。 市場全体の構造を数秒で把握することができます。 複数のチャートを切り替える必要はありません。どの銘柄がトレンド中なのか、どこでモメンタムが弱まっているのか、そしてどの時間足で強い整合性があるのかを瞬時に確認できます。 ローンチ特別オファー – FX Trend NG を $30(6ヶ月) または $80 永久ライセンス でご利用いただけます。 すでに Stein Investments のユーザーですか? -> メッセージを送信 して、プライベートグループへアクセスしてください。 セットアップや詳細情報が必要ですか? -> Stein Investments 公式ページ をご覧ください。 1. FX Trend NG が他と異なる理由 3ステート・トレンドロジック ― Buy と Sell だけではない • 多くのインジケーターは Buy または Sell の2状態のみを表示します。
トレンド スクリーナー インジケーターでトレンド取引の力を解き放ちます。ファジー ロジックと複数通貨システムを活用した究極のトレンド取引ソリューションです。 ファジー ロジックを活用した革新的なトレンド インジケーターである Trend Screener を使用して、トレンド取引を向上させます。 これは、13 を超えるプレミアム ツールと機能、および 3 つの取引戦略を組み合わせた強力なトレンド追跡インジケーターであり、Metatrader をトレンド アナライザーにする多用途の選択肢となります。 期間限定オファー : トレンド スクリーナー インジケーターは、わずか 65 ドルで生涯ご利用いただけます。 (元の価格 50$ ) (オファー延長) Trend Screener の 100% 非再描画精度の揺るぎない精度を体験して、取引の決定が過去の価格変動の影響を受けないようにしてください。 マルチタイムフレームおよびマルチ通貨機能の多用途性を解放し、比類のない自信を持って外国為替、商品、暗号通貨、インデックスの世界を取引できるようにします。 Trend Screener の包括的な戦
多くの矢印インジケーターは、シグナルだけを表示して、その後の判断をすべてトレーダーに任せてしまいます。KT Alpha Hunter Arrows は、完整なトレードプランをチャート上に提示します。 各シグナル矢印が表示されるたびに、エントリーライン、ストップロス、4つのテイクプロフィット水準、そして現在の銘柄と時間足が今トレードに値するかどうかを示すリアルタイムのエッジ判定が、すでに描画された状態で表示されます。付属の Trade Manager EA は、あなたが手動でエントリーした後の実行管理を担当し、相場が荒れて判断がぶれやすい場面でも規律あるトレードを保ちやすくします。リペイントなし。確定足シグナルのみ。Forex、ゴールド、指数、その他あなたが取引するあらゆる銘柄に対応します。 主な機能 リペイントしない買い矢印と売り矢印を、足の確定後にのみ表示。 各シグナルに、エントリーライン、構造的ストップロス、4つのテイクプロフィット水準を表示。 Edge Dashboard が、現在のチャートで買いセットアップと売りセットアップを別々に評価。 判定システム:No Edge、Mar
GEM Signal Pro GEM Signal Pro は、MetaTrader 5 向けのトレンドフォロー型インジケーターです。より明確なシグナル、より整理されたトレードセットアップ、そして実用的なリスク管理をチャート上で確認したいトレーダーのために設計されています。 単純な矢印だけを表示するのではなく、GEM Signal Pro はトレード全体の考え方を、より見やすく分かりやすい形で表示します。条件が確認されると、インジケーターはエントリー価格、ストップロス、利確目標をチャート上に表示し、トレードセットアップをより効率的に確認できるようにします。 動作の仕組み このインジケーターは、まず内部ロジックに基づいて有効なシードシグナルを検出します。 確認条件が満たされると、GEM Signal Pro はチャート上に完全なセットアップを表示します。これにより、トレーダーはトレード構造をより明確に把握し、手作業による分析を減らすことができます。 チャート上のトレードレベル 確認済みシグナルに対して、GEM Signal Pro は以下を表示できます。 エントリー価格 ストップロス テ
これはMT5のインジケーターで、再描画なしで取引に参入するための正確なシグナルを提供します。 外国為替、暗号通貨、金属、株式、インデックスなど、あらゆる金融資産に適用できます。かなり正確な見積もりを提供し、取引を開始して終了するのに最適な時期を教えてくれます。1つのシグナルを処理しただけでインジケーターの元が取れた例の 動画 (6:22)をご覧ください。Entry PointsPro インジケーターの助けを借りたほとんどのトレーダーの最初の1週間の結果が改善しています。 Telegramグループ に登録してください。Entry Points Proインジケーターのメリットは次の通りです。 再描画のないエントリーシグナル 再描画されるインジケーターでは一度表示されたシグナルが削除されて大きな金銭的損失につながることがありますが、これと異なり、表示されて確認されたシグナルは消えることがありません。 エラーなしの取引開始 インジケーターアルゴリズムによって取引を開始する(資産を売買する)理想的な瞬間を見つけることができます。それを使用するすべてのトレーダーの成功率が向上します。 あら
このダッシュボードは、選択されたシンボルの最新の利用可能なハーモニックパターンを表示するので、時間を節約し、より効率的に /   MT4バージョン 。 無料インジケーター:   Basic Harmonic Pattern インジケーター列 Symbol : 選択したシンボルが表示されます。 Trend :   強気または弱気 Pattern : パターンの種類(ガートレー、バタフライ、バット、カニ、サメ、サイファー、ABCD) Entry : エントリー価格 SL: ストップロス価格 TP1: 1回目の利食い価格 TP2: 2回目の利食い価格 TP3:   3回目の利食い価格 Current price :   現在値 Age (in bars):    最後に描画されたパターンの年齢 主な入力項目 Symbols:   "28 Major Currency Pairs "または "Selected Symbols "から選択。 Selected Symbols:   カンマで区切られた監視したいシンボル("EURUSD,GBPUSD,XAUUSD")。ブローカーがペアに接
BTMM State Engine Pro is a MetaTrader 5 indicator for traders who use the Beat The Market Maker approach: Asian session context, kill zone timing, level progression, peak formation detection, and a multi-pair scanner from a single chart. It combines cycle state logic with a built-in scanner dashboard so you do not need the same tool on many charts at once. What it does Draws the Asian session range; session times can follow broker server offset or be set in inputs. Tracks level progression (L
Market Structure Order Block Dashboard MT5 は、市場構造と主要な価格反応ゾーンをチャート上で直接読み取りたいトレーダー向けに設計された MT5 インジケーターです。BOS、ChoCH、オーダーブロック、Fair Value Gap (FVG)、流動性、Kill Zones、Volume Profile、そして素早い分析のためのコンパクトなダッシュボードを組み合わせています。 本インジケーターは、市場構造、ICT、Smart Money の概念を意思決定の枠組みとして使用するトレーダーを対象としています。トレンド継続、反転の可能性、価格の不均衡、流動性ターゲット、注目ゾーンをより構造的に特定する助けとなります。 購入者向けの付属リソース 購入後、MQL5 のプライベートメッセージにてご依頼いただくと、完全な PDF ユーザーガイドとパラメータ設定のヒントを提供いたします。MQL5 のプライベートメッセージによる直接的な技術サポート。 バージョン 1.20 では 2 つの重要な追加機能があります: Pending BOS / Pending Cho
Trend Forecaster – Since 2023. The Trend Forecaster indicator utilizes a unique proprietary algorithm to determine entry points for a breakout trading strategy. The indicator identifies price clusters, analyzes price movement near levels, and provides a signal when the price breaks through a level. The Trend Forecaster indicator is suitable for all financial assets, including currencies (Forex), metals, stocks, indices, and cryptocurrencies. You can also adjust the indicator to work on any time
Quantum TrendPulse を ご紹介します。これは、   SuperTrend   、   RSI   、および Stochastic のパワーを 1 つの包括的なインジケーターに組み合わせて、取引の可能性を最大限に引き出す究極の取引ツールです。精度と効率を求めるトレーダー向けに設計されたこのインジケーターは、市場のトレンド、勢いの変化、最適なエントリー ポイントとエグジット ポイントを自信を持って特定するのに役立ちます。 主な特徴: SuperTrend 統合: 現在の市場動向に簡単に追従し、収益性の波に乗ることができます。 RSI精度: 買われすぎと売られすぎのレベルを検出し、市場の反転のタイミングに最適で、SuperTrendのフィルターとして使用されます。 確率的精度: 確率的振動を活用して、変動の激しい市場で隠れたチャンスを見つけます。SuperTrend のフィルターとして使用されます。 マルチタイムフレーム分析:   M5 から H1 または H4 まで、さまざまなタイムフレームで市場を常に把握します。 カスタマイズ可能なアラート: カスタム取引条件が満たされ
優れたテクニカルインジケーター「Grabber」をご紹介します。これは、すぐに使える「オールインワン」トレーディング戦略として機能します。 ひとつのコードに、市場のテクニカル分析ツール、取引シグナル(矢印)、アラート機能、プッシュ通知が強力に統合されています。 このインジケーターを購入された方には、以下の特典を無料で提供します: Grabberユーティリティ:オープンポジションを自動で管理するツール ステップバイステップのビデオマニュアル:インジケーターのインストール、設定、取引方法を解説 カスタムセットファイル:インジケーターをすばやく自動設定し、最大限の成果を出すための設定ファイル 他の戦略はもう忘れてください!Grabberだけが、あなたを新たなトレードの高みへと導いてくれるのです。 Grabber戦略の主な特徴: 推奨タイムフレーム:M5〜H4 対応通貨ペア・資産:どれでも使用可能ですが、私が実際に検証した以下を推奨します(GBPUSD、GBPCAD、GBPCHF、AUDCAD、AUDUSD、AUDSGD、AUDCHF、NZDUSD、NZDCAD、EURCAD、EURUSD、E
FX Power: 通貨の強弱を分析して、より賢い取引を実現 概要 FX Power は主要通貨と金の実際の強弱をあらゆる市場状況で理解するための必須ツールです。強い通貨を買い、弱い通貨を売ることで、 FX Power は取引の意思決定を簡素化し、高い確率の取引機会を見出します。トレンドを追従する場合でも、極端なデルタ値を使用して反転を予測する場合でも、このツールはあなたの取引スタイルに完全に適応します。ただ取引するだけではなく、 FX Power で賢く取引をしましょう。 1. なぜ FX Power がトレーダーにとって非常に有益なのか 通貨と金のリアルタイム強弱分析 • FX Power は主要通貨と金の相対的な強弱を計算し、マーケットダイナミクスに関する明確な洞察を提供します。 • どの資産がリードしているか、または後れを取っているかを監視して、取引するペアを賢く選びましょう。 マルチタイムフレームの包括的なビュー • 短期、中期、長期のタイムフレームで通貨と金の強弱を追跡し、マーケットトレンドに基づいて取引戦略を調整できます。 • スキャルピングからスイングトレード
まず第一に、この取引インジケーターは再描画されず、再描画されず、遅延しないことを強調する価値があります。これにより、手動取引とロボット取引の両方に理想的なものになります。 ユーザーマニュアル:設定、入力、戦略。 アトミックアナリストは、価格の強さとモメンタムを利用して市場でより良いエッジを見つけるためのPA価格アクションインジケーターです。ノイズや誤ったシグナルを除去し、取引ポテンシャルを高めるための高度なフィルターを備えています。複雑なインジケーターの複数のレイヤーを使用して、アトミックアナリストはチャートをスキャンし、複雑な数学的計算をシンプルなシグナルと色に変換します。これにより、どのような初心者トレーダーでも理解して使用し、一貫した取引の決定を行うことができます。 「アトミックアナリスト」は、新規および経験豊富なトレーダー向けにカスタマイズされた包括的な取引ソリューションです。プレミアムインジケーターとトップノッチの機能を1つの取引戦略に組み合わせ、すべてのタイプのトレーダーにとって汎用性のある選択肢にします。 デイリートレーディングとスキャルピング戦略:高速で正確なデイ
OrderFlux | MetaTrader 5 用フットプリント・オーダーフロー バージョン 2.0 – アクティブトレーダー向けのリアルタイム Bid/Ask 可視化 OrderFlux は MT5 用のフットプリントおよびオーダーフローインジケーターです。価格がどこに動いたかだけでなく、その動きの中で何が起きているか(各価格レベルの Bid/Ask ボリューム、デルタ、インバランス、ボリューム分布)を表示します。 多くのチャートはローソク足の最終結果しか表示しません。OrderFlux はそこに至るまでの過程を表示します。ローソク足の形状だけでなく、市場参加者の動向を読み取りたい場合にまさに役立ちます。 ライブチャートにおいて、OrderFlux は主に次の3つの質問に答えます: 現在、どこで積極的な買いまたは売りの圧力が市場に参入しているか? どの価格レベルでボリュームが吸収、または拒否されているか? 現在の動きはセッションのコンテキスト(背景)にどう適合しているか? インターフェースで得られるもの メインチャートは、Canvas ベースでフットプリントを直接レンダリングします
RelicusRoad Pro: 定量的市場オペレーティングシステム 【期間限定】無制限アクセス 70% OFF - 2,000人超のトレーダーと共に なぜ多くのトレーダーは「完璧な」インジケーターを使っても失敗するのでしょうか? それは、文脈を無視して 単一の概念 だけでトレードしているからです。文脈のないシグナルは単なるギャンブルです。勝ち続けるには、 根拠の重なり(コンフルエンス) が必要です。 RelicusRoad Proは単なる矢印インジケーターではありません。完全な 定量的市場エコシステム です。独自のボラティリティモデリングを用いて、価格が推移する「適正価値の道(Fair Value Road)」をマッピングし、ノイズと真の構造的ブレイクを判別します。 推測はやめましょう。機関投資家レベルの「ロード・ロジック」でトレードを。 コアエンジン:「Road」アルゴリズム システムの中心となる Road Algo は、市場環境にリアルタイムで適応するダイナミックなボラティリティチャネルです。 安全ライン(平衡点) と、価格が数学的に反転しやすい 拡張レベル を投影します。 Si
Hydra Trend Rider is a non-repainting, multi-timeframe trend indicator that delivers precise buy/sell signals and real-time alerts for high-probability trade setups. With its color-coded trend line, customizable dashboard, and mobile notifications, it's perfect for traders seeking clarity, confidence, and consistency in trend trading. Setup & Guide:  Download  MT4 Version here. To learn how to use the Indicator: Indicator Manual & Guide -   Read Here Follow our MQL5 channel for daily market ins
作者のその他のプロダクト
Multi Timeframe Buy and Sell Power The "Multi Timeframe Buy and Sell Power" indicator for MetaTrader 5 is a versatile tool designed to provide traders with a clear visual representation of market pressure across nine standard timeframes, from M1 to MN1. By aggregating buy and sell strength percentages derived from recent price action and tick volume, it helps identify potential trends, reversals, and neutral market conditions in real-time. The indicator displays this information in a compact da
FREE
UT Bot with Alerts The UT Bot Alerts Indicator for MetaTrader 5 is a versatile trading tool that generates buy and sell signals based on ATR-based trailing stop logic. It displays signals with arrows, draws an entry price line, and includes a candle countdown timer. The indicator offers customizable alerts (pop-up, email, push notifications) and a text label showing signal details. Users can adjust ATR sensitivity, label positions, and timer settings, making it suitable for various markets and
FREE
Simple Indicator that shows the Buy and Sell volume in percent. The Buy and Sell Power indicator for MetaTrader 5 calculates and displays estimated buy/sell volume percentages over a user-defined period (default: 14 bars) using tick volume data. It overlays text labels on the chart showing Buy % (with "Up" if >51%), Sell % (with "Dn" if >51%), and a trend signal based on thresholds: Neutral (<55%), Trend: Buy/Sell (55%+), Trend: Strong Buy/Sell (62%+), Trend Max UP/Down (65%+), or Trend change s
FREE
Apex Point is a trend-following indicator for MetaTrader 5, transforming complex market data into signals for traders. It displays blue dots for uptrends, red dots for downtrends, and yellow crosses at potential reversals, helping users identify momentum shifts quickly. Key features include a confirmation system requiring multiple bars (default: 3) to validate changes, reducing false signals; dynamic ATR-based offsets for adaptive trailing, with instant ratcheting in the trend direction and smo
Multi Timeframe Buy and Sell Power MT4 The Multi Timeframe Buy and Sell Power indicator for MetaTrader 4 is a versatile tool designed to provide traders with a clear visual representation of market pressure across nine standard timeframes, from M1 to MN1. By aggregating buy and sell strength percentages derived from recent price action and tick volume, it helps identify potential trends, reversals, and neutral conditions in real-time. The indicator displays this information in a compact dashbo
FREE
Vector Candles Indicator Vector Candles Indicator is a powerful MT5 tool designed for traders seeking advanced volume analysis and trend insights. It colors candles based on tick or real volume to highlight climax (exhaustion) and super climax (extreme spike) patterns, signaling potential reversals or continuations. Integrated features include 9 customizable EMAs (5-800 periods), Point of Control (POC) from volume profiles, daily pivot levels with midpoints, current day open/high/low lines, arro
FREE
Fibonacci MT5 Converted from MT4, Optimized MT5 Version. original MT4 code by Awran5. Non-Repainting Fibonacci Tool for MT5. Fibonacci indicator with a stable non-repainting swing detection engine. Support and questions via MQL5 product comments. For questions, updates, and to connect with other traders, join my official   MQL5 group ForexEAandMore Main Functions Custom Swing Detection Uses proprietary Reverse-Scan plus Peak-Climbing algorithm to find reliable swing highs and lows without repai
FREE
Buy and Sell ATR Indicator updated version 1.2 (2026) ATR-based trend indicator with visual signals, dynamic support/resistance, and TP/SL levels. This indicator identifies market trends using an ATR channel and displays clear Buy and Sell signals.  It draws a dynamic trend line that changes color (green for uptrend, red for downtrend), shows arrows for entries, and plots the latest Take Profit and Stop Loss levels directly on the chart. Detailed Description in the comments post 2. Set files in
FREE
Multi Timeframe Buy and Sell Power Pro MT5 The "Multi Timeframe Buy and Sell Power Pro" indicator for MetaTrader 5 is a versatile tool designed to provide traders with a clear visual representation of market pressure across nine standard timeframes, from M1 to MN1. By aggregating buy and sell strength percentages derived from recent price action and tick volume, it helps identify potential trends, reversals, and neutral market conditions in real-time. The indicator displays this information in a
This is the MT5 converted Version of the The MA Filling Indicator, developed by Scriptong, is an advanced technical analysis tool designed for MetaTrader 4 (MT4) that enhances the traditional Moving Average (MA) indicator by incorporating a visually intuitive filling feature. The MA Filling Indicator is a versatile tool suitable for both novice and experienced traders seeking to enhance their trend-following strategies with a clear, color-coded representation of market dynamics. Support and ques
FREE
Trade Hunter MT5 - Buy and Sell Indicator This powerful indicator identifies potential buy and sell signals by analyzing price movements over a customizable period. Blue arrows mark buy opportunities below key lows, while red arrows highlight sell signals above critical highs. With adjustable parameters like bar range, percentage offset, and alert settings, Trade Hunter adapts to your strategy. Optional alerts and notifications ensure you never miss a signal. Perfect for traders seeking a reli
FREE
Buffer Finder MT5 Is a custom technical Utility for MetaTrader 5, designed to inspect and analyze buffers of other indicators for EA integration, signal detection, or debugging. Support and questions via MQL5 product comments. For questions, updates, and to connect with other traders, join my official   MQL5 group ForexEAandMore Key Features User-Friendly Dashboard : Input an indicator name and click "Search" to scan the chart or load it dynamically via iCustom from standard folders (Indicator
FREE
Support Resistance Channel MT5 The Support Resistance Channel MT5 indicator plots dynamic support and resistance levels based on a configurable lookback period, displaying them as green and red lines respectively. It optionally shows goldenrod-colored arrows when price touches these levels, indicating potential trend changes (not explicit buy/sell signals) , along with customizable "RES" and "SUP" labels. With adjustable parameters like lookback period, arrow size, and label offset, it offers t
FREE
Simple Indicator that shows the   Buy and Sell   volume in percent. Support and questions via MQL5 product comments. For questions, updates, and to connect with other traders, join my official   MQL5 group ForexEAandMore Settings : Font size for percentage labels Horizontal offset from right edge (pixels) Vertical offset for Signal label from bottom (pixels) Vertical offset for Buy label from bottom (pixels) Vertical offset for Sell label from bottom (pixels) Color for Buy label Color for Sell
FREE
Occult Oracle MT5 is a powerful trend-following indicator designed for MetaTrader 5, helping traders identify market directions. It features a dynamic colored step line (red for downtrends, blue for uptrends) that adapts to price action using optimized amplitude periods, with optional auto-optimization for maximum profitability based on historical simulation. The Occult Oracle MT5 indicator is fully configurable, allowing traders to customize amplitude settings (manual or auto-optimized), arrow
Pro Panel The Pro Panel EA is a user-friendly, draggable graphical interface for MetaTrader 5, designed to streamline trading operations. It features editable fields for lot size, take profit (TP) and stop loss (SL) in points, and trailing stop parameters (start and step). Key buttons allow quick opening of buy or sell positions, as well as closing all buys or sells, with options to filter by the EA's magic number or include manual trades (e.g., from the MT5 mobile app). Toggles enable/disable
Apex MTF Panel A clean, standalone multi-timeframe RSI/MACD dashboard that instantly shows buy, sell, or neutral confluence signals across your chosen timeframes in a compact horizontal layout. TF names sit directly above signals with matching colors for instant readability. Fully customizable signal colors, live font-size adjustment, corner positioning, and smart “loading” state ensure performance on any chart. Support and questions via MQL5 product comments. For questions, updates, and to conn
FREE
Show Label
Marco Engstermann
4.5 (2)
Show Label Show your profit or loss next to the candle. This is a helpful tool if an EA don't have this feature build in. Support and questions via MQL5 product comments. For questions, updates, and to connect with other traders, join my official   MQL5 group ForexEAandMore Settings: Font color Background color for profits Background color for losses Font size Horizontal shift from candle (pixels) Vertical shift from candle high/low (pixels) Magic number filter (0 = all trades) Comment filter
FREE
Trend Dot Indicator A fast-reacting Trend Step Regression (TSR) line with color-coded dots instantly shows the current trend. Buy and sell signals appear only when a real reversal occurs, confirmed by minimum trend length and ADX strength. Visit my MQL5 blog profile to read the full guide. Support and questions via MQL5 product comments. For questions, updates, and to connect with other traders, join my official   MQL5 group ForexEAandMore Features: Clear visual TSR line + dots (blue = up, red
Trend Dot Indicator MT5 A fast-reacting Trend Step Regression (TSR) line with color-coded dots instantly shows the current trend. Buy and Sellsignals appear only when a real reversal occurs, confirmed by minimum trend length and ADX strength. Visit my MQL5 blog profile to read the full guide. Support and questions via MQL5 product comments. For questions, updates, and to connect with other traders, join my official   MQL5 group ForexEAandMore Features: Clear visual TSR line  Filtered reversal
Multi-Symbol Trend Indicator for MT5 The "Multi-Symbol Trend Indicator" for MT5is a customizable dashboard tool that monitors trends across multiple symbols (e.g., XAUUSD, EURUSD) using MACD, ADX, and RSI for direction, strength, and confirmation. It classifies trends as bullish, bearish, or sideways, draws colored trend lines on the chart, displays daily high/low with Fibonacci retracements, detects points of interest (POIs) via swing highs/lows, and sends alerts/notifications for changes or
フィルタ:
cham
914
cham 2026.03.20 12:38 
 

Всё бы ничего , только почему-то когда приходит время сигнала , алерт представляет из себя повторяющуюся продолжительное время какафонию , которая через несколько секунд начинает раздражать . А идея была хорошей

Marco Engstermann
16005
開発者からの返信 Marco Engstermann 2026.03.30 04:35
Я это проверю. Thank you Теперь проблема с предупреждением должна быть решена.
レビューに返信