パブリッシュされたプロダクト

Stochastic RSI with Candle Patterns
This indicator is based on the Stochastic oscillator applied to the Relative Strength Index (RSI). It is designed to help traders visually identify the main long-term trend while generating entry signals in overbought and oversold zones. Support and questions via MQL5 product comments. Added in Version 1.3 Candle Patterns. A B C , Engulfing, Hammer, ShootingStar, Doji' A B C Pattern Multi Timeframe Alert, Alert on Candle Patterns. Version 1.4: New input: The
FREE
Multi Timeframe Buy and Sell Power
The "Multi Timeframe Buy and Sell Power" indicator for MetaTrader 5 is a versatile tool designed to provide traders with a clear visual representation of market pressure across nine standard timeframes, from M1 to MN1. By aggregating buy and sell strength percentages derived from recent price action and tick volume, it helps identify potential trends, reversals, and neutral market conditions in real-time. The indicator displays this information in a compact da
FREE

ForeCastX AI
はMetaTrader 5用のチャートインジケーターです。スイングに基づくトレンド着色、売買矢印、サプライ/デマンドゾーン、複数時間足の売買パワーパネル、任意の投影パスを表示します。 投影パスは直近の構造とパネル値から描く視覚的な線です。価格予測ではなく、単独の売買シグナルでもありません。 チャート表示 現在のスイングトレンドでローソク足を着色 確定したスイング高値または安値のブレイクで矢印 強度ラベル付きのサプライ/デマンド矩形 選択した時間足の売買パワーバーと平均行 投影セグメントはバイアス方向の最寄りゾーン付近で止まる場合があります アラート ポップアップ、プッシュ、メール、サウンドを有効にできます。確定足のみの設定では、形成中の足ではアラートしません。 EA向け 非表示バッファ:+1 上昇、-1 下降、0 なし。 注意 チャート分析用です。注文は出しません。過去の形状は将来の結果を示すものではありません。ご自身のルールとリスク管理と併用してください。 MQL5グループ: https://www.mql5.com/en/messages/03590900

Buy and Sell ATR Indicator updated version 1.2 (2026)
ATR-based trend indicator with visual signals, dynamic support/resistance, and TP/SL levels. This indicator identifies market trends using an ATR channel and displays clear Buy and Sell signals. It draws a dynamic trend line that changes color (green for uptrend, red for downtrend), shows arrows for entries, and plots the latest Take Profit and Stop Loss levels directly on the chart. Detailed Description in the comments post 2. Set files in
FREE

UT Bot with Alerts The UT Bot Alerts Indicator for MetaTrader 5 is a versatile trading tool that generates buy and sell signals based on ATR-based trailing stop logic. It displays signals with arrows, draws an entry price line, and includes a candle countdown timer. The indicator offers customizable alerts (pop-up, email, push notifications) and a text label showing signal details. Users can adjust ATR sensitivity, label positions, and timer settings, making it suitable for various markets and
FREE
Multi Timeframe Buy and Sell Power MT4
The Multi Timeframe Buy and Sell Power indicator for MetaTrader 4 is a versatile tool designed to provide traders with a clear visual representation of market pressure across nine standard timeframes, from M1 to MN1. By aggregating buy and sell strength percentages derived from recent price action and tick volume, it helps identify potential trends, reversals, and neutral conditions in real-time. The indicator displays this information in a compact dashbo
FREE
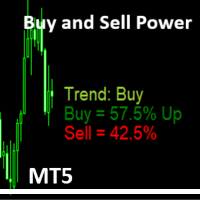
Simple Indicator that shows the Buy and Sell volume in percent.
The Buy and Sell Power indicator for MetaTrader 5 calculates and displays estimated buy/sell volume percentages over a user-defined period (default: 14 bars) using tick volume data. It overlays text labels on the chart showing Buy % (with "Up" if >51%), Sell % (with "Dn" if >51%), and a trend signal based on thresholds: Neutral (<55%), Trend: Buy/Sell (55%+), Trend: Strong Buy/Sell (62%+), Trend Max UP/Down (65%+), or Trend change s
FREE

Multi-Symbol Trend Indicator for MT5
The "Multi-Symbol Trend Indicator" for MT5is a customizable dashboard tool that monitors trends across multiple symbols (e.g., XAUUSD, EURUSD) using MACD, ADX, and RSI for direction, strength, and confirmation. It classifies trends as bullish, bearish, or sideways, draws colored trend lines on the chart, displays daily high/low with Fibonacci retracements, detects points of interest (POIs) via swing highs/lows, and sends alerts/notifications for changes or
FREE
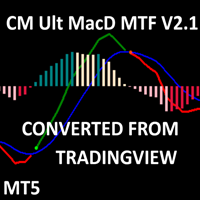
CM MACD Custom Indicator - Multiple Time Frame (V2.1) This advanced MT5 indicator, adapted from ChrisMoody’s TradingView script, delivers a powerful Multi-Timeframe MACD with customizable visuals and alerts. Plotting MACD lines, signal line, and a color-coded histogram, it highlights trend direction and momentum with distinct colors for growing/falling histograms above/below zero. Cross signals are marked with arrows, and users can enable alerts, email, or mobile notifications for buy/sell oppo
FREE

Apex Point
is a trend-following indicator for MetaTrader 5, transforming complex market data into signals for traders. It displays blue dots for uptrends, red dots for downtrends, and yellow crosses at potential reversals, helping users identify momentum shifts quickly. Key features include a confirmation system requiring multiple bars (default: 3) to validate changes, reducing false signals; dynamic ATR-based offsets for adaptive trailing, with instant ratcheting in the trend direction and smo
FREE

Vector Candles Indicator Vector Candles Indicator is a powerful MT5 tool designed for traders seeking advanced volume analysis and trend insights. It colors candles based on tick or real volume to highlight climax (exhaustion) and super climax (extreme spike) patterns, signaling potential reversals or continuations. Integrated features include 9 customizable EMAs (5-800 periods), Point of Control (POC) from volume profiles, daily pivot levels with midpoints, current day open/high/low lines, arro
FREE

Fibonacci MT5 Converted from MT4, Optimized MT5 Version. original MT4 code by Awran5. Non-Repainting Fibonacci Tool for MT5. Fibonacci indicator with a stable non-repainting swing detection engine. Support and questions via MQL5 product comments. For questions, updates, and to connect with other traders, join my official MQL5 group ForexEAandMore
Main Functions Custom Swing Detection Uses proprietary Reverse-Scan plus Peak-Climbing algorithm to find reliable swing highs and lows without repai
FREE

Trade Hunter MT5 - Buy and Sell Indicator
This powerful indicator identifies potential buy and sell signals by analyzing price movements over a customizable period. Blue arrows mark buy opportunities below key lows, while red arrows highlight sell signals above critical highs. With adjustable parameters like bar range, percentage offset, and alert settings, Trade Hunter adapts to your strategy. Optional alerts and notifications ensure you never miss a signal. Perfect for traders seeking a reli
FREE
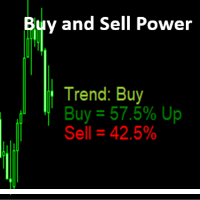
Simple Indicator that shows the Buy and Sell volume in percent. Support and questions via MQL5 product comments. For questions, updates, and to connect with other traders, join my official MQL5 group ForexEAandMore
Settings : Font size for percentage labels Horizontal offset from right edge (pixels) Vertical offset for Signal label from bottom (pixels) Vertical offset for Buy label from bottom (pixels) Vertical offset for Sell label from bottom (pixels) Color for Buy label Color for Sell
FREE

Dead Candle Theory – DCT – Signal Scanner
Dead Candle Theory(DCT)シグナル、オーダーブロック、SuperTrend、コンフルエンスフィルターのマルチタイムフレームスキャナー。 Dead Candle Theory(DCT)とは?
DCT はスイング内で最も極端な足を「デッドキャンドル」とします。最安値(買い起点)または最高値(売り起点)です。後続足の実体がその外側レベルをブレイクしたときだけ、その足は「死んだ」とみなされます。Close モードではヒゲだけではカウントしません。 BUY DCT: 最安値の足を追跡します。後続の陽線がその足の高値より上で終値を付けなければなりません。起点レンジ(高値−安値)もスイングサイズフィルターを満たす必要があります。 SELL DCT: 最高値の足を追跡します。後続の陰線がその足の安値より下で終値を付けなければなりません。同じスイングサイズ規則です。 任意の Touch モードは、レベルのヒゲ/タッチがあれば発火できます(形成中の足も含む)。デフォルトの Close モードは実体で

Dual Symbol Bars
は、チャートと同じ時間足・同じ時間軸で、2つ目のシンボルをローソク足として専用サブウィンドウに描画します。 任意の2つ目のシンボルを、チャートの時間に合わせたローソク足として別ウィンドウに表示します。ゴールドとドル指数の並べ表示や、ブローカーが提供する他の通貨ペアに使えます。 Dual Symbol Bars はメインチャートの下に2つ目のローソク足チャートを追加します。両方のウィンドウは同じ時間足と同じ始値時刻を使うため、別チャートを開かずに2銘柄を比較できます。 例: メインが XAUUSD、ペインがドル指数。シンボルは固定ではありません。ペインに表示するシンボルへ、ブローカーの正式名称を入力してください。その名称がない場合、一般的なドル指数名(USDIndex、USDX、DXY など)も探します。 各バーは始値時刻で対応付けます。陽線(終値が始値以上)は陽線色、陰線は陰線色を使います。ヒゲ、実体、枠線の色は別々に設定できます。シンボル名はペインに表示されます。サーバーに名称がない場合、ラベルに見つからない旨が出ます。 設定項目: ペインに表示する
FREE

Apex MTF Panel
A clean, standalone multi-timeframe RSI/MACD dashboard that instantly shows buy, sell, or neutral confluence signals across your chosen timeframes in a compact horizontal layout. TF names sit directly above signals with matching colors for instant readability. Fully customizable signal colors, live font-size adjustment, corner positioning, and smart “loading” state ensure performance on any chart. Support and questions via MQL5 product comments. For questions, updates, and to conn
FREE

Multi Timeframe Buy and Sell Power Pro MT5
The "Multi Timeframe Buy and Sell Power Pro" indicator for MetaTrader 5 is a versatile tool designed to provide traders with a clear visual representation of market pressure across nine standard timeframes, from M1 to MN1. By aggregating buy and sell strength percentages derived from recent price action and tick volume, it helps identify potential trends, reversals, and neutral market conditions in real-time.
The indicator displays this information in a

Buffer Finder MT5
Is a custom technical Utility for MetaTrader 5, designed to inspect and analyze buffers of other indicators for EA integration, signal detection, or debugging. Support and questions via MQL5 product comments. For questions, updates, and to connect with other traders, join my official MQL5 group ForexEAandMore Major update in Version 1.2 All update Infos in the first comment. You can check now the indicator directly without loading in the chart by filling the exact indicator
FREE

Tick History Check
ブローカーのティック履歴を日ごとに取得し、ティック数、最初と最後のティック時刻、保存されたベースラインとの変化を表示するダッシュボードパネルです。ブローカーによるティックリセットの疑いを警告し、イベントログを保持します。 インジケーターは最大30サーバー日(今日を含む)をチェックします。平日ごとに CopyTicksRange でティックを要求し、以前に保存した最高値( MQL5\Files 内のサーバー+シンボルごとのCSV)と比較します。 設定した割合(デフォルト10%)を超えて減少した場合、その日は DROP! とマークされ、オプションでアラートが表示されます。空の平日、同期中の日、週末は明確に表示されます。
Manual/Description here. For questions, updates, and to connect with other traders, join my official MQL5 group ForexEAandMore
パネル機能 ステータス概要(判定、シンボル/サーバー、M1同期、ライブフィ
FREE

Support Resistance Channel MT5 The Support Resistance Channel MT5 indicator plots dynamic support and resistance levels based on a configurable lookback period, displaying them as green and red lines respectively. It optionally shows goldenrod-colored arrows when price touches these levels, indicating potential trend changes (not explicit buy/sell signals) , along with customizable "RES" and "SUP" labels. With adjustable parameters like lookback period, arrow size, and label offset, it offers t
FREE
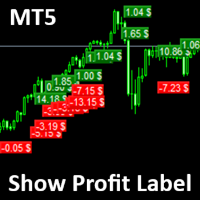
Show Label
Show your profit or loss next to the candle. This is a helpful tool if an EA don't have this feature build in. Support and questions via MQL5 product comments. For questions, updates, and to connect with other traders, join my official MQL5 group ForexEAandMore
Settings: Font color Background color for profits Background color for losses Font size Horizontal shift from candle (pixels) Vertical shift from candle high/low (pixels) Magic number filter (0 = all trades) Comment filter
FREE
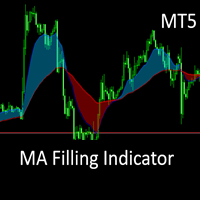
This is the MT5 converted Version of the The MA Filling Indicator, developed by Scriptong, is an advanced technical analysis tool designed for MetaTrader 4 (MT4) that enhances the traditional Moving Average (MA) indicator by incorporating a visually intuitive filling feature. The MA Filling Indicator is a versatile tool suitable for both novice and experienced traders seeking to enhance their trend-following strategies with a clear, color-coded representation of market dynamics. Support and ques
FREE

Arrow Master
は MetaTrader 5 のチャートウィンドウ用インジケーターです。3層のカラーリボンでトレンド方向を表示し、必要に応じて売買矢印も描画します。 リボンは HalfTrend 型の反転ロジックです。Arrow Pulse 期間の高値・安値の移動平均と、価格単位の Arrow Shield を用います。条件成立で色が変わり、矢印を出せます。同じロジックをチャート時間足とマルチタイムフレーム表示に使います。 チャート上の機能: 太さの異なる3本のカラーライン 任意の上下矢印 現在シグナルのみの ATR エントリー / TP / SL ゾーン(価格が TP または SL に達すると削除) 任意ダッシュボード: 状態、シグナル価格と時刻、現在トレンドのバー数、M15 / H1 / H4 / D1、買い/売り比率バー 任意アラート: Alert、サウンド、メール、プッシュ 主な入力: DrawArrow、ArrowPulse、ArrowShield、Alerts グループ、ShowDashboard と位置、ShowATRZones、ATR_SLMultiplier

Trend Cloud PRO Trend Cloud PRO は、長期 SMA(デフォルト期間 96)と遅い Stochastic RSI(RSI + Stochastic 長さ + K/D 平滑化、デフォルトはすべて 96 / 30 / 6)を組み合わせ、トレンド方向とモメンタムを可視化します。
Trend Cloud Pro EA here: Trend Cloud Pro EA MT5
Manual/Description here. For questions, updates, and to connect with other traders, join my official MQL5 group ForexEAandMore
表示要素 SMA ライン — メインのトレンド基準。 クラウド塗りつぶし — Stochastic RSI の %K と %D の関係に応じて色が変わります: ティール = %K が %D より上 オレンジ = %K が %D より下 価格と SMA の距離が現在の動きのピークに対して縮小すると、色が自動的に薄くなります。 確定クロス矢

Midas Gold Weaver EA MT5
ゴールド向けのマルチタイムフレーム・トレンドEAです。段階的な追加エントリー、ニュースフィルター、口座保護機能を備えています。 詳細説明
Midas Gold Weaver EA は MetaTrader 5 用のエキスパートアドバイザーです。XAUUSD などのゴールド銘柄向けに設計されています。複数時間足でのトレンド確認と、最初のポジションから距離を広げながら追加エントリーするオプションを組み合わせています。 最初のポジションは、選択したシグナルが許可された売買方向と一致したときだけ開きます。標準の内蔵モードでは、EA が複数の時間足を読み取ります。価格が上昇中の移動平均より上ならその時間足は上昇、下降中の移動平均より下なら下降と判定します。十分な数の時間足が一致したときに新しいシリーズを開始できます。任意のフィルターにより、ボラティリティが低い場合や、モメンタムがすでに伸び切っている場合はエントリーを止められます。 最初のポジションの後、価格がバスケットに対して設定距離だけ逆行すると、同じ方向の追加ポジションを出せます。距離は

Occult Oracle MT5
は MetaTrader 5 のチャートウィンドウ用トレンドインジケーターです。2色のトレンドラインを描画し、色が切り替わったときに買い/売り矢印を表示できます。 ラインは High / Low の単純移動平均と、期間内の最高値/最安値ウィンドウから計算します。このウィンドウ長を Amplitude と呼びます。Amplitude は各時間足(M1~MN1)で手動設定するか、指定した過去区間のシミュレーションで自動選択できます。自動モードはパラメータ選択の補助であり、将来の結果を予測するものではありません。
Official MQL5 group ForexEAandMore
その他の機能: EA 用 Signal バッファ(1 = 買い、-1 = 売り、0 = なし) チャート右側に表示する上位足ローソク(任意)。変化率と時間足名付き 当日高値・当日安値およびクラシックピボット(Pivot、R1、R2、S1、S2)のラベル(任意) ダッシュボード(任意):現在のトレンド、現行足の残り時間、直近シグナルの価格と時刻、その後の価格変化、上位足

Pro Panel
The Pro Panel EA is a user-friendly, draggable graphical interface for MetaTrader 5, designed to streamline trading operations. It features editable fields for lot size, take profit (TP) and stop loss (SL) in points, and trailing stop parameters (start and step). Key buttons allow quick opening of buy or sell positions, as well as closing all buys or sells, with options to filter by the EA's magic number or include manual trades (e.g., from the MT5 mobile app). Toggles enable/disable

Trend Cloud PRO EA
Trend Cloud PRO EAは、Trend Cloud PROインジケーターのシグナルに基づいて取引を行うエキスパートアドバイザーです。 バスケットを開き、それを一つの単位として管理します。新しいトレードは動きの方向(フォワードグリッド)と逆方向(リカバリー)に追加できます。 バスケット全体が一緒に決済されます。個別トレードのテイクプロフィットはありません。 黄色の弱化クロスは新しいフォワード追加を一時停止できます。 カウンタートレンドのRSIダイバージェンス(数本のバーにわたって保持)はバスケットを決済し、リカバリーを停止できます。 オプションのヘッジは調整可能な数の反対トレードを開きます(メインバスケットにはカウントされません)。 ヘッジはカウンターダイバージェンスおよび/または極端なオーバーボート/オーバーソールドを条件にできます。 グリッドとリカバリーにはヘッジ口座が必要です。 ネッティング口座ではEAは1トレードのみ開きます。
購入後すぐにご連絡ください。ボーナスとして Trend Cloud Pro インジケーターを差し上げ

Trend Dot Indicator MT5 A fast-reacting Trend Step Regression (TSR) line with color-coded dots instantly shows the current trend. Buy and Sellsignals appear only when a real reversal occurs, confirmed by minimum trend length and ADX strength. Visit my MQL5 blog profile to read the full guide. Support and questions via MQL5 product comments. For questions, updates, and to connect with other traders, join my official MQL5 group ForexEAandMore
Features: Clear visual TSR line Filtered reversal

Arrow Master
は MetaTrader 4 のチャートウィンドウ用インジケーターです。3層のカラーリボンでトレンド方向を表示し、必要に応じて売買矢印も描画します。 リボンは HalfTrend 型の反転ロジックです。Arrow Pulse 期間の高値・安値の移動平均と、価格単位の Arrow Shield を用います。条件成立で色が変わり、矢印を出せます。同じロジックをチャート時間足とマルチタイムフレーム表示に使います。 チャート上の機能: 太さの異なる3本のカラーライン 任意の上下矢印 現在シグナルのみの ATR エントリー / TP / SL ゾーン(価格が TP または SL に達すると削除) 任意ダッシュボード: 状態、シグナル価格と時刻、現在トレンドのバー数、M15 / H1 / H4 / D1、買い/売り比率バー 任意アラート: Alert、サウンド、メール、プッシュ 主な入力: DrawArrow、ArrowPulse、ArrowShield、Alerts グループ、ShowDashboard と位置、ShowATRZones、ATR_SLMultiplier

Midas Gold Weaver EA MT4
ゴールド向けのマルチタイムフレーム・トレンドEAです。段階的な追加エントリー、ニュースフィルター、口座保護機能を備えています。 詳細説明
Midas Gold Weaver EA は MetaTrader 5 用のエキスパートアドバイザーです。XAUUSD などのゴールド銘柄向けに設計されています。複数時間足でのトレンド確認と、最初のポジションから距離を広げながら追加エントリーするオプションを組み合わせています。 最初のポジションは、選択したシグナルが許可された売買方向と一致したときだけ開きます。標準の内蔵モードでは、EA が複数の時間足を読み取ります。価格が上昇中の移動平均より上ならその時間足は上昇、下降中の移動平均より下なら下降と判定します。十分な数の時間足が一致したときに新しいシリーズを開始できます。任意のフィルターにより、ボラティリティが低い場合や、モメンタムがすでに伸び切っている場合はエントリーを止められます。 最初のポジションの後、価格がバスケットに対して設定距離だけ逆行すると、同じ方向の追加ポジションを出せます。距離は

Trend Dot Indicator A fast-reacting Trend Step Regression (TSR) line with color-coded dots instantly shows the current trend. Buy and sell signals appear only when a real reversal occurs, confirmed by minimum trend length and ADX strength. Visit my MQL5 blog profile to read the full guide. Support and questions via MQL5 product comments. For questions, updates, and to connect with other traders, join my official MQL5 group ForexEAandMore
Features: Clear visual TSR line + dots (blue = up, red

AuraX Gold MT5
Technical indicator for MetaTrader 5 that plots SuperTrend support and resistance lines, generates buy and sell signals with ATR-based levels, applies higher timeframe, CCI, ADX and cooldown filters, displays economic news events, and includes an information dashboard.
For questions, updates, and to connect with other traders, join my official MQL5 group ForexEAandMore
AuraX Gold MT5 is a technical indicator for MetaTrader 5. It plots SuperTrend-based support and resistance l

UT Bot EA MT5 本EAは、確定足で計算されるUT Botシグナル(ATRトレーリングストップ)で取引します。 オプションのSMAフィルター:SMAより上でのみ買い、下でのみ売り。 オプションのRSIフィルター:買われ過ぎで買いをブロック、売られ過ぎで売りをブロック。 順方向グリッド(動きに沿った追加)とリカバリー(逆方向の平均化)を使用。バスケットは一括決済。 個別のテイクプロフィットはありません。カウンタートレンドRSIダイバージェンス(複数足保持可能)でバスケットを決済しリカバリーを停止できます。 ヘッジは調整可能な数の逆方向ポジションを開き、バスケットにはカウントされません。
質問、アップデート、他のトレーダーとの交流については、公式MQL5グループ ForexEAandMore にご参加ください。 セットファイルは私のブログにあります 。 Free UT Bot Indicator
取引には高い損失リスクが伴います。過去の実績は将来の結果を保証しません。