Pro Period Separators MT4
- インディケータ
- バージョン: 1.0
- アクティベーション: 20

Pro Period Separators For MetaTrader 4
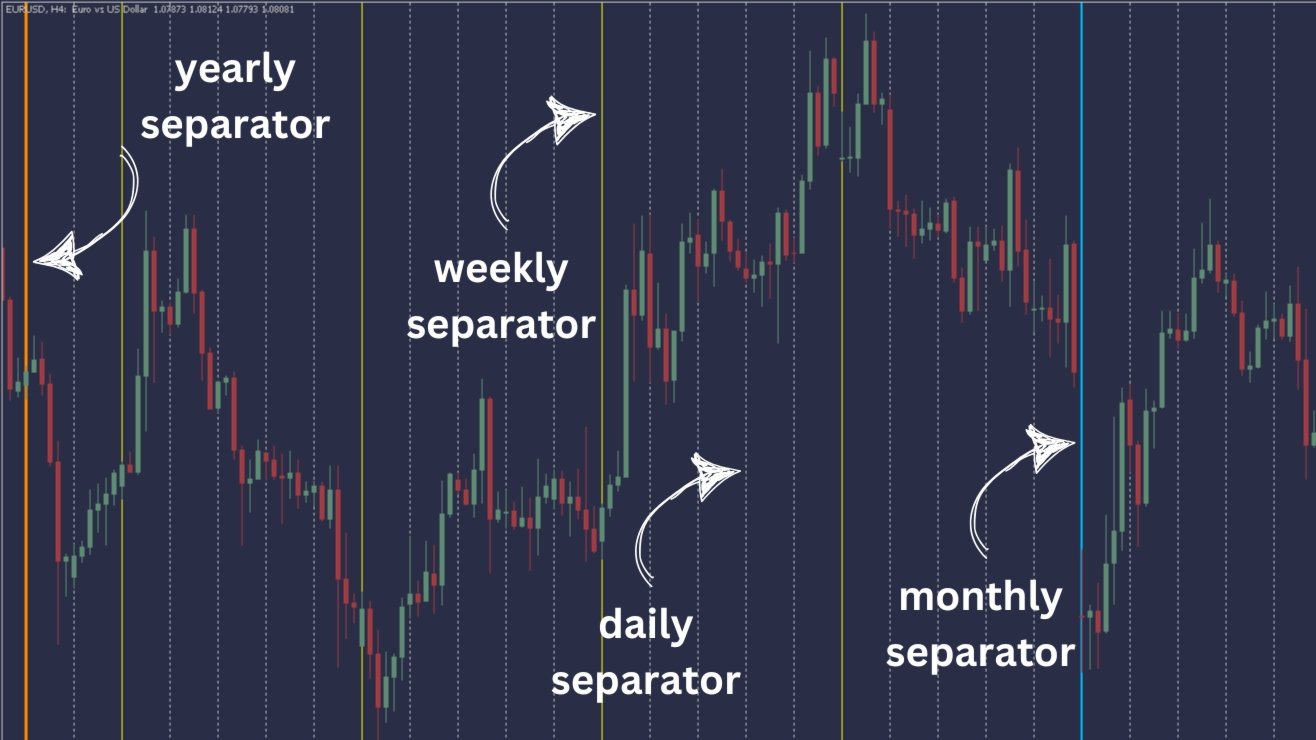
The built-in period separators feature doesn’t allow users to specify the time period, so you can use this indicator to create advanced period separators, you can add daily, weekly, monthly, yearly separators on any time frame.
Default Inputs
DAILY SEPARATOR SETTINGS
- show daily separators = Yes
- hour of the separators = 04
- minute of the separators = 00
- color of the separators = Silver
- width of the separators = 1
- style of the separators = STYLE_DOT
WEEKLY_SEPARATOR_SETTINGS
- show weekly separators = Yes
- week day of the separators = Monday
- hour of the separators = 00
- minute of the separators = 00
- color of the separators = Yellow
- width of the separators = 1
- style of the separators = STYLE_SOLID
MONTHLY_SEPARATOR_SETTINGS
- show monthly separators = Yes
- color of the separators = DeepSkyBlue
- width of the separators = 2
- style of the separators = STYLE_SOLID
YEARLY_SEPARATOR_SETTINGS
- show yearly separators = Yes
- color of the separators = OrangeRed
- width of the separators = 3
- style of the separators = STYLE_SOLID
MT5 Version: https://www.mql5.com/en/market/product/135644