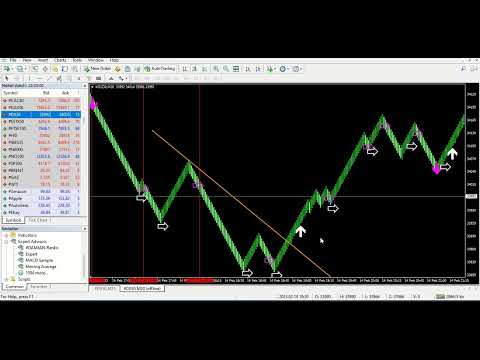
Median Renko Terminator
- インディケータ
- バージョン: 1.0
- アクティベーション: 5
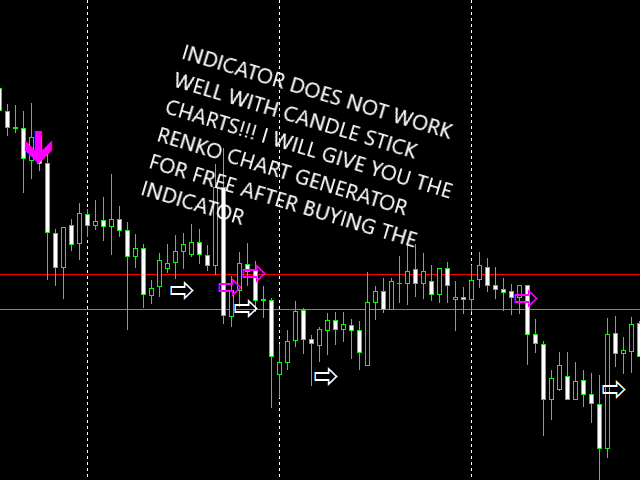
Median Renko Terminator works best with renko charts if you do not have a renko chart generator I will email it to you for free and give you the correct settings for scalping or to swing trade
NON-REPAINT
COMES WITH ALERTS WHEN THERE IS A SIGNAL
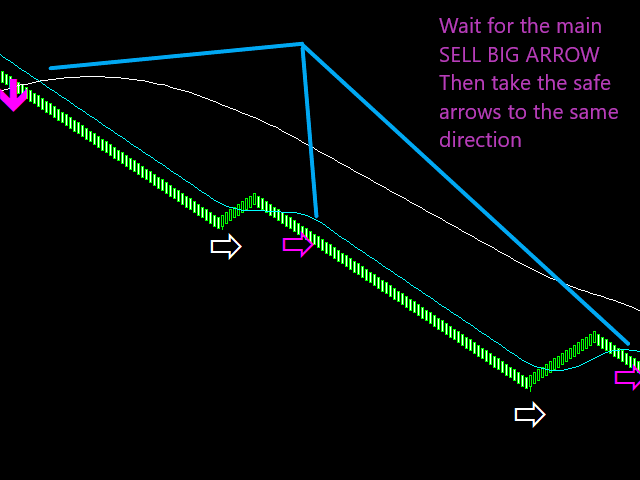
Conditions to sell: big purple arrow shows you the direction first then you take the small purple arrow to enter the same direction of the purple arrow.
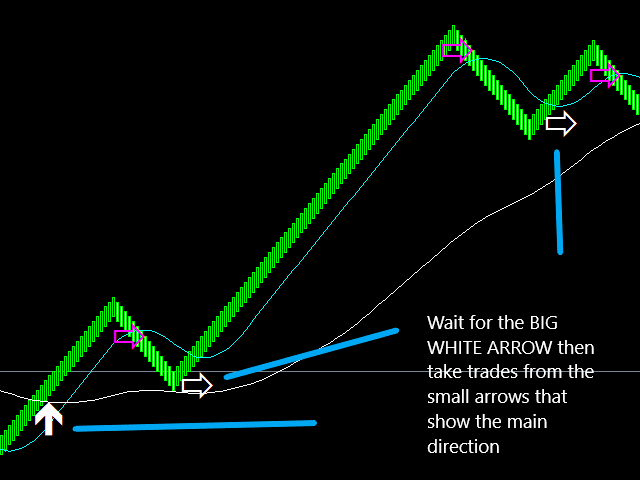
Conditions to buy: big white arrow shows you the up direction first then you take small white arrow to enter the same direction of the purple arrow.
Works on all pairs and with RENKO CHARTS.
Dont forget to request a renko chart generator after purchase.
No contact from seller since purchase. He has disabled incoming message facility so he cannot be contacted directly from this platform. Disappointing customer service. Still awaiting promised DAMJAN-Renko EA so unable to give review on product.
**UPDATE** Two days later and still no contact from seller. Caveat Emptor.
My Email has been sent to you in MQL5 Message.